Debugging the Android application using a browser
Have you ever had a situation where your application worked incorrectly for a single tester or on a single device? It seems that every developer is somehow familiar with this situation. And sometimes it can be quite difficult to find the cause of the problem due to the difficulty of obtaining information: there is no possibility to remove logs, look into the database or the Shared Preferences application, etc. Some of these problems can be solved simply by asking the tester to go into the browser.
This is exactly where the development of the Ultra Debugger library was started. At the moment it allows:
The library itself is built on modules. Due to this, if you wish, you can disable unnecessary functionality, as well as expand it by adding new modules.
To the developer
')
Library integration is very simple:
When you start the application, a line containing a link to the web interface will be displayed in the logs. The link is formed from the IP address of the smartphone and the port number specified when the start () method was called. If desired, the IP address of the smartphone and the port number can be obtained using the methods UltraDebuggerWrapper.getIp () and UltraDebuggerWrapper.getPort () and output them as a Toast or dialog box.
Tester
Using a tester library is also pretty simple. You just need to connect your smartphone and computer to the same WiFi network, type the IP address of the smartphone and the port in the browser (for example, 192.168.0.33:8090). You may need to unlock the smartphone and run the application. After that, the menu of connected modules will open and you can get the necessary information by clicking on the links. This is how, for example, file viewing
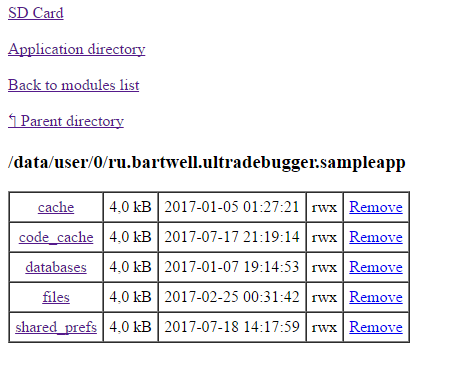
Yes, the WEB-interface looks spartan :) But it’s quite possible to get the necessary information.
Conclusion
Definitely there is a springboard for improvements. You can increase the number of modules, you can improve the UI and UX of the web interface, add tests and work on the quality of the code. Of course, this is all - the direct responsibility of the author of the library. But if Ultra Debugger suddenly seems useful to you and you have a desire to add a module or modify something - feel free to create a Pull Request, any help on the project is welcome.
This is exactly where the development of the Ultra Debugger library was started. At the moment it allows:
- Track application states using the saveValue (Context context, String key, Object value) method. You can see if the service is working right now, the last calculated value, etc.
- Write logs using the addLog method (Context context, String text [, Throwable throwable]).
- View and edit Shared Preferences.
- View and edit records in SQLite.
- View files, including files in the application folder.
- View the field values in the current activation.
- Call methods in the current activation.
The library itself is built on modules. Due to this, if you wish, you can disable unnecessary functionality, as well as expand it by adding new modules.
To the developer
')
Library integration is very simple:
- Register dependencies:
debugCompile 'ru.bartwell:ultradebugger:1.3' compile 'ru.bartwell:ultradebugger.wrapper:1.3'
As we can see, the main dependency connects only for debug builds. If necessary, you can connect it only for a certain flavor.
Separately connect the wrapper. This is optional, we can call library methods directly, but then it can be difficult to disable the library for release assemblies. It is a wrapper that invokes library methods using reflection. Yes, reflection is unproductive, but for debug builds this doesn’t seem so critical. - In the Application class, we initialize the library:
@Override public void onCreate() { super.onCreate(); // Wrapper debug- UltraDebuggerWrapper.setEnabled(BuildConfig.DEBUG); // - UltraDebuggerWrapper.start(this, 8090); }
BuildConfig.DEBUG can be replaced for example with BuildConfig.FLAVOR.equals ("dev") . - If necessary, add logs and save the desired values:
UltraDebuggerWrapper.saveValue (context, "SomeValue", 12345);
UltraDebuggerWrapper.addLog (context, "Some event");
When you start the application, a line containing a link to the web interface will be displayed in the logs. The link is formed from the IP address of the smartphone and the port number specified when the start () method was called. If desired, the IP address of the smartphone and the port number can be obtained using the methods UltraDebuggerWrapper.getIp () and UltraDebuggerWrapper.getPort () and output them as a Toast or dialog box.
Tester
Using a tester library is also pretty simple. You just need to connect your smartphone and computer to the same WiFi network, type the IP address of the smartphone and the port in the browser (for example, 192.168.0.33:8090). You may need to unlock the smartphone and run the application. After that, the menu of connected modules will open and you can get the necessary information by clicking on the links. This is how, for example, file viewing
Yes, the WEB-interface looks spartan :) But it’s quite possible to get the necessary information.
Conclusion
Definitely there is a springboard for improvements. You can increase the number of modules, you can improve the UI and UX of the web interface, add tests and work on the quality of the code. Of course, this is all - the direct responsibility of the author of the library. But if Ultra Debugger suddenly seems useful to you and you have a desire to add a module or modify something - feel free to create a Pull Request, any help on the project is welcome.
Source: https://habr.com/ru/post/333588/
All Articles