QML: how easy it is to get T-shirts in machine learning competitions for mail.ru

On Saturday, the monthly machine learning contest from mail.ru ML bootcamp 5 was completed . I took 14th place in it. This is my third contest in which I won clothes and during my participation I had a framework (which I, without thinking twice, called QML, an abbreviation for nickname and machine learning) to help me choose a solution for such competitions. Using the example of ML bootcamp 5 solution, I will describe how to use it.
As it should be, first show the goods face :)
- Saving intermediate results of model calculations for further use in metamodels (including the results of cross-qualifications)
- Models for various averages and stacking
- Supporting scripts for feature selection
So, let's start solving the competition (the entire solution scripts can be viewed here ).
First, we will clone the framework repository, install the missing packages described in the install file, and specify the settings in the config.py :
Next, create the necessary tables in the database from the file with the qml/db/schema.sql , create files with the id train and test set ( qml_workdir/data/ids_test.csv , qml_workdir/data/ids_train.csv ) and files with the first version of the data ( qml_workdir/data/v0001_test_x.csv , qml_workdir/data/v0001_train_x.csv , qml_workdir/data/train_y.csv ). How to do this leave outside the scope of this article.
Now create a file work.py , in which we write the code below and run it
# imports cv = QCV(qm) print(cv.cross_val(1, 1)) qm.qpredict(1, 1) 1 0.545776154551
2 0.545405471315
3 0.543444368229
4 0.539330473549
5 0.537107693689
0.542212832267
In three lines of code we:
- held a crossvalidation on 5 folds (hardcode) of model No. 1 from the models.py file
- fixed splitting to fold, so that later it was convenient to compare the results
- saw the result of each fold and the average result for the folds
- saved the results of cross-qualification in the database (see
qml_resultsandqml_results_statistic) - received a prediction file for test set (
qml_workdir/data/res/m0000001_d001__tr_70000_ts_30000__h_29c96aaed585f02e30096f265faca72c_s_1000.csv)
Delete the column with id and title and send it to the contest website. The result will be something like this:

With such a result, we would be on 497 place on the public board, and on the private board on 484 place.
Well, not enough. It's time to look at the data.
We see that in the fields weight , height , ap_hi and ap_lo there are a lot of incomprehensible data, we clean them , we add the body mass index and the BMI classes from the table.
In the test set, some subjective signs were removed, looking at the distribution of the values of these columns, replace NaN in active by 1, in smoke and alco by 0. We already have the 6th version of the data.
By the way, do not be surprised at such an activity among people of that age, so that during the clinical examination you are recorded as active, you only need to walk more than half an hour a day.
# imports cv = QCV(qm) print(cv.cross_val(1, 6)) qm.qpredict(1, 6) 1 0.545776154551
2 0.545405471315
3 0.543444368229
4 0.539330473549
5 0.537107693689
0.542212832267
Result:

477 on the public board and 470 on the private, C - stability :) But we have little stability, in this hot summer we need to go in cool black T-shirts.
Both times we ran the data through xgboost with the parameters set at random . We select the optimal parameters of the model using hyperopt .
An example of the selection of parameters. From the interesting in the script:
DATAS = [6]- you can tyunit on several versions of data at once- The
early_stop_cvparameter stopsearly_stop_cvwith the current parameters and returns the result of the current fold, if the callback returnsTrue, it is convenient to manually sort the folds in the saved partitions so that the fold with the highest CV score goes first. Then you can filter out unsuccessful models without waiting for validation for all folds num_boost_roundsandetanum_boost_roundsthrough in 1.3 stepsmodel_id = qm.add_by_params(..add to the database a model with such parameters so that it can later be loaded by numbertree_method='hist'- for haters of Microsoft productsseed=1000- we run each model by 8 sidam to reveal stability- the results of predictions of each fold from the splits for each sid are saved, which will be useful later for metamodels
Leaving the selection of parameters for the night in the morning, you can see what we have learned with the help of
select data_id, model_id, max(cv_diff), max(std), sum(sum_sc)/sum(cnt), sum(cnt), r.cv_time, m.cls, m.level, m.params from ( select model_id, fold, data_id, sum(cv_score) as sum_sc, std(cv_score) as std, max(cv_score)-min(cv_score) as cv_diff, count(*) as cnt from qml_results_statistic group by model_id, data_id, fold ) q left join qml_results r using (model_id, data_id) left join qml_models m using (model_id) group by data_id, model_id order by sum(sum_sc)/sum(cnt) limit 10000; Approximate result:
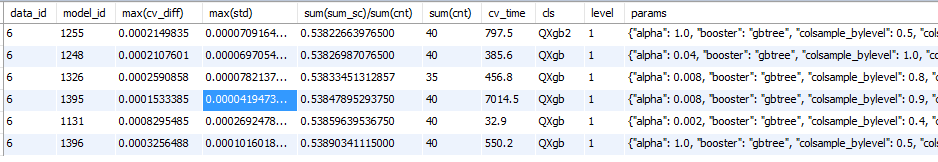
We see that the model 1255 is better in CV, but the spread of one fold among 8 sids is greater. Further to check the addition of signs we will use the model 1395, as the most stable of those found.
Since CV score has improved significantly, try sending:

Oh, 161 places on public leaderboard and 164 places on private! Better than Lev Litrovodochkin, who was in seventh in public, Vladimir Omelchenko (tenth) and Andriy Parkov (fourteenth).
It's time to overtake Valery Babushkina !
Let's create the twentieth version of the data , in which we add columns with alternate addition, subtraction, multiplication and division of combinations of two and three of the available columns.
If we drive our model on new data, the result will be worse than without them (If I knew about it during bootcamp 3 ..). it is necessary to add new columns one by one, to start cross-qualification and leave only if the result has improved.
Let's feed the resulting data to a similar script by specifying the available columns as the third parameter, the fourth columns that need to be checked.
From the interesting:
QAvgOneModelData(model_id, 8)- we run the crossvalidation not of the initial model, but averaging the predictions of the initial model with 8 different views for greater stabilityearly_stop_cv- again we do not chase all partitionslog_file='qml_workdir/logs/feat12.txt'- write the result of the work in the log file, sorting out which you can easily get the best column of the current run.
As a result, we found out that by adding columns below (47th version of the data), CV improves:
x__age__gluc_allx__ap_hi__cholesterol_alldiv6__height__gluc_all__imt-1/height/gluc_all*imtplus__age_norm__ap_hi_norm__gluc_all_normx__age__weightdiv1__age__weight__cholesterol_all-age*weight/cholesterol_alldiv6__age__weight__cholesterol_all-1/age/weight*cholesterol_allplus__height_norm__weight_norm__gluc_all_normdiv1__ap_hi__ap_lo__cholesterol_all-ap_hi*ap_lo/cholesterol_alldiv6__ap_hi__ap_lo__cholesterol_all-1/ap_hi/ap_lo*cholesterol_allplus__age_norm__gluc_all_norm__imt_normminus6__ap_hi_norm__ap_lo_norm__cholesterol_all_normminus1__ap_hi_norm__ap_lo_norm__cholesterol_all_normminus6__age_norm__ap_lo_norm__cholesterol_all_normminus1__age_norm__ap_lo_norm__cholesterol_all_normdiv6__height__weight__ap_lo-1/height/weight*ap_lodiv2__ap_lo__cholesterol_all__gluc_allx__age__ap_hi__gluc_alldiv5__ap_lo__cholesterol_all__gluc_all
Well, at least there was no imt * height * height column in this list.
Let's run our model on new data:

Oooh, 40 place on public and 81 on private. Valery is far behind, but oil chat hypnotists are looming ahead. Need to catch up.
Sit down to brainstorm:
- We take KMeans from the reference book
- We study the subject and find the SCORE scale
- We google how else it is possible to generate features, we find how people do it in Excel
We implement all this (the 66th version of the data) and once again run the tuning of the model on the final data.
{"alpha": 0.008, "booster": "gbtree", "colsample_bylevel": 0.6, "colsample_bytree": 1.0, "eta": 0.004, "eval_metric": "logloss", "gamma": 0.2, "max_depth": 4, "num_boost_round": 2015, "objective": "binary:logistic", "subsample": 0.7, "tree_method": "hist"} After that, alternately, we throw out one column and find out that without a column div6__height__weight__ap_lo CV score better and mercilessly throw it out (version 69).
We will drive the new best single model on the initial data:

Public - 26, private - 50. Hurray! The hypnotists got around, our shirt!
It seems to be time to stop, but I want more. Send averaging over 8 sidam of this model:

Public - 21 places (these averaging were chosen as one of the solutions, can be found under №0109872 from the dump ), private - 34 places. Hypnotists went around and in public.
Good but not enough. Let's generate different models and a little bit more . For some models, normalization and filling of NaN is performed.
We average and stack the best models on various data. After this we once again average the best second-level models.
From the interesting:
- Since results of cross-qualification of models are preserved, then miscalculation of averages occurs
instantly - The first calculation stacking for the model takes some time, then saved results are reused
- Kaggle Ensembling Guide
- Stacking and Blending
- Initially, I took xgboost and LogisticRegression as second-level models, but this did not work. Then I remembered that Valery Babushkin in the chat mentioned the ridge regression, when he was talking about Mercedes , googled, found an article from the paragraph above, began using it as a second-level model and everything turned out. And I bypassed it with a single xgboost. It turned out badly.
My second final model is averaging 7 stacks on different numbers of models with different data. If you are interested in cramming, then this is model number 109639 from dump
On the public board, this model gave a worse result than just averaging over 8 sidims of various single xgboost, but I believed in crossvalidation and selected it. From the xgboost averages, I chose such averaging so that the CV results on the folds were different from the stack model, i.e. on some folds the stack model was noticeably better (-0.0001), on others it was noticeably worse
Yes, the headline turned out to be yellow, it was not as easy as some of the winners:
1 Nikita Churkin
2 Rome Shayakhmetov
3 Ivan Filonov
4 Alexander I-MORTIDO by
9 Ivan Tyamgin (caution, Rr -r)
')
Source: https://habr.com/ru/post/333554/
All Articles