The recommendation of the first track for streaming. Lecture in Yandex
Now is the Data Science Game - an international student competition in data analysis. The guys from Moscow State University won the qualifying round, and then talked about their decision at one of our machine-training sessions .
Under the cut - the decoding and most of the slides.
Vsevolod Vikulin:
- Hello. We will talk about the qualifying stage of the international competition, which is called the Data Science Game. Our team represented Moscow State University and consisted of Darya, me and two other people.
')
Competition is already trying to hold on a regular basis. We will talk about the qualifying stage. The finals are held in September. We took first place there. And it’s nice to see that the Russian teams are in the first top places with medals. So Russian data science demeans everyone.
We proceed to the formulation of problems. There is a certain site Deezer where you can listen to music. They have a Flow advisory system that prompts the user to listen to a song.
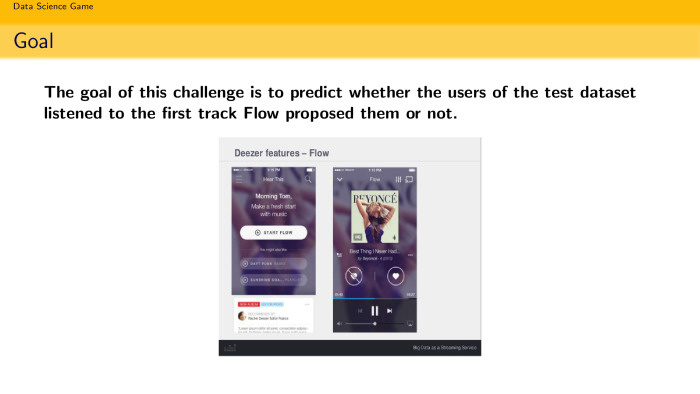
User statistics are known: what he listened to when he listened, and there is an event that Flow recommends a song to some user. The task is to find out whether he will listen to it or not. It is put quite funny. The term "listen" means if he has listened to it for 30 seconds. If you listened for 30 seconds and skipnul - then listened. We had a temptation to solve with superfashionable schemes that take place in the ShAD, some kind of collaborative filtering, filtration machines. In fact, all this is not necessary, this is all unnecessary. You only need to take XGBoost and consider the task of classification. This is the simplest solution. Namaynil features, stuffed in XGBoost, got some kind of score. The whole report consists of building good features.
We didn’t bother so much on the model, we didn’t even tune it, as we took out of the box, so we set it.
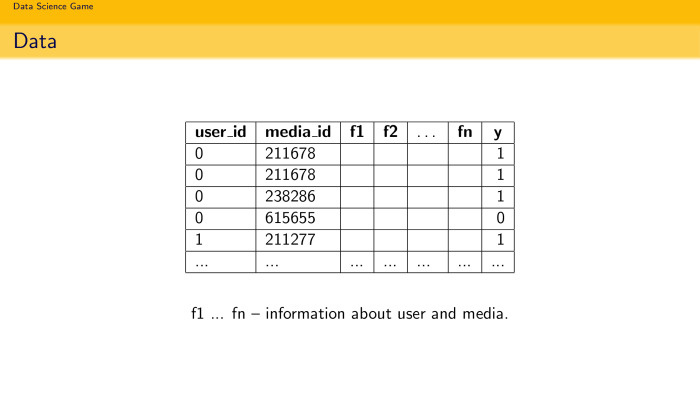
Gently go to dataset. There were 7.5 million user and media pairs, that is, a person and a track with some id, some features and a target variable - listened to the song for more than 30 seconds or not.
It is important that there were not only songs that Flow recommended. There were more songs that the user himself listened to or poked during an online radio. And there was a special certificate that said whether it was a recommendation or not. At the same time in the test set of 30 thousand pairs it was necessary to determine, 1 or 0, only for those users who are recommended by the system.
We go to id-related features. Gender, age. But we know that this is not all.
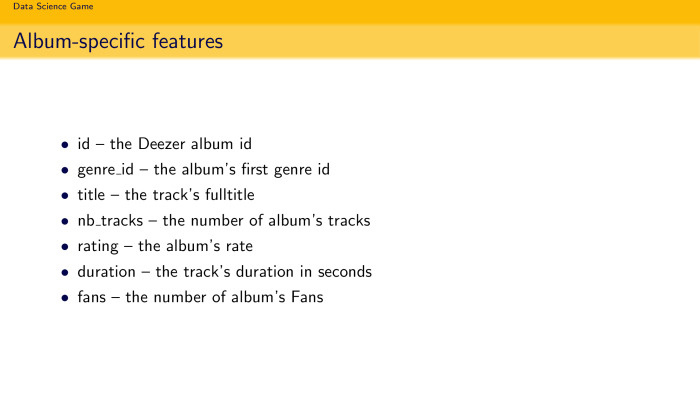
The features about the music, its duration, the artist's id, the genre - everything is also unimportant.

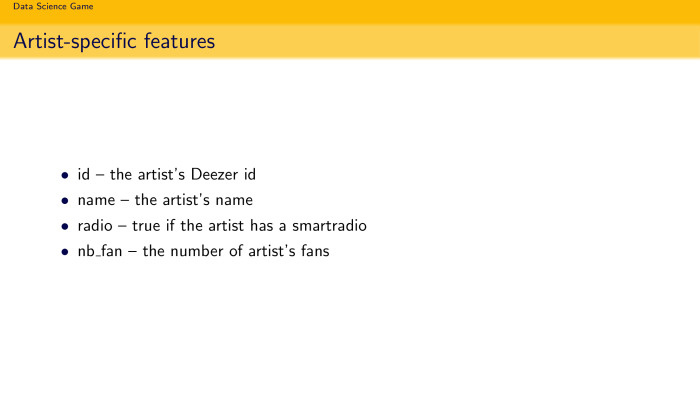
Id, on what I listened ... We parsed their API - it was allowed by the contest rules - and got some features related to the artist: his name, what genre he performs, the number of fans. But all this is not very strongly played, as well as features on the album.
Every person who solved such problems knows that this does not affect them. Title song does not affect whether you listen to it or not. One most important thing affects: if you listened to this song or listened to a song of a similar nature, then you will listen to it again. If you have a preference for listening to Beyonce, you are unlikely to listen to Eminem, it happened. Therefore, you need to do behavioral features. They are the most influential, and they resolve the most. We will talk about them.
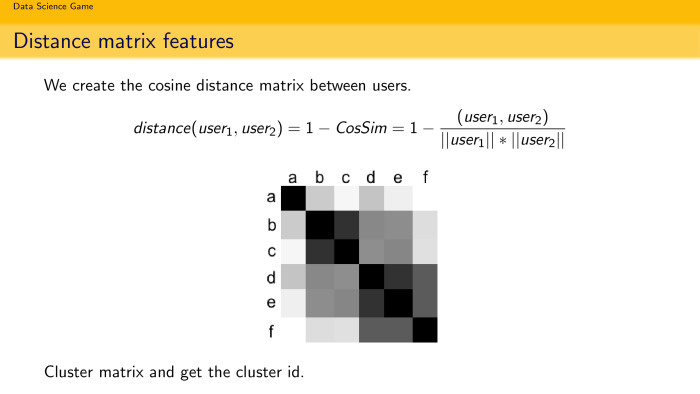
The first good location is to build a distance matrix. You can measure how similar users are. The standard approach in the recommendations: there is a huge matrix of the size of the number of users per number of users, and you want to see how user A looks like user B. How to do this? You can stupidly take all the songs that both users listened to and see what the distance is. A person who likes to count everything quickly - he counts the cosines of distances, because it counts quickly. You can quickly estimate a hefty matrix. Since we have only a few thousand, you can even (inaudible - ed.). And you can cluster, find clusters. In theory, if you took a cluster of Russian rap fans ... a very sad cluster, but it will be. And it is clear that if you have a cluster of Russian rap fans, will the user listen to the song Beyonce? Unlikely. The feature is quite logical, and this is the first thing that comes to mind when you work with the task of recommendation.
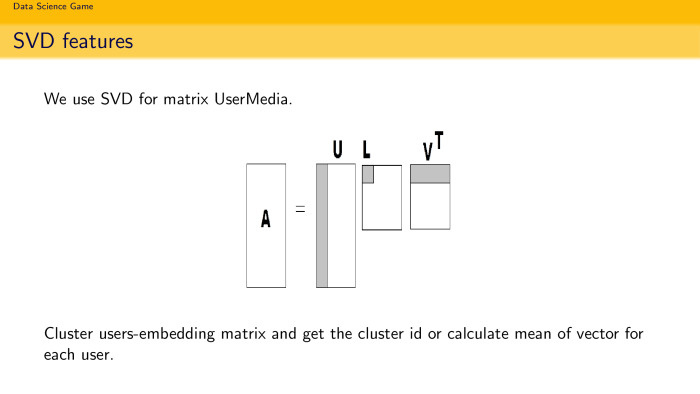
The second idea: we all know LSA, latent semantic analysis, it is often embedding in text decompositions. Why not try such embedding, but already in the recommendation task? You have a matrix A - just a matrix, in rows the same number of users, and in columns the number of songs. 1 - if you listened, 0 - if you did not listen. You can make SVD decomposition and take k components. And assume that k components are just embedding users in the space of songs. So do in the text, why not do so? Moreover, the size is quite healthy, there will be 450 thousand different songs. The matrix was, conditionally, 5 to 450 thousand. It is quite healthy, of course, it is sparse. You can calmly decompose it and get embedding users by song. You can cluster them, search for fans of Russian rap and find the average vector in this embedding, use it as a feature.
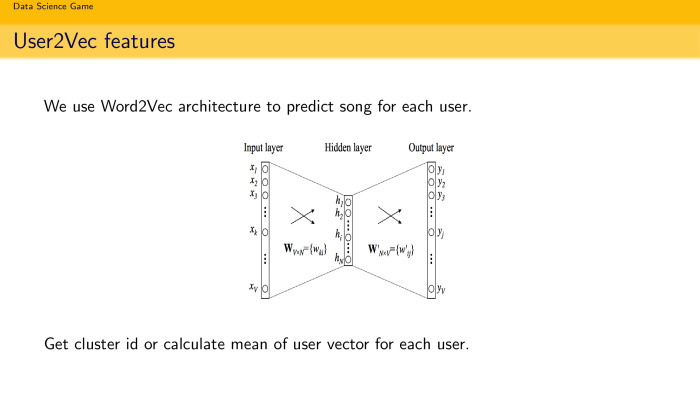
And the last piece is user2vec. Prikolyukha is my own term. We all love word2vec, because it works fast. Why not use the same terminology and architecture to predict songs? At the input, you give the floor if it is a skip-gram architecture, and you predict the context. Or you give the word and predict the context, if it is CBOW. Why not use the same simple idea, but for the task of recommending songs? We have a user, we want to decompose it into some reasonable vector. We know what songs the user is listening to. We make a simple neuron with a single hidden-condition, which is fairly quickly configured, give some kind of user image to the input, such as a longshot, and at the output we expect it to predict a song for it, and set the loss function, some softmax here, just run so all users. It's quite funny that in a few hours you get an open-ended view for each user. When you want to find out how a user decomposes according to songs, you skip him through the entrance and see the meaning of the hidden condition. If there were 128 measurements, you get a 128-dimensional vector in the space of songs. You can also cluster them and calculate the average. And use as behavioral features.
And then charming Daria will tell you how to make a super-complex decision that led us to the first place.
Daria Sobolev:
- Hello. My name is Soboleva Daria, I study at Moscow State University in my third year at the faculty of the CMC at the department of MMP. Yes, we had four people in the team. Two people - Vsevolod and Nikita Shapovalov - were engaged in feature-engineering, they parsed the API, generated smart features, and I and another person, Nikolay Popov, built the model itself.

I will tell you what additional features, but not as smart as the guys, we naked. Conventional, which we always use from competition to competition. Good practice is always, if you have categorical signs, count the size of category K, the average value of the target variable within each category. Plus, due to the fact that we somehow use the target variable, this can easily lead to retraining. If you have, for example, a category is too small and consists of only one value, then the average value of the target variable inside this category will simply coincide with this target variable. That is, we will retrain.
A well-known technique is the smoothed average of the target variable, which was explained by Stas Semenov. This is a formula. Let's calculate the global average of the target variable across the entire network and take the smoothed relation, that is, the average value of the target variable in the category, report the size of the category and add the global average multiplied by magic number 10. Actually, this should be the alpha parameter. Since this parameter should be adjusted by cross-qualification, we didn’t have much time, and it didn’t really affect, we decided to put just 10, and it behaved normally.
This formula shows that if our category size is too small — for example, K tends to zero — then this formula will simply turn into a global average. That is, you will be less retrained.
After the feature-engineering and such simple basic features that we generated, we submitted the solution and immediately got into the top-2.

Then I decided to add a few features. I have been using this technique for several competitions in a row. It is based on the fact that if we use the target variable, we still somehow retrain, inevitably. So let's try to come up with something similar, only unsupervised, without a target variable. I build a random forest and take the feature importance from it, and take the top K of real signs. I think the same thing. I imagine that this real feature is a target variable. We will consider statistics on them.
What is good? First of all, if you have a binary classification task, then you have a target variable of just 0 and 1, and you do not count anything good in terms of categories other than the average or smoothed average. If you have a good real sign that correlates with the target or something, the top one according to random forest, then you can calculate various other statistics and generate much more features. For example, I took the maximum, median, average, minimum, all sorts of quantiles. All this can be stuffed, and you will have some additional signs.
After we added these signs, the model almost immediately became ... It should be noted that we had the Ukrok quality metric, and for a long time - especially for the teams from Russia - they hid their score. That is, they took 1 minus score, and no one saw how it works there. This can be borne in mind when you participate in such competitions. We found out the final score only on a private leaderboard, and before that very few people saw it.
There was a question about how to validate. We decided to do quite naturally. Since in the test there were tracks that were offered to the user later than those that were in the training set, it was decided to push the last track of each user into the validation, the last time stamp.
I at all competitions try to evaluate the quality on three things: on the train, on validation and on the leaderboard. And it is desirable that they somehow correlate. Therefore, we decided to build a validation as follows. All statistics, which was considered by the target variable ... at the moment we must look to the future. To do this, we took the train, pinched each user for one track, thrust it into the test sample, then we considered the statistics on the training sample on the target variable and Merjili already with our new test object.
We did this five tracks back, validation was built five tracks back. As Seva said, there were 7.5 million objects, so it was very difficult to study throughout history.
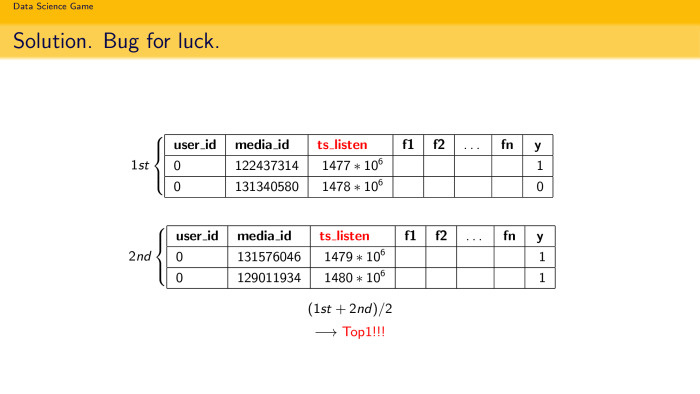
Due to the fact that we had very little memory, we did everything in place. When in the train we pinch the last track of each user, we really remove it from the train, add validation and consider the statistics for the train. And of course, at some point this led to the appearance of a bug, which then flew into the top-1.
Suppose we pinched off five tracks, counted all the statistics on the training set for these five tracks for each user, formed one model card. She trained, got the top 2. Then they launched the same script again, where in the train the last six tracks of each user are already missing. They taught the same model, predicted the same thing, only she was trained as if already on the seventh, eighth, and so on, up to the twelfth track for each user. Trained, she gave the top 2. And their average gave a top-1. This is probably logical. We took into account the interests of the user at different intervals. Most likely, therefore the decision also has flown up.
We also liked the competition very much, so after its completion we decided to try something else. We became top-1, but at the same time there was a desire to improve.
I decided to try to calculate statistics on the target variable. We counted it in single categories, in pairs of categories (indiscernible - ed.), But I decided to count in three more. I did not see a significant improvement, there were already 1,500 signs, and the model is quite complicated, the XGBoost ensemble. So this idea has not passed.
Passed another idea. Nikolay Popov decided to modify (recording failure - approx. Ed.) Songs. We take two consecutive tracks, listened by the user, take the “dich” of time between the wiretaps. If it fits into the duration of the track, then we divide it by this very duration. And we get something like a rating song, but otherwise just put down the original target.
Having trained all the same, but considering the statistics on the converted target, we then averaged the model calculated by the original target and the converted one and beat our top-1 solution. It's all.
Under the cut - the decoding and most of the slides.
Vsevolod Vikulin:
- Hello. We will talk about the qualifying stage of the international competition, which is called the Data Science Game. Our team represented Moscow State University and consisted of Darya, me and two other people.
')
Competition is already trying to hold on a regular basis. We will talk about the qualifying stage. The finals are held in September. We took first place there. And it’s nice to see that the Russian teams are in the first top places with medals. So Russian data science demeans everyone.
We proceed to the formulation of problems. There is a certain site Deezer where you can listen to music. They have a Flow advisory system that prompts the user to listen to a song.
User statistics are known: what he listened to when he listened, and there is an event that Flow recommends a song to some user. The task is to find out whether he will listen to it or not. It is put quite funny. The term "listen" means if he has listened to it for 30 seconds. If you listened for 30 seconds and skipnul - then listened. We had a temptation to solve with superfashionable schemes that take place in the ShAD, some kind of collaborative filtering, filtration machines. In fact, all this is not necessary, this is all unnecessary. You only need to take XGBoost and consider the task of classification. This is the simplest solution. Namaynil features, stuffed in XGBoost, got some kind of score. The whole report consists of building good features.
We didn’t bother so much on the model, we didn’t even tune it, as we took out of the box, so we set it.
Gently go to dataset. There were 7.5 million user and media pairs, that is, a person and a track with some id, some features and a target variable - listened to the song for more than 30 seconds or not.
It is important that there were not only songs that Flow recommended. There were more songs that the user himself listened to or poked during an online radio. And there was a special certificate that said whether it was a recommendation or not. At the same time in the test set of 30 thousand pairs it was necessary to determine, 1 or 0, only for those users who are recommended by the system.
We go to id-related features. Gender, age. But we know that this is not all.
The features about the music, its duration, the artist's id, the genre - everything is also unimportant.
Id, on what I listened ... We parsed their API - it was allowed by the contest rules - and got some features related to the artist: his name, what genre he performs, the number of fans. But all this is not very strongly played, as well as features on the album.
Every person who solved such problems knows that this does not affect them. Title song does not affect whether you listen to it or not. One most important thing affects: if you listened to this song or listened to a song of a similar nature, then you will listen to it again. If you have a preference for listening to Beyonce, you are unlikely to listen to Eminem, it happened. Therefore, you need to do behavioral features. They are the most influential, and they resolve the most. We will talk about them.
The first good location is to build a distance matrix. You can measure how similar users are. The standard approach in the recommendations: there is a huge matrix of the size of the number of users per number of users, and you want to see how user A looks like user B. How to do this? You can stupidly take all the songs that both users listened to and see what the distance is. A person who likes to count everything quickly - he counts the cosines of distances, because it counts quickly. You can quickly estimate a hefty matrix. Since we have only a few thousand, you can even (inaudible - ed.). And you can cluster, find clusters. In theory, if you took a cluster of Russian rap fans ... a very sad cluster, but it will be. And it is clear that if you have a cluster of Russian rap fans, will the user listen to the song Beyonce? Unlikely. The feature is quite logical, and this is the first thing that comes to mind when you work with the task of recommendation.
The second idea: we all know LSA, latent semantic analysis, it is often embedding in text decompositions. Why not try such embedding, but already in the recommendation task? You have a matrix A - just a matrix, in rows the same number of users, and in columns the number of songs. 1 - if you listened, 0 - if you did not listen. You can make SVD decomposition and take k components. And assume that k components are just embedding users in the space of songs. So do in the text, why not do so? Moreover, the size is quite healthy, there will be 450 thousand different songs. The matrix was, conditionally, 5 to 450 thousand. It is quite healthy, of course, it is sparse. You can calmly decompose it and get embedding users by song. You can cluster them, search for fans of Russian rap and find the average vector in this embedding, use it as a feature.
And the last piece is user2vec. Prikolyukha is my own term. We all love word2vec, because it works fast. Why not use the same terminology and architecture to predict songs? At the input, you give the floor if it is a skip-gram architecture, and you predict the context. Or you give the word and predict the context, if it is CBOW. Why not use the same simple idea, but for the task of recommending songs? We have a user, we want to decompose it into some reasonable vector. We know what songs the user is listening to. We make a simple neuron with a single hidden-condition, which is fairly quickly configured, give some kind of user image to the input, such as a longshot, and at the output we expect it to predict a song for it, and set the loss function, some softmax here, just run so all users. It's quite funny that in a few hours you get an open-ended view for each user. When you want to find out how a user decomposes according to songs, you skip him through the entrance and see the meaning of the hidden condition. If there were 128 measurements, you get a 128-dimensional vector in the space of songs. You can also cluster them and calculate the average. And use as behavioral features.
And then charming Daria will tell you how to make a super-complex decision that led us to the first place.
Daria Sobolev:
- Hello. My name is Soboleva Daria, I study at Moscow State University in my third year at the faculty of the CMC at the department of MMP. Yes, we had four people in the team. Two people - Vsevolod and Nikita Shapovalov - were engaged in feature-engineering, they parsed the API, generated smart features, and I and another person, Nikolay Popov, built the model itself.
I will tell you what additional features, but not as smart as the guys, we naked. Conventional, which we always use from competition to competition. Good practice is always, if you have categorical signs, count the size of category K, the average value of the target variable within each category. Plus, due to the fact that we somehow use the target variable, this can easily lead to retraining. If you have, for example, a category is too small and consists of only one value, then the average value of the target variable inside this category will simply coincide with this target variable. That is, we will retrain.
A well-known technique is the smoothed average of the target variable, which was explained by Stas Semenov. This is a formula. Let's calculate the global average of the target variable across the entire network and take the smoothed relation, that is, the average value of the target variable in the category, report the size of the category and add the global average multiplied by magic number 10. Actually, this should be the alpha parameter. Since this parameter should be adjusted by cross-qualification, we didn’t have much time, and it didn’t really affect, we decided to put just 10, and it behaved normally.
This formula shows that if our category size is too small — for example, K tends to zero — then this formula will simply turn into a global average. That is, you will be less retrained.
After the feature-engineering and such simple basic features that we generated, we submitted the solution and immediately got into the top-2.
Then I decided to add a few features. I have been using this technique for several competitions in a row. It is based on the fact that if we use the target variable, we still somehow retrain, inevitably. So let's try to come up with something similar, only unsupervised, without a target variable. I build a random forest and take the feature importance from it, and take the top K of real signs. I think the same thing. I imagine that this real feature is a target variable. We will consider statistics on them.
What is good? First of all, if you have a binary classification task, then you have a target variable of just 0 and 1, and you do not count anything good in terms of categories other than the average or smoothed average. If you have a good real sign that correlates with the target or something, the top one according to random forest, then you can calculate various other statistics and generate much more features. For example, I took the maximum, median, average, minimum, all sorts of quantiles. All this can be stuffed, and you will have some additional signs.
After we added these signs, the model almost immediately became ... It should be noted that we had the Ukrok quality metric, and for a long time - especially for the teams from Russia - they hid their score. That is, they took 1 minus score, and no one saw how it works there. This can be borne in mind when you participate in such competitions. We found out the final score only on a private leaderboard, and before that very few people saw it.
There was a question about how to validate. We decided to do quite naturally. Since in the test there were tracks that were offered to the user later than those that were in the training set, it was decided to push the last track of each user into the validation, the last time stamp.
I at all competitions try to evaluate the quality on three things: on the train, on validation and on the leaderboard. And it is desirable that they somehow correlate. Therefore, we decided to build a validation as follows. All statistics, which was considered by the target variable ... at the moment we must look to the future. To do this, we took the train, pinched each user for one track, thrust it into the test sample, then we considered the statistics on the training sample on the target variable and Merjili already with our new test object.
We did this five tracks back, validation was built five tracks back. As Seva said, there were 7.5 million objects, so it was very difficult to study throughout history.
Due to the fact that we had very little memory, we did everything in place. When in the train we pinch the last track of each user, we really remove it from the train, add validation and consider the statistics for the train. And of course, at some point this led to the appearance of a bug, which then flew into the top-1.
Suppose we pinched off five tracks, counted all the statistics on the training set for these five tracks for each user, formed one model card. She trained, got the top 2. Then they launched the same script again, where in the train the last six tracks of each user are already missing. They taught the same model, predicted the same thing, only she was trained as if already on the seventh, eighth, and so on, up to the twelfth track for each user. Trained, she gave the top 2. And their average gave a top-1. This is probably logical. We took into account the interests of the user at different intervals. Most likely, therefore the decision also has flown up.
We also liked the competition very much, so after its completion we decided to try something else. We became top-1, but at the same time there was a desire to improve.
I decided to try to calculate statistics on the target variable. We counted it in single categories, in pairs of categories (indiscernible - ed.), But I decided to count in three more. I did not see a significant improvement, there were already 1,500 signs, and the model is quite complicated, the XGBoost ensemble. So this idea has not passed.
Passed another idea. Nikolay Popov decided to modify (recording failure - approx. Ed.) Songs. We take two consecutive tracks, listened by the user, take the “dich” of time between the wiretaps. If it fits into the duration of the track, then we divide it by this very duration. And we get something like a rating song, but otherwise just put down the original target.
Having trained all the same, but considering the statistics on the converted target, we then averaged the model calculated by the original target and the converted one and beat our top-1 solution. It's all.
Source: https://habr.com/ru/post/333440/
All Articles