Applications in the electronic document management system. Part 6: Views
Continuing the series of articles about applications of the SED, we will focus on an object such as views. Views is an element of the system that allows you to view lists of documents and tasks organized in a specific way in the context of an application. In my opinion, this is the most specific object that probably distinguishes the electronic document management system from other types of systems, let's look at it in more detail.
As noted in the very first publication, the application in the electronic document management system (in our case, Docsvision) is assembled from relatively independently configurable components: documents (document cards), processes and tasks, views and folders. Representation in the EDS, in contrast to the usual table in the accounting system - a much more flexible tool. This is due to the need to display in one tabular view the most different types of objects that can be used in the application, and to form a specific context of this display. In addition, views should allow application users to perform a variety of actions on objects that are displayed in the view in accordance with the business logic of the applications. A feature of EDS, and Docsvision in particular, is the need to customize the presentation without programming.
The concept of presentation, implemented in Docsvision, creatively develops the ideas embodied in the legendary and at one time exclusively revolutionary Lotus Notes product, in which such objects first appeared. The views were probably the main feature of the Lotus Notes system, and I, who are quite familiar with traditional database development, found it very difficult to understand the purpose of this component when more than 20 years ago I was at one of the first trainings on this system in Russia.
On the one hand, this is a regular table displaying a group representation of some objects. Each line corresponds to an element (in our case, a document), and fields are displayed in a line. The table can be sorted, filtered, initialized to work with the document from it, perform various operations, in particular, group (for example, export documents, change their status).
')

Fig.1 Example of Docsvision presentation
The specificity of the presentation is that in one table documents of different types can be displayed (some analogue to Join tables in a database), while you can display absolutely any object in the view, display any field of it, as well as various derived data. Let me explain a little more.
There are 2 possibilities. The first is to apply the view to the folder with documents, that is, to display in the view the documents stored in the physical folder. Different types of documents containing a different set of metadata (attributes) can be stored in the Docsvision folder.
The second is to apply the view to the so-called virtual folder - this is the folder that displays the result of some search query, which may include full-text and attribute components. Documents of various types can also appear in a virtual folder, and it is not even possible to predict in advance what, because it can contain documents corresponding to a full-text query, which is applicable to documents of any type. Each document will be displayed as a separate line or group of lines (more on this below).
A view is a table, in each column of which there is data of a certain type and semantics. In the given example it is the type of the document, its number, the author of the document, the controller and the deadline.
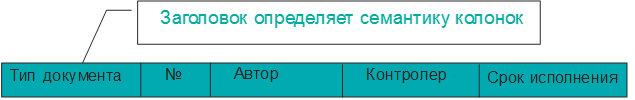
Fig. 2. The semantics of the header of the table view.
At the same time, in various types of documents, attributes for displaying in one or another column of the presentation may be contained in different metadata fields. In our example, the attribute that should be displayed in the “Deadline” column in the “Order” type document is contained in the “Execute before” field, in the “Incoming” type document - in the “Due Date” field, in the Task - in the “Date complete, ”and in the Outgoing there is no attribute with such semantics at all. However, the presentation allows you to collect all this into a single table and get a general view on the deadlines for the execution of documents of various types.
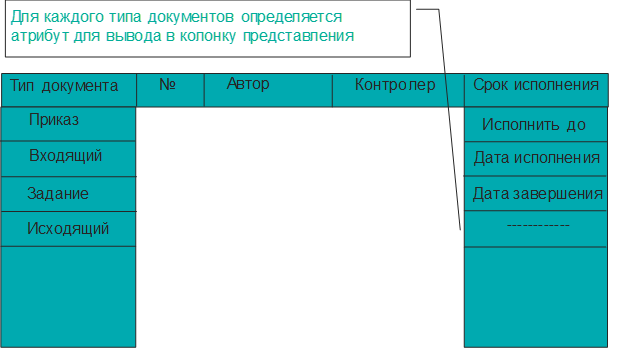
Fig. 3. The order of displaying attributes of documents of various types in the view column.
Of course, a developer who is accustomed to creating “traditional” applications may be puzzled - how could one design such a strange application, in which a single data model of all system objects was not thought out in advance and such a strange mechanism was needed? However, here we must remember that the SED is not a monolithic application. An ERMS is a platform in which individual applications (including various types of documents and presentations) can be created at different times by different developers, can be purchased in a ready-made form and tuned in during operation. All this leads to the fact that it is impossible to ensure information integrity (for example, to preserve a single attribute naming policy). But these independently created applications form as a result a system of “accumulating the knowledge of an organization” and this mechanism is implemented to ensure the information “integrity” of this system from the user's point of view.
In addition to the name of the presentation column, it is possible to determine the type of data displayed in the column and the format: for example, the format of the date or fractional number, which will affect the sorting method.
As we said earlier, the document attributes can be arranged in tables. If necessary, attributes can be displayed in the view, for example, if the document contains a set of files, each of which has its own set of attributes, for example, the creation date and name. It is possible to create a view in which, when displaying a document in a table, it will be assigned to as many lines as the file contains a document, and in each line the name and date of the corresponding file will be displayed.
In the view, you can display not only the value of specific attributes of documents, but also attributes of card files and reference books associated with the original. For example, display in the view the individual attributes of the document and tasks that are associated with this document. Another example of such a complex representation is the display of contracts and their attributes and a list of acts (and their attributes) associated with a given contract. You may need to display attributes of objects that are in a more complex relationship with the document. For example, you may need to display the data (say, the phone number) of the employee who is performing the task on the document. The case is very practical - using such a view, we can quickly call an employee who delays the execution of the document, without having to open the staff directory. If we look at the information structure, we will see that the phone number is not stored in the document or in the associated card, but in the staff directory, which is indicated by the field of the task card associated with the document. The system allows you to display data from various objects in the view that are directly connected to the displayed document, or connected via intermediate objects (as in the example of the employee’s phone).
An even more complicated case is the consideration of certain conditions when displaying the data of related objects. For example, when displaying related tasks and, correspondingly, phone numbers of employees is necessary only for tasks for which there are problems, in order not to overload the submissions with unnecessary data. Such conditions can also be taken into account when describing the structure of the presentation.
In some cases, there is a need in the view to display synthetic data that is calculated based on the data of the displayed document itself or objects associated with it. For example, you can display the number of tasks related to the document, or the total amount of acts closed under the contract. Certain conditions can be imposed on the calculated fields: for example, display only the number of outstanding tasks or separately calculate the amount of closed acts, and at the same time take into account that they are closed in rubles and dollars.
If necessary, the data in the view can be grouped by the values of one or another column of the table. And, if we recall that the column can display the values of different attributes of different types of objects, it turns out that we can group objects by fields that are represented by different attributes in different types of cards. At each level of grouping, various numerical aggregates can be calculated - the total number of elements, the sum and average for numerical fields, etc.
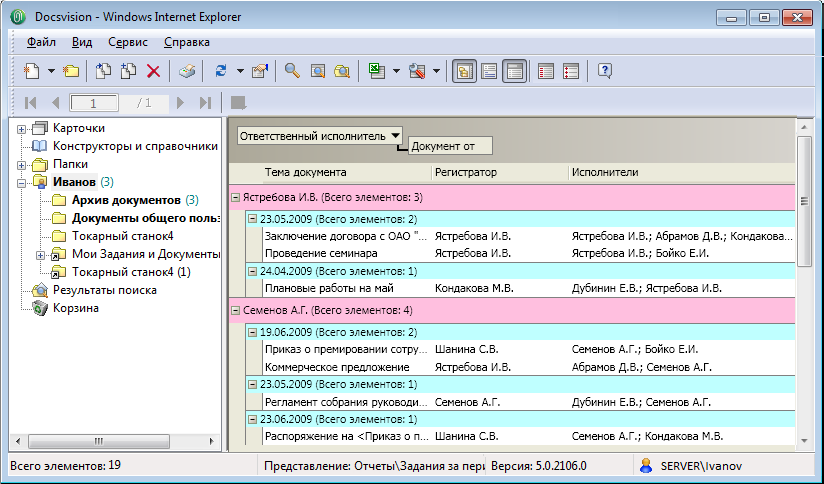
Fig. 4. Sample view with groupings and calculation of aggregation values.
The system allows you to customize the visual design of the presentation: fonts, background color, separator format, etc., and if necessary, you can define different color selections for different elements (rows) of the table, depending on the conditions (values of individual table fields). For example, there may be highlighted documents for which the deadlines for execution have been violated, or those whose deadline will occur in the near future. The system of setting the visual selection is quite flexible and allows you to solve all practical problems arising in the development of applications. In Figure 4, the lines in which the units are displayed are highlighted in color, and in Figure 1 the completed tasks are highlighted in green and the stitched ones in orange.
Another useful feature provides better readability of reports - the ability to display individual attributes of a document as a string that ignores the division of a table into columns, just as in Outlook you can make the contents of a letter directly in a table view.

Fig. 5. A summary of the documents is displayed in a separate line in the view for each document.
The customized view will be equally displayed in all clients: “heavy”, light (HTML) and mobile, automatically adapting to the type of form factor.
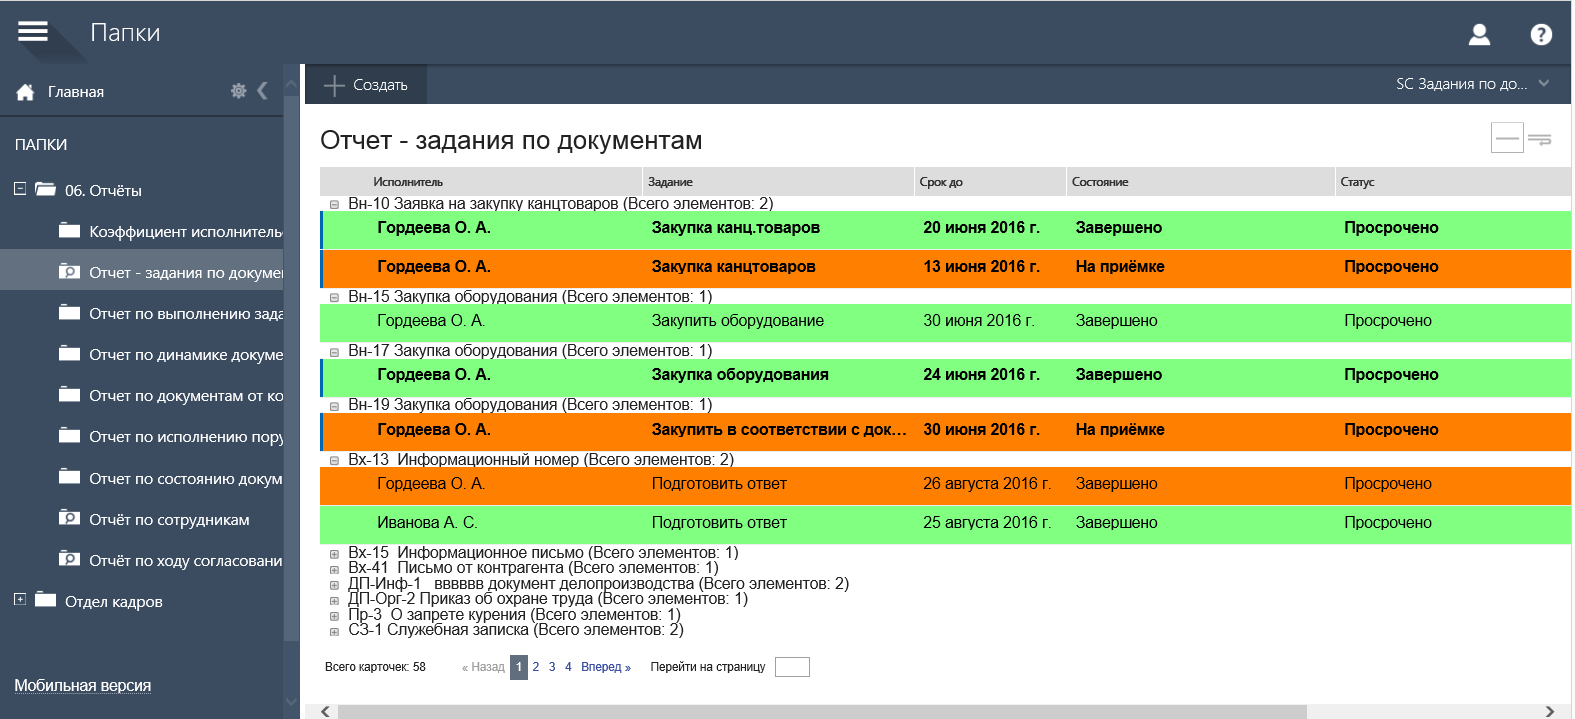
Fig.6. Displaying the presentation in the Docsvision light client
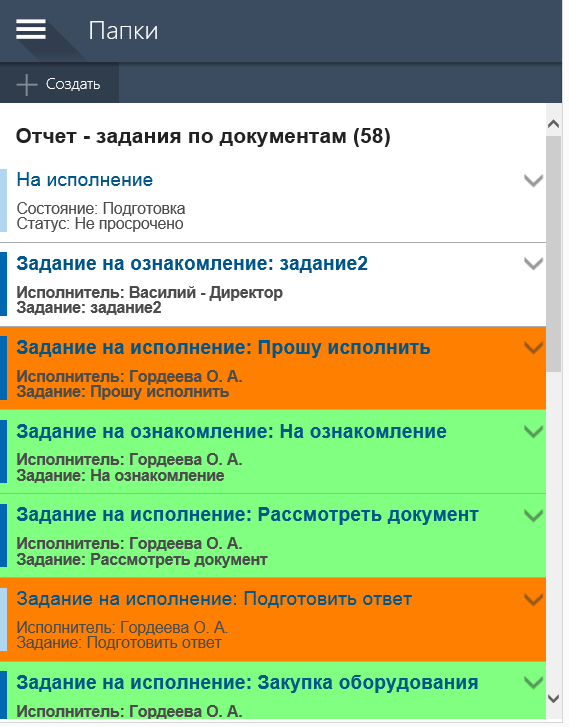
Fig.7. Displaying the view in the Docsvision mobile client
With the whole view, as with each document in it, you can perform various operations from the Ribbon panel and from the context menu. Not only sort and filter, but also upload the view to Excel for sending the report by mail or for further data manipulation. Similar to letters in Outlook, documents can be marked as read or unread; you can implement specific handlers - for this there is a special ability to customize group operations. For the presentation, you can define the types of documents to which group operations will be applied, the visible name of the operation, the icon, for the operation you also need to create a script in C # language that will implement the logic of the operation on the documents displayed in the view.
Summing up this article, I note that the Docsvision presentation mechanism allows you to perfectly solve the problem of building synthetic reports for applications implemented on the basis of the Docsvision system. Moreover, these reports allow you not only to view information, but also to perform operations (sorting, grouping, filtering), to initiate interaction with objects and to perform group operations with them.
As noted in the very first publication, the application in the electronic document management system (in our case, Docsvision) is assembled from relatively independently configurable components: documents (document cards), processes and tasks, views and folders. Representation in the EDS, in contrast to the usual table in the accounting system - a much more flexible tool. This is due to the need to display in one tabular view the most different types of objects that can be used in the application, and to form a specific context of this display. In addition, views should allow application users to perform a variety of actions on objects that are displayed in the view in accordance with the business logic of the applications. A feature of EDS, and Docsvision in particular, is the need to customize the presentation without programming.
The concept of presentation, implemented in Docsvision, creatively develops the ideas embodied in the legendary and at one time exclusively revolutionary Lotus Notes product, in which such objects first appeared. The views were probably the main feature of the Lotus Notes system, and I, who are quite familiar with traditional database development, found it very difficult to understand the purpose of this component when more than 20 years ago I was at one of the first trainings on this system in Russia.
What is unusual?
On the one hand, this is a regular table displaying a group representation of some objects. Each line corresponds to an element (in our case, a document), and fields are displayed in a line. The table can be sorted, filtered, initialized to work with the document from it, perform various operations, in particular, group (for example, export documents, change their status).
')
Fig.1 Example of Docsvision presentation
The specificity of the presentation is that in one table documents of different types can be displayed (some analogue to Join tables in a database), while you can display absolutely any object in the view, display any field of it, as well as various derived data. Let me explain a little more.
What can I use the presentation?
There are 2 possibilities. The first is to apply the view to the folder with documents, that is, to display in the view the documents stored in the physical folder. Different types of documents containing a different set of metadata (attributes) can be stored in the Docsvision folder.
The second is to apply the view to the so-called virtual folder - this is the folder that displays the result of some search query, which may include full-text and attribute components. Documents of various types can also appear in a virtual folder, and it is not even possible to predict in advance what, because it can contain documents corresponding to a full-text query, which is applicable to documents of any type. Each document will be displayed as a separate line or group of lines (more on this below).
View structure
A view is a table, in each column of which there is data of a certain type and semantics. In the given example it is the type of the document, its number, the author of the document, the controller and the deadline.
Fig. 2. The semantics of the header of the table view.
At the same time, in various types of documents, attributes for displaying in one or another column of the presentation may be contained in different metadata fields. In our example, the attribute that should be displayed in the “Deadline” column in the “Order” type document is contained in the “Execute before” field, in the “Incoming” type document - in the “Due Date” field, in the Task - in the “Date complete, ”and in the Outgoing there is no attribute with such semantics at all. However, the presentation allows you to collect all this into a single table and get a general view on the deadlines for the execution of documents of various types.
Fig. 3. The order of displaying attributes of documents of various types in the view column.
Of course, a developer who is accustomed to creating “traditional” applications may be puzzled - how could one design such a strange application, in which a single data model of all system objects was not thought out in advance and such a strange mechanism was needed? However, here we must remember that the SED is not a monolithic application. An ERMS is a platform in which individual applications (including various types of documents and presentations) can be created at different times by different developers, can be purchased in a ready-made form and tuned in during operation. All this leads to the fact that it is impossible to ensure information integrity (for example, to preserve a single attribute naming policy). But these independently created applications form as a result a system of “accumulating the knowledge of an organization” and this mechanism is implemented to ensure the information “integrity” of this system from the user's point of view.
In addition to the name of the presentation column, it is possible to determine the type of data displayed in the column and the format: for example, the format of the date or fractional number, which will affect the sorting method.
As we said earlier, the document attributes can be arranged in tables. If necessary, attributes can be displayed in the view, for example, if the document contains a set of files, each of which has its own set of attributes, for example, the creation date and name. It is possible to create a view in which, when displaying a document in a table, it will be assigned to as many lines as the file contains a document, and in each line the name and date of the corresponding file will be displayed.
Representations with a complex display structure
In the view, you can display not only the value of specific attributes of documents, but also attributes of card files and reference books associated with the original. For example, display in the view the individual attributes of the document and tasks that are associated with this document. Another example of such a complex representation is the display of contracts and their attributes and a list of acts (and their attributes) associated with a given contract. You may need to display attributes of objects that are in a more complex relationship with the document. For example, you may need to display the data (say, the phone number) of the employee who is performing the task on the document. The case is very practical - using such a view, we can quickly call an employee who delays the execution of the document, without having to open the staff directory. If we look at the information structure, we will see that the phone number is not stored in the document or in the associated card, but in the staff directory, which is indicated by the field of the task card associated with the document. The system allows you to display data from various objects in the view that are directly connected to the displayed document, or connected via intermediate objects (as in the example of the employee’s phone).
An even more complicated case is the consideration of certain conditions when displaying the data of related objects. For example, when displaying related tasks and, correspondingly, phone numbers of employees is necessary only for tasks for which there are problems, in order not to overload the submissions with unnecessary data. Such conditions can also be taken into account when describing the structure of the presentation.
In some cases, there is a need in the view to display synthetic data that is calculated based on the data of the displayed document itself or objects associated with it. For example, you can display the number of tasks related to the document, or the total amount of acts closed under the contract. Certain conditions can be imposed on the calculated fields: for example, display only the number of outstanding tasks or separately calculate the amount of closed acts, and at the same time take into account that they are closed in rubles and dollars.
If necessary, the data in the view can be grouped by the values of one or another column of the table. And, if we recall that the column can display the values of different attributes of different types of objects, it turns out that we can group objects by fields that are represented by different attributes in different types of cards. At each level of grouping, various numerical aggregates can be calculated - the total number of elements, the sum and average for numerical fields, etc.
Fig. 4. Sample view with groupings and calculation of aggregation values.
Visual presentation design
The system allows you to customize the visual design of the presentation: fonts, background color, separator format, etc., and if necessary, you can define different color selections for different elements (rows) of the table, depending on the conditions (values of individual table fields). For example, there may be highlighted documents for which the deadlines for execution have been violated, or those whose deadline will occur in the near future. The system of setting the visual selection is quite flexible and allows you to solve all practical problems arising in the development of applications. In Figure 4, the lines in which the units are displayed are highlighted in color, and in Figure 1 the completed tasks are highlighted in green and the stitched ones in orange.
Another useful feature provides better readability of reports - the ability to display individual attributes of a document as a string that ignores the division of a table into columns, just as in Outlook you can make the contents of a letter directly in a table view.
Fig. 5. A summary of the documents is displayed in a separate line in the view for each document.
The customized view will be equally displayed in all clients: “heavy”, light (HTML) and mobile, automatically adapting to the type of form factor.
Fig.6. Displaying the presentation in the Docsvision light client
Fig.7. Displaying the view in the Docsvision mobile client
Submission operations
With the whole view, as with each document in it, you can perform various operations from the Ribbon panel and from the context menu. Not only sort and filter, but also upload the view to Excel for sending the report by mail or for further data manipulation. Similar to letters in Outlook, documents can be marked as read or unread; you can implement specific handlers - for this there is a special ability to customize group operations. For the presentation, you can define the types of documents to which group operations will be applied, the visible name of the operation, the icon, for the operation you also need to create a script in C # language that will implement the logic of the operation on the documents displayed in the view.
Summing up this article, I note that the Docsvision presentation mechanism allows you to perfectly solve the problem of building synthetic reports for applications implemented on the basis of the Docsvision system. Moreover, these reports allow you not only to view information, but also to perform operations (sorting, grouping, filtering), to initiate interaction with objects and to perform group operations with them.
Source: https://habr.com/ru/post/333352/
All Articles