SYSMON Dashboards for InterSystems Caché, Ensemble and HealthShare performance monitoring
System Monitor is a flexible, customizable utility that comes with Caché (Ensemble, HealthShare), which collects indicators of the operating system and Caché. System Monitor also notifies administrators of problems with Caché and the operating system when one or more of the indicators reach the values set by the administrator.
Notifications are sent by e-mail or in any other way (through the custom class of notifications). You can configure notifications using the ^% SYSMONMGR utility . For e-mail distribution, you must specify the distribution server settings, the distribution e-mail address and authentication settings. You can then add the required addresses to the distribution list and check the settings by sending a test message. After that, e-mail will be sent notifications about the availability of free space on the hard disk, the expiration date of the license and others. What kind of notification you can receive, you can read here .
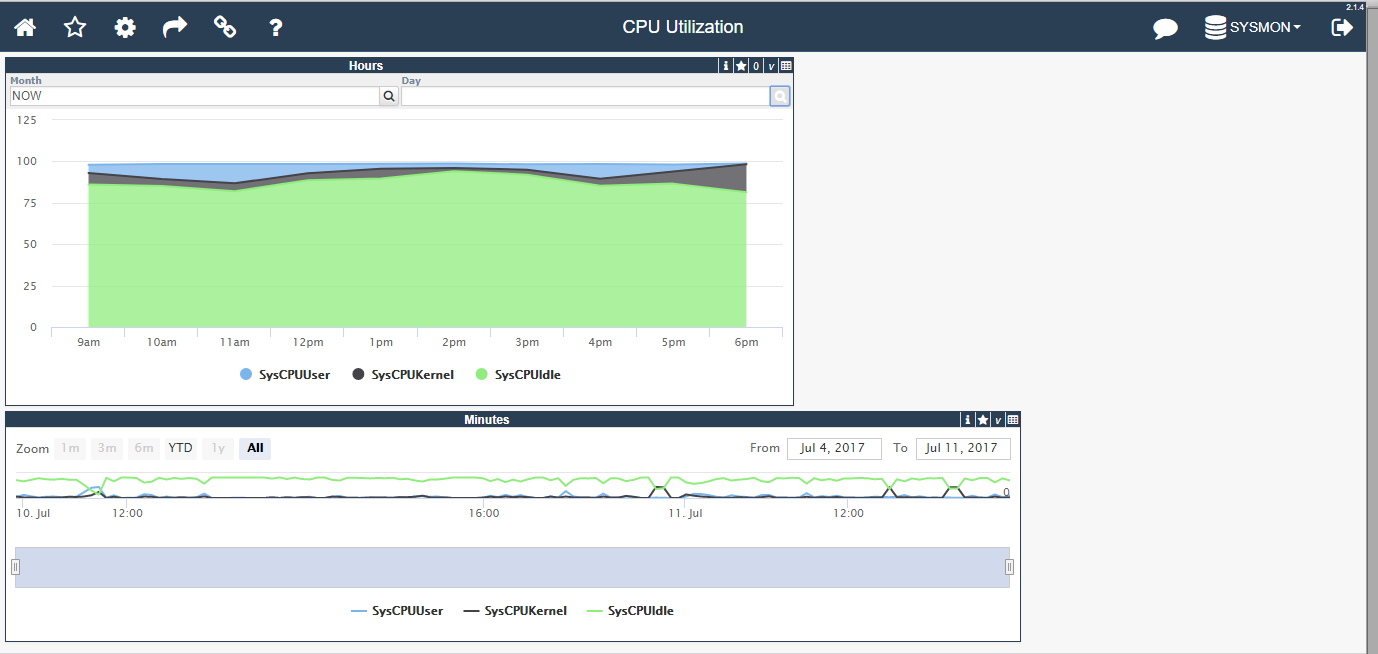
Immediately after launching (and by default, the utility starts when the Caché instance starts), System Monitor begins to collect metrics and write them to the system tables. Data is available via SQL. In addition, to view and analyze these metrics, starting with version 2015.1, you can use SYSMON Dashboards.
SYSMON Dashboards is an open-source project for viewing and analyzing metrics. As part of the project, a set of dashboards is supplied with graphs of the operating system and Caché. SYSMON Dashboards uses DeepSee technology to analyze and build dashboards. The installation process is quite simple. Enough:
- Download latest release
- Import a class into any area (for example, USER),
- Start the installation with the command:
do ##class(kutac.monitor.utils.Installer).setup().
All other settings will be made automatically. After installation, a set of DeepSee toolbars for viewing and analyzing metrics will appear in the DeepSee portal.
To view the DeepSee dashboards, I use the open-source DeepSeeWeb project, which uses an extended set of components to render the DeepSee dashboards.
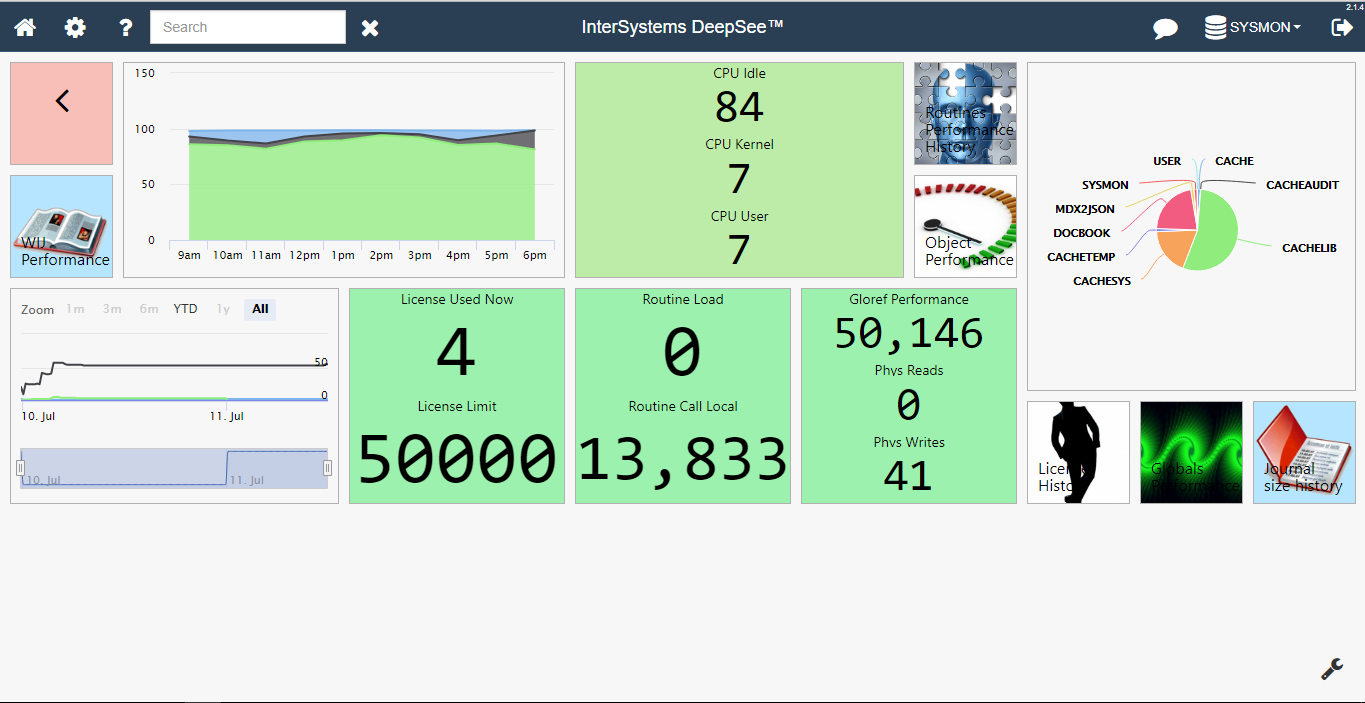
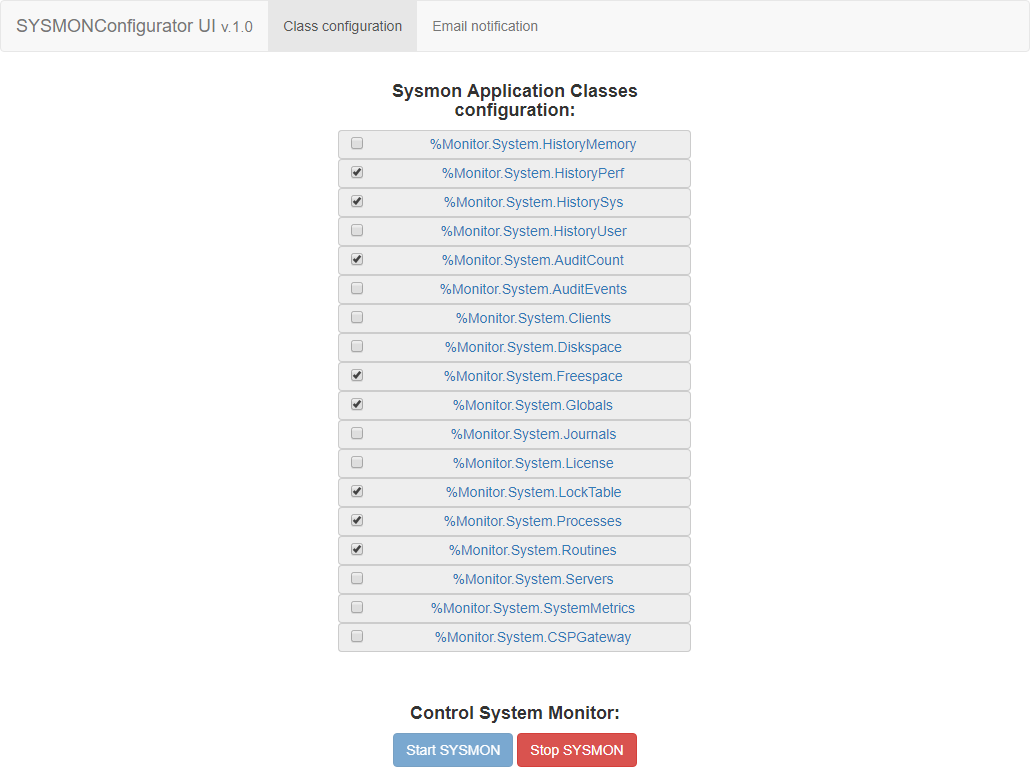
SYSMON Dashboards also includes a Web-based interface for configuring basic monitor settings and notifications. For a more thorough setting, I recommend using the ^% SYSMONMGR utility . The SYSMON Dashboards setup page allows you to select a set of monitored metrics, start / stop the monitor.
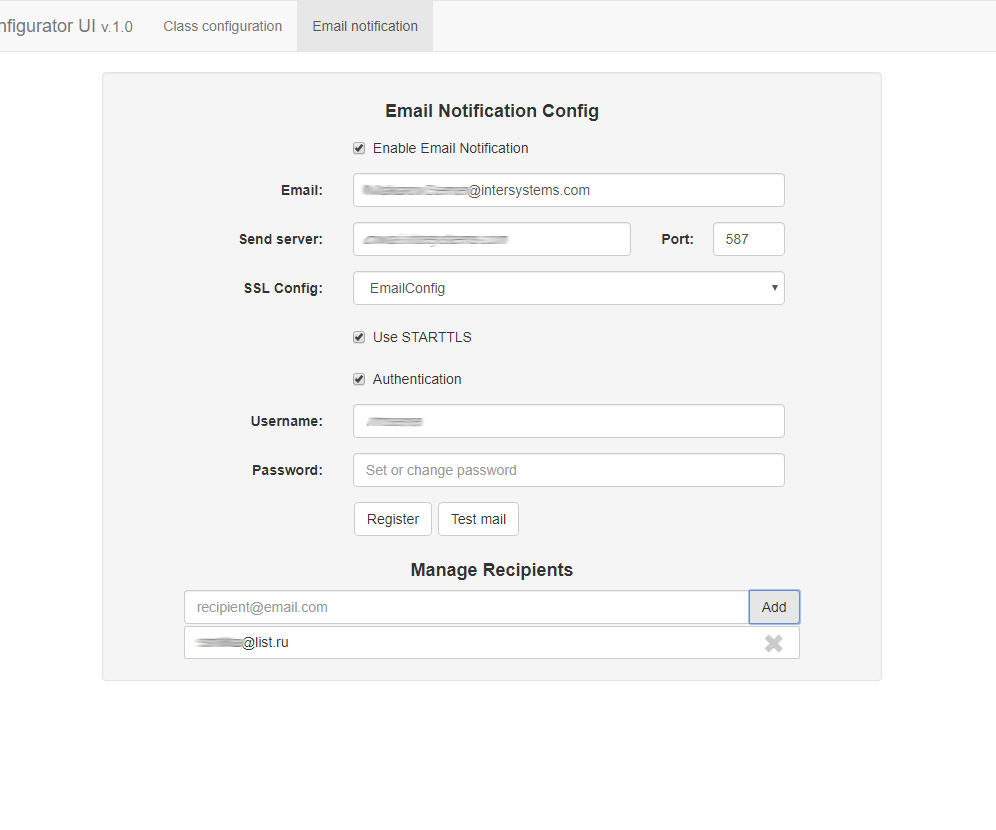
The settings for email notifications via the Web interface are the same as the default settings: you must specify the server settings, the address and authentication data.
An example of setting up email notifications:
Thus, using the standard Caché utility and open-source projects SYSMON Dashboards and DeepSeeWeb, you can significantly simplify the tasks of monitoring the InterSystems platforms.
')
Source: https://habr.com/ru/post/332980/
All Articles