Aggregation of Internet channels through mobile operators

It's nice to have a reliable and fast internet connection, especially when you have to go for hours! If the path runs in a densely populated area - on any modern phone with support for 4G networks, usually everything just works, we continue to use the Internet, as we are used to. Naturally, everything changes when you travel outside the settlements.
In the moving transport the Internet can be submitted only in two ways:
- "From the sky". Satellite, stratostatos and other technologies that relay the data channel "top".
- With the help of ground infrastructure. Any means of transmitting a radio signal through base stations installed on the ground. This may be the infrastructure of cellular operators, Wi-Fi infrastructure, the grandfather of Ethernet radio, etc.
Nobody in their right mind would, of course, allocate a budget for creating their own infrastructure for data transmission, therefore there is only a satellite channel and the “cellov” infrastructure at their disposal. The choice was once again simplified when the customer's financial model could not withstand the implementation through the satellite channel. Therefore, later we will discuss how to submit to the moving vehicle the most stable channel through mobile operators.
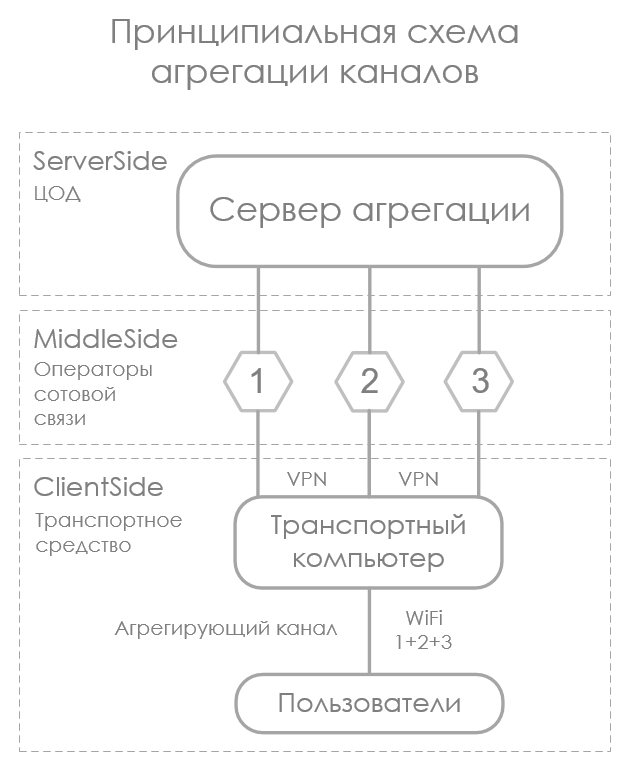
The essence of aggregation of data transmission channels can be expressed briefly: to summarize the capacity provided by different physical lines. Conventionally, if we have four channels with a capacity of 1 Mbit / s each, we should receive one channel with a capacity of 4 Mbit / s. In our case, there are four mobile operators, through each of them in the limit you can squeeze out up to 70 Mbit / s, and in total, if the stars converge correctly, 280 Mbit / s.
Someone will say that 280 Mbit / s is not enough for all passengers of the train, of which an average of 700 people, and that it is impossible to get such speed outside the settlements. Moreover, where there is no connection at all, no magic will occur: there will be no connection in transport either. Of course, this someone is absolutely right. Therefore, we solve the problem of not a comfortable channel for everyone, but at least some of it, where ordinary smartphones are not physically able to establish a connection.
This post is about how we had to invent a bicycle from scratch to get the Internet in road and rail transport for one Indian railway operator, how we fixed the movements of this transport and the quality of the data transmission channel at each point on the way and then stored in the Tarantool cluster.
The essence of the project
Aggregation solves the problem of fault tolerance and / or summation of the capacity of the data transmission channels involved in the aggregation. Depending on the type of aggregation, network topology and equipment, the implementation can be completely different.
Each type of aggregation is worthy of a separate article, but we have a specific task: as far as possible, to provide vehicles with reliable and “wider” channel.
The infrastructure of mobile operators provides the basis for the task:
- Convergent environment. Data transfer occurs through the open Internet and different telecom operators. This means that EtherChannel and other hardware-supported protocols will not work, of course.
- High entropy channels PD traffic. The capacity and delay in each channel is unpredictable and changes rapidly, since it strongly depends on the distance to the operator's BS, its load, interference, etc.
Technically, aggregation is very simple and repeatedly described; you can easily find information of any depth of presentation. In short, the essence of this.
From the client equipment:
- Network configuration. Through independent data transfer channels, L3 tunnels are installed to a single aggregation point (any external server with configured NAT). One channel - one tunnel. The interface is raised, which will be the default gateway for the entire network.
- Special software. It does only two things: it monitors target metrics of the quality of channels and tunnels, then, based on metrics, it distributes NAT traffic across the tunnels.
The need to independently analyze channels through different cellular operators with monitoring the signal level of the operator, type of communication, information about the base station load, errors in the operator’s data transmission network (not to be confused with the L3 tunnel) and allowing Google to inform us on the basis of these metrics that you have to write the solution yourself.
By the way, there are solutions of different levels of acceptability in which the aggregation works. For example, standard bonding interfaces in Linux. We raise the L3-tunnel through any available toolkit, even though through a VPN server or SSH-tunnel, manually configure the routing and add virtual tunnel interfaces to the bonding. Everything will be fine as long as the capacity of the tunnels at each moment in time is the same. The fact is that with such a network topology only the balance-rr aggregation mode works, i.e. an equal number of bytes in turn get into each tunnel. This means that if we have three channels with a capacity of (Mbps) 100, 100, and 1, then the resulting capacity will be 3 Mbps. That is, the minimum channel width is multiplied by the number of channels. If the capacity is 100, 100, 100, then the resultant will be 300.
There is another solution: a wonderful opensource-project Vtrunkd, which after a long oblivion was reanimated in 2016. There is already almost everything you need. We honestly wrote to the creators that we are ready to pay for the finalization of the solution in terms of monitoring the communication service quality metrics and include these metrics in the traffic distribution mechanism, but unfortunately did not receive a response, so we decided to write our own version from scratch.
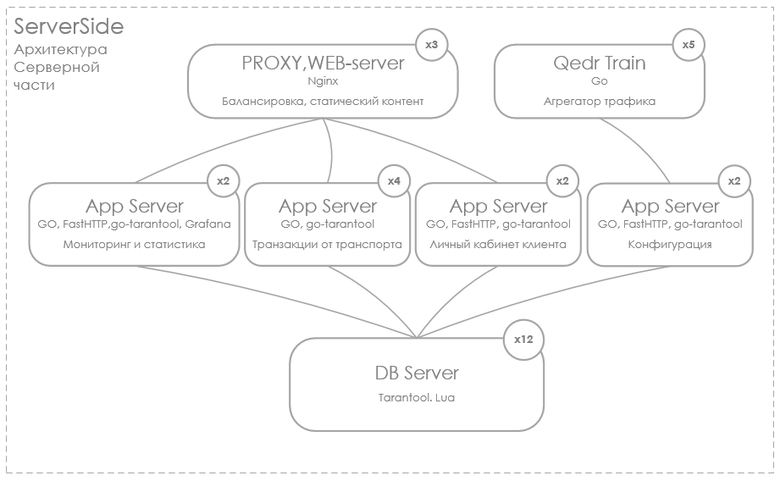
Qedr train
We began by monitoring the cellular service provider metrics (signal strength, network type, network errors, etc.). It should be noted that the modems were chosen precisely on the basis of how well they can deliver operator metrics. We chose the SIM7100 modem manufactured by Simcom. All the metrics of interest to us are given through a call to the serial port. The same modem also gives GPS / GLONASS coordinates with good accuracy. It is also necessary to track the status of computer metrics (temperature CPU, SSD, free amount of RAM and disk space, SMART SSD indicators). Separately, the module monitors the statistics of network interfaces (the presence of errors on receiving and sending, the length of the send queue, the number of bytes transmitted). Since the device's performance is extremely limited and the packet of transmitted data should be minimal, and also considering the ease of monitoring these metrics under Linux via / proc / sys, the entire monitoring subsystem has also been designed from scratch.
After the metrics monitoring module was ready, we started the network part: software channel aggregation. Unfortunately, the detailed algorithm is a commercial secret, I cannot publish it. Still I will describe in general terms how the aggregation module installed in the transport works:
- At startup, reads the config in JSON format, which describes the settings of virtual interfaces. Aggregation server addresses are dynamically pulled from the central system. This ensures load balancing on the server part and conditionally seamless handover in case of failure of any aggregation server.
- Based on the read data, it creates L3 tunnels to the aggregation servers. Configures routing. The tunnel can optionally have data compression and encryption.
- Based on the data from the monitoring module, it assigns its own “weight” to each tunnel. The more weight, the more traffic will go through this tunnel. The weight of each tunnel is updated every second.
- Device operation statistics, geolocation and business logic metrics accumulate over 10 minutes, a transaction is formed. Transactions are stored in the local Tarantool database and sent to the "head" by the native data replication mechanism of the Tarantool DBMS, for which special thanks to the developers and the active community of this DBMS.
The server part of the aggregation works radically easier. At the start, the aggregation module accesses the settings server, receives the configuration in JSON format, and on its basis launches L3 interfaces. In general, everything is trivial.
We should also separately describe the system for collecting and visualizing all the metrics of the project. It is divided into two large parts. The first part is monitoring the life support systems of the client and server equipment. The second is monitoring the business metrics of the project.
Stack of technology project standard. Visualization: Grafana, OpenStreetMap, application server on the client and server side: Go, DBMS Tarantool.
Tarantool
The evolution history of DBMS in our projects begins with PostgreSQL in 2009. We successfully stored geodata in it from onboard devices installed on special vehicles. PostGIS module coped with tasks. Over time, there was a great lack of performance in data processing without a storage scheme. Experimented with MongoDB from version 2.4 to version 3.2. A couple of times we were unable to restore the data after the emergency shutdown (the budget did not allow completely duplicating the data). Next drew attention to ArangoDB. If we consider that the backend at the time we wrote in JavaScript, the technology stack looked very nice. However, this little bazaar, having spent a good two years with us, is a thing of the past: we could not control the memory consumption on large amounts of data. In this project, paid attention to Tarantool. The key for us was the following:
- Built-in transaction mechanism.
- Storage of non-relational data.
- InMemory and Vinyl data storage (on disk).
- The mechanism of master slave replication.
- Effective work on powerful hardware in the data center and on very limited equipment in the vehicle.
At first glance, everything in it is good, except for the fact that it works only on one processor core. For the sake of science, we conducted a series of experiments to see if this would be an obstacle. After tests on the target hardware, we were convinced that for this project the DBMS handles the duties perfectly.
We have only three main data profiles: financial transactions, time series (i.e., system operation logs) and geodata.
Financial transactions are information about the movement of money on the personal account of each device. Any device has at least three SIM cards from different telecom operators, so you need to control the balance of the personal account of each telecom operator and, in order to prevent disconnection, know in advance when to top up the balance for each operator of each device.
Time series are simply monitoring logs from all subsystems, including an aggregate bandwidth log for each device in the transport. This gives us the opportunity to know at what point of the path which channel was for each operator. This data is used for analytics of network coverage, which, in turn, is needed for proactive switching and weighing of channels by telecom operators. If we know in advance that at a particular point such an operator has the worst quality, we disable this channel from aggregation in advance.
Geodata - a simple vehicle track along the way. Every second we poll the GPS sensor built into the modem and get the coordinates and altitude above sea level. A track lasting 10 minutes is collected in a packet and sent to the data center. At the request of the customer, these data must be stored forever, which, with an increasing number of vehicles, makes it necessary to plan infrastructure very seriously in advance. However, sharding is made very simple in Tarantool, and there is no need to puzzle over the scaling of the storage for the fastest growing data. Data backup is not written, as there is no historical value in this data now.
For all types of data we used the Vinyl engine (data storage on disk). There are not so many financial operations, and there is no sense in always keeping them in memory, as well as logs, of course, and geodata, until an analyst is made on them. When analytics is required, depending on the speed requirements, it may be worthwhile to prepare the already aggregated data and store it on the InMemory engine, and then analyze this data. But all this will begin when the customer forms his requirements.
It is important to note that Tarantool perfectly coped with our task. He feels equally comfortable on a resource-limited device and in a data center for ten shards. Specification of devices that are in transport:
CPU: ARMv8, 4Core, 1.1 Ghz
RAM: 2 Gb
Storage: 32 GB SSD
Data Center Server Specification:
PU x64 Intel Corei7, 8Core, 3.2 Ghz
RAM: 32 Gb
Storage: 2 × 512 Gb (Soft Raid 0)
As I said, the replication of data from the transport to the data center is established by the means of the DBMS itself. Sharding of data between ten shards is also out of the box functionality. All information is present on the Tarantool website, and I think it is not necessary to describe it here. Currently, the system serves only 866 vehicles. The customer plans to expand to 8 thousand.
Alexander Rodin, CIO and the main developer (yes, this happens not only in startups) of the Qedr Train project of the company Regional Telematics Systems. If you have any questions, write to the comments or to a.rodin@rts.ru . I will try whenever possible to answer all.
')
Source: https://habr.com/ru/post/332950/
All Articles