24-core CPU, and I can not move the cursor
It all started, as often happens when my car began to slow down. On a working Windows 10 computer with a 24-core processor (48 threads), which was 50% idle. Of the 64 GB of memory used less than half. Fast SSD is also not particularly used. And yet, when I moved the mouse, the cursor did not immediately react - sometimes with a delay of several seconds.
So I did what I always did - I recorded and analyzed the event tracing using ETW. As a result, I discovered a Windows 10 bug that seriously affects the performance of process completion.
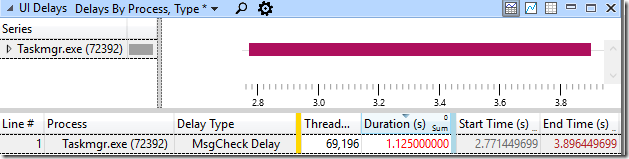
ETW tracing has shown that the UI hangs in many programs. I decided to explore the 1.125-second hang in the Task Manager:
')
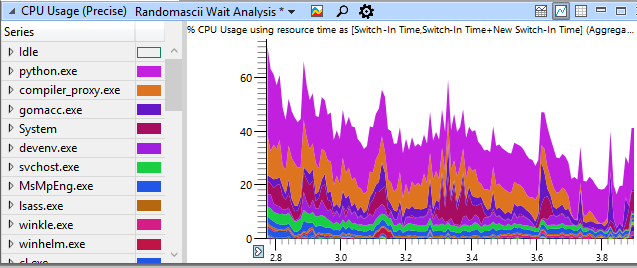
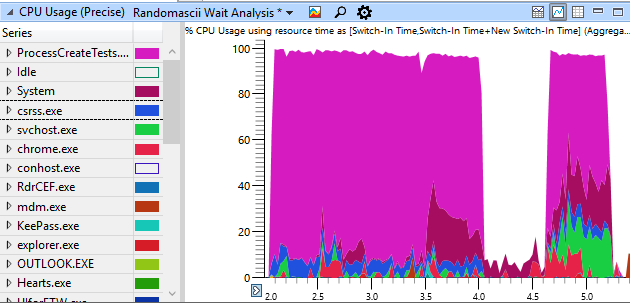
In the screenshot below, you can see the CPU usage of the system during a hang, grouped by process names - note that CPU utilization rarely rises above 50%.
The CPU Usage (Precise) table shows that the Task Manager's UI thread was constantly blocked by calls to functions like SendMessageW , apparently waiting in a critical region of the kernel (this is the version of critical sections in kernel mode), deep in the call stack in win32kbase.sys! EnterCrit ( here):

I manually went through the wait chain through half a dozen processes to find who grabbed the resources of my UI. As a result of the analysis, my notes look like this:
I had to continue because most of the processes released the lock in just a few microseconds. But in the end I found several processes (processes gomacc.exe) that seemed to hold the lock for several hundred microseconds. Or at least they were prepared by someone who held the lock, and then after a few microseconds they prepared someone else to remove it. All these processes removed the lock within NtGdiCloseProcess .
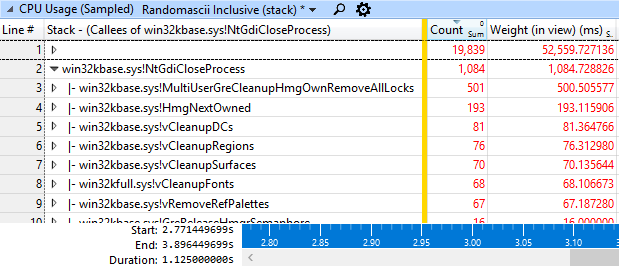
I was tired of manually walking through these wait chains, so I decided to see how often the same call stack is encountered. I did this by dragging the Ready Thread Stack column to the left and searching for NtGdiCloseProcess there. Then I used the View Callers -> By Function option in WPA to display all of the Ready Thread Stacks that met this function — in this window, the parent stacks below.

There were 5768 context switches when the NtGdiCloseProcess process was on the Ready Thread Stack stack , and each of them signifies the moment when the critical section is released. The flows on these call stacks spent waiting for a total of 63.3 seconds — not bad for a delay of 1.125 s! And if each of these events happened after the thread held the lock for only 200 microseconds, then 5768 events would be enough to add up to a hang time of 1.125 s.
I am not familiar with this part of Windows, but the combination of PspExitThread and NtGdiCloseProcess clearly shows that this behavior is observed at the end of the process.
This happened during the assembly of Chrome, and the assembly of Chrome spawns many processes. I used our distributed build system, that is, the processes were created — and completed — very quickly.
The next step was to find out how much time was spent inside NtGdiCloseProcess . So I transferred the CPU Usage (Sampled) table to WPA and received a butterfly graph, this time the NtGdiCloseProcess call. The screenshot below shows that out of the total time, 1.125 seconds and about 1085 ms were spent inside the NtGdiCloseProcess process, that is, 96% of the total time:
Too bad if one function holds the lock for 95% of the time, especially if you need to get the same lock for GetMessage calls or for updating the cursor position. For the sake of experiment, I wrote a test program that creates 1000 processes with maximum speed, waits 0.5 seconds, and then commands all processes to finish at the same time. The screenshot shows the use of this CPU program on my quad-core (eight threads) home laptop:
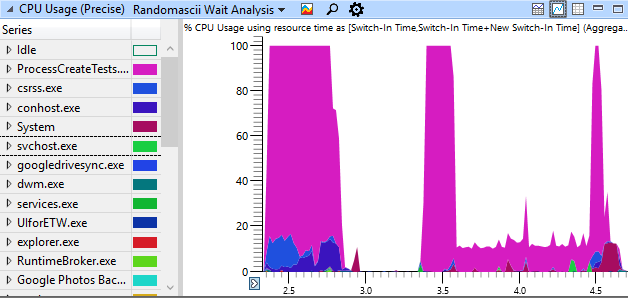
So what we see. Creating processes is CPU limited, as it should be. But the closure of processes is limited by the CPU only at the beginning and at the end, and in the middle there is a long period (about a second) where it goes sequentially - using only one of the eight available threads in the system, since 1000 processes fight for a single lock inside NtGdiCloseProcess . This is a serious problem. This gap represents the time when the programs freeze, and the cursor moves will be delayed - and sometimes this gap will stretch for a few seconds.
I noticed that the problem seemed to get worse when the computer was running for a while, so I restarted the laptop and ran the test again after loading. The sequence of the completion of the processes was not so difficult, but the problem was clearly present even on the newly loaded machine:

If you run the same test on an old Windows 7 computer (Intel Core 2 Q8200, sample 2008), here are the results:
Creating processes is slower here, as might be expected on a much weaker CPU, but the completion of processes is as fast as on my new laptop, and fully parallelized.
This indicates that the serialization of process termination is a new problem that appeared somewhere between Windows 7 and Windows 10.
Amdal's law says that if you distribute your task among a sufficient number of cores, then the total time for its execution will be equal to the execution time of the longest fragment that cannot be parallelized. If I intensively used my work computer for several days, then this serialization problem manifested itself quite clearly when the completion of the processes was a significant part of the distributed build time - and more cores did not help here. In order to speed up the assembly as much as possible (and so that the cursor began to move while it was in progress), it was necessary to restart the computer every few days. And even then the build speed was not as high as it should be, so Windows 7 looked all the more attractive.
In fact, adding cores to my system slowed the reaction rate of the UI. This is because Chrome’s build system is pretty clever and spawns more processes if you have more cores, so even more terminating processes fight for global locking. Therefore, here is not just a “24-core CPU, but I cannot move the cursor,” and here “a 24-core CPU, and therefore I cannot move the cursor.”
The problem was reported to Microsoft, they are investigating.
Here is what my test program for creating and terminating processes on a 24-nuclear machine looks like:

See this little horizontal red line in the lower right? This is a graphic illustration of Amdal's law, when 98% of my car’s resources are idle for almost two seconds, while the process completion procedure has grabbed the lock I need to move the cursor.
The ProcessCreateTests code is available here .
If you liked this article, you may like other investigations:
“ Your browser got into my compiler! "
Windows Shutdown: Investigation and Identification (and continued )
" The problem of poor performance PowerPoint "
" Visual Studio DoS Attack on itself through the search function "
So I did what I always did - I recorded and analyzed the event tracing using ETW. As a result, I discovered a Windows 10 bug that seriously affects the performance of process completion.
ETW tracing has shown that the UI hangs in many programs. I decided to explore the 1.125-second hang in the Task Manager:
')
In the screenshot below, you can see the CPU usage of the system during a hang, grouped by process names - note that CPU utilization rarely rises above 50%.
The CPU Usage (Precise) table shows that the Task Manager's UI thread was constantly blocked by calls to functions like SendMessageW , apparently waiting in a critical region of the kernel (this is the version of critical sections in kernel mode), deep in the call stack in win32kbase.sys! EnterCrit ( here):
I manually went through the wait chain through half a dozen processes to find who grabbed the resources of my UI. As a result of the analysis, my notes look like this:
Taskmgr.exe (72392) hung at 1,125 with (MsgCheckDelay) on thread 69,196. The greatest delay was 115.6 ms on win32kbase.sys! EnterCrit, which was prepared for execution by the process conhost.exe (16264), thread 2560 on 3.273101862. conhost.exe (16264), 2560 was prepared on 3.273077782 after waiting 115,640.966 ms, using the mstsc.exe process (79392), 71272. mstsc.exe was prepared (at the same time, the same delay) by the TabTip.exe (8284), 8348 process which was prepared for execution by the process UIforETW.exe (78120), 79584, which was prepared by the process conhost.exe (16264), 58696, which was prepared by the process gomacc.exe (93668), 59948, which was prepared by the process gomacc.exe ( 95164), 76844.
I had to continue because most of the processes released the lock in just a few microseconds. But in the end I found several processes (processes gomacc.exe) that seemed to hold the lock for several hundred microseconds. Or at least they were prepared by someone who held the lock, and then after a few microseconds they prepared someone else to remove it. All these processes removed the lock within NtGdiCloseProcess .
I was tired of manually walking through these wait chains, so I decided to see how often the same call stack is encountered. I did this by dragging the Ready Thread Stack column to the left and searching for NtGdiCloseProcess there. Then I used the View Callers -> By Function option in WPA to display all of the Ready Thread Stacks that met this function — in this window, the parent stacks below.
There were 5768 context switches when the NtGdiCloseProcess process was on the Ready Thread Stack stack , and each of them signifies the moment when the critical section is released. The flows on these call stacks spent waiting for a total of 63.3 seconds — not bad for a delay of 1.125 s! And if each of these events happened after the thread held the lock for only 200 microseconds, then 5768 events would be enough to add up to a hang time of 1.125 s.
I am not familiar with this part of Windows, but the combination of PspExitThread and NtGdiCloseProcess clearly shows that this behavior is observed at the end of the process.
This happened during the assembly of Chrome, and the assembly of Chrome spawns many processes. I used our distributed build system, that is, the processes were created — and completed — very quickly.
The next step was to find out how much time was spent inside NtGdiCloseProcess . So I transferred the CPU Usage (Sampled) table to WPA and received a butterfly graph, this time the NtGdiCloseProcess call. The screenshot below shows that out of the total time, 1.125 seconds and about 1085 ms were spent inside the NtGdiCloseProcess process, that is, 96% of the total time:
Too bad if one function holds the lock for 95% of the time, especially if you need to get the same lock for GetMessage calls or for updating the cursor position. For the sake of experiment, I wrote a test program that creates 1000 processes with maximum speed, waits 0.5 seconds, and then commands all processes to finish at the same time. The screenshot shows the use of this CPU program on my quad-core (eight threads) home laptop:
So what we see. Creating processes is CPU limited, as it should be. But the closure of processes is limited by the CPU only at the beginning and at the end, and in the middle there is a long period (about a second) where it goes sequentially - using only one of the eight available threads in the system, since 1000 processes fight for a single lock inside NtGdiCloseProcess . This is a serious problem. This gap represents the time when the programs freeze, and the cursor moves will be delayed - and sometimes this gap will stretch for a few seconds.
I noticed that the problem seemed to get worse when the computer was running for a while, so I restarted the laptop and ran the test again after loading. The sequence of the completion of the processes was not so difficult, but the problem was clearly present even on the newly loaded machine:
If you run the same test on an old Windows 7 computer (Intel Core 2 Q8200, sample 2008), here are the results:
Creating processes is slower here, as might be expected on a much weaker CPU, but the completion of processes is as fast as on my new laptop, and fully parallelized.
This indicates that the serialization of process termination is a new problem that appeared somewhere between Windows 7 and Windows 10.
48 streams, 47 of them stand idle
Amdal's law says that if you distribute your task among a sufficient number of cores, then the total time for its execution will be equal to the execution time of the longest fragment that cannot be parallelized. If I intensively used my work computer for several days, then this serialization problem manifested itself quite clearly when the completion of the processes was a significant part of the distributed build time - and more cores did not help here. In order to speed up the assembly as much as possible (and so that the cursor began to move while it was in progress), it was necessary to restart the computer every few days. And even then the build speed was not as high as it should be, so Windows 7 looked all the more attractive.
In fact, adding cores to my system slowed the reaction rate of the UI. This is because Chrome’s build system is pretty clever and spawns more processes if you have more cores, so even more terminating processes fight for global locking. Therefore, here is not just a “24-core CPU, but I cannot move the cursor,” and here “a 24-core CPU, and therefore I cannot move the cursor.”
The problem was reported to Microsoft, they are investigating.
And something else...
Here is what my test program for creating and terminating processes on a 24-nuclear machine looks like:
See this little horizontal red line in the lower right? This is a graphic illustration of Amdal's law, when 98% of my car’s resources are idle for almost two seconds, while the process completion procedure has grabbed the lock I need to move the cursor.
Materials
The ProcessCreateTests code is available here .
If you liked this article, you may like other investigations:
“ Your browser got into my compiler! "
Windows Shutdown: Investigation and Identification (and continued )
" The problem of poor performance PowerPoint "
" Visual Studio DoS Attack on itself through the search function "
Source: https://habr.com/ru/post/332816/
All Articles