University or technical school: where to enter in order to successfully find a job and earn good money?
Hi, Habr! Last summer we published an article about the results of monitoring the employment of graduates. The project received active support from universities and all interested parties, due to which a number of improvements were made over the past year.
First, data on university graduates in 2014 and 2015 were collected and processed. The data for 2015 was processed and published just a few days ago (perhaps, someone from the readers noticed recent publications in the media on this topic). So now you can analyze the results of monitoring over three years at once, tracing the dynamics of indicators. But we will tell about it in more detail in the next article.
Secondly, data on graduates of secondary vocational education in 2013 and 2014 graduates were collected, processed and published on the spo.graduate.edu.ru portal. For those who are not very versed in official terms, these are graduates of “colleges”, “technical schools”, etc. Here we will talk about the results of this monitoring, as well as their comparison with the results of monitoring universities, in this article.
')

We tried to tell as much as possible about the project, so the article turned out to be quite voluminous and therefore divided into several parts. In the first, we will briefly discuss what secondary vocational education is and what should be expected from it. The second discussion will deal with the results of monitoring. A separate important section is devoted to trying to compare the results of graduates of secondary vocational education with the results of university graduates. In other words, we will try to at least partially answer the eternal question “Is higher education important?”, But from an objective, new point of view, relying on dry numbers.
If you are too lazy to read the theory and other explanations, then you can go directly to the most interesting - the results, but we strongly recommend that you familiarize yourself at least with the research methodology.
Table of contents:
1. Theoretical part
- What is open source software?
- Stereotypes, features, expectations
- Geography of training
- Method
2. General results
3. Detailed comparison of VO and SPO
- Data preparation
- Comparison metric
- Comparison results
4. Comparison of graduates from one university
5. Conclusions
To begin with, let's deal with the terms in order to understand each other correctly. What is a secondary vocational education? As the name suggests, this is, first of all, professional education.
The main task of this level of education is to teach students in the shortest possible time key skills and knowledge, which will be enough to start working. Some specialties can be entered after the 9th grade. Such graduates are now often called “workers” or “blue collars”, i.e. people who work with their hands in factories, warehouses, in hairdressing salons, shops, etc.
Sometimes it is considered that the ACT is more aimed only at obtaining workers or specialties that do not require in-depth knowledge. However, this is not quite true. Many, though not all, specialties that can be taught in higher education programs are also available in vocational education. Of course, the training programs and the intensity of training will be different. It should be noted that many higher education institutions can also teach in secondary vocational education programs.
STR is divided into:
The latter, in turn, are divided into basic and in-depth levels (training lasts about a year longer). If it is interesting, then you can learn more about the system of secondary vocational education in Russia at one of the resources of the Ministry of Education and Science of Russia.
For simplicity, hereinafter, we will call all graduates who have received secondary vocational education “graduates of secondary vocational education” or “graduates of technical schools” and those who graduated from higher education - “graduates of higher education” or “graduates of higher educational institutions”. Although formally, this is not entirely true, but it is immediately clear to everyone.
Secondary vocational education is generally considered less prestigious than higher education. Accordingly, it is considered that both salaries and employment for secondary school graduates are worse than those who have received higher education. However, at some point, the view began to become popular about the increasing value of the labor market cadres in the labor market. It is, of course, about highly skilled professions, for example, an operator of a CNC machine. And, according to official statements , the popularity of open source software in recent years is indeed growing, including through projects such as Worldskills .
A cursory analysis of the state of affairs in the labor market shows that the first of stereotypes is more likely to be true. To do this, we use the well-known portal hh.ru and select vacancies that require “secondary special” or “secondary vocational” education. And then compare with those where you need a "higher education". The figure below confirms that, in general, specialists with higher education "are" more expensive:
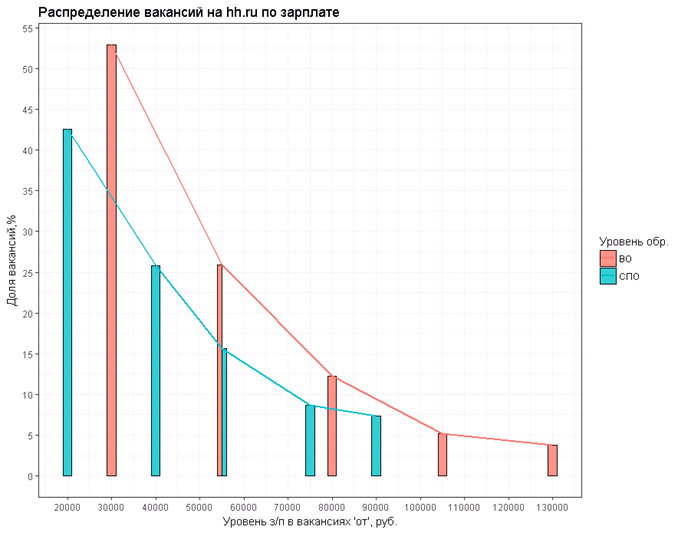 Figure 1. (Data for July 4, 2017 for the region of Russia)
If we calculate the average salaries offered, then for a specialist with VO, sums are offered approximately ~ 1.24 times more.
This is a very rough assessment of the labor market. If only because besides hh there are portals that specialize in vacancies specifically for people with open source software, and there the situation may differ.
At the same time, we must not forget that many specialties of open source software also have “freelancing”. For example, the familiar example of a plumber, who takes money for the work in his pocket, or teams of workers who make repairs without a contract. Unfortunately, it is impossible to estimate these revenues and their share using official data.
Obviously, both the average wage and the share of employment strongly depend on the region. First, look at the differences in the geographical distribution of graduates. Is the popularity of VO and ACT in the regions of Russia evenly distributed? How to evaluate what kind of education "prevails" in the region? We construct the dependence of the share of secondary school and high school graduates on the total population. Given that not all regions have equally well filled in the data for monitoring, we will use the official statistics of the ministry (data taken for 2014, for 2013 the situation is about the same), but not monitoring data.
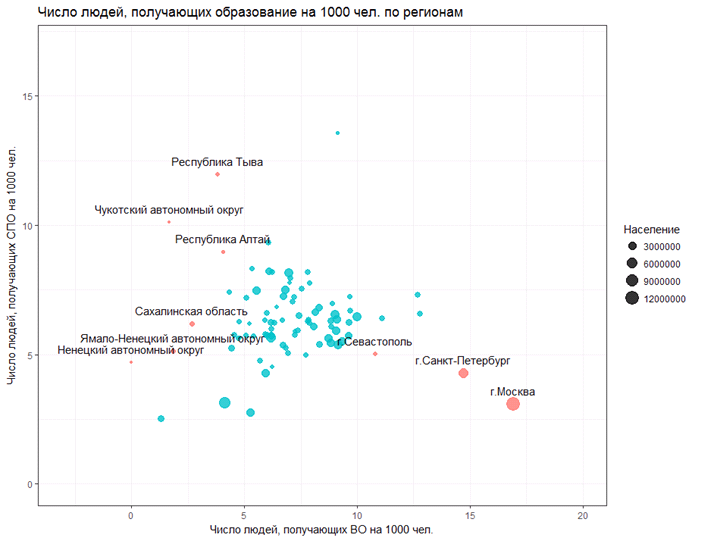
Figure 2
Signed regions are marked in red. These are regions where the “bias” in the direction of an education is 2 or more times. Of course, our two capitals are striking - these are two large cities that have a clear bias towards the “tower”.
Now let's look a little from a different angle: let's calculate the share of graduates who studied in a particular region, from the total graduation in the corresponding educational level:

Figure 3
Most of the points are located along a straight line inclined by about 45 degrees to the abscissa axis - that is, in most cities the “contribution to production” of graduates of the VO and SPO programs is about the same. But, as was to be expected, Peter and Moscow again stand out against the general background by a strong numerical superiority towards higher education. However, one should not lose sight of the fact that these regions are among the leaders in the absolute number of secondary school graduates.
This means that the geography factor should be taken into account when comparing the indicators of higher education and secondary vocational education: after all, the situation in the labor market in Moscow and St. Petersburg is better than in most regions. Thus, a significant part of university graduates will be easier to find a job due to the “good” location of their educational organizations. Unlike their colleagues from technical schools.
Those who have not read our first article on this topic, we recommend to read it. If not with the results, then at least with the monitoring methodology. This will help to avoid unnecessary questions.
If you read too lazy, then the following is a summary of the methodology:
1) The project was launched the year before last together with several ministries and departments.
2) The data on graduates (specialty, date of birth, year of graduation, etc.) is filled in by the educational organizations themselves at the FIS FRDO .
3) Then, verified and correct data is transferred to the Pension Fund (with the exception of foreigners who continue to study at the next level of education), who returns information about who gets what salary and in which region he or she works. Thus, only the “white salary” is taken into account.
PS If you know how reliableit is to find out the “black salary” without surveys and blackjack , we invite you with your ideas in the comments, the FTS will be very happy with this project, and we will be happy to implement it. ;-)
In the course of the implementation of the project on secondary vocational education, we received data on graduates of the 2013 graduation year and “traced” their employment in 2013, 2014 and 2015. The same was done with graduates of 2014 graduation years for 2014 and 2015, respectively, of employment. For simplicity, in the future, we will replace the phrase “graduates of the 20 year of graduation in the 20th year of employment” with “20-20”. For example, “2013-2013”, “2013-2015”.
Unfortunately, not all organizations that implement open source software programs have entered information into the FIS FRDO. In contrast to the monitoring of employment for the "tower", where data were submitted by approximately 99% of graduates, during this project it was possible to obtain data only on ~ 2/3 graduates. This introduces some distortions in the results, but does not prevent to evaluate the whole picture (we carried out a number of statistical checks, which showed that the average share of employment does not depend on the volume of output). Let us hope that next time educational organizations will approach the issue of submitting data more responsibly.
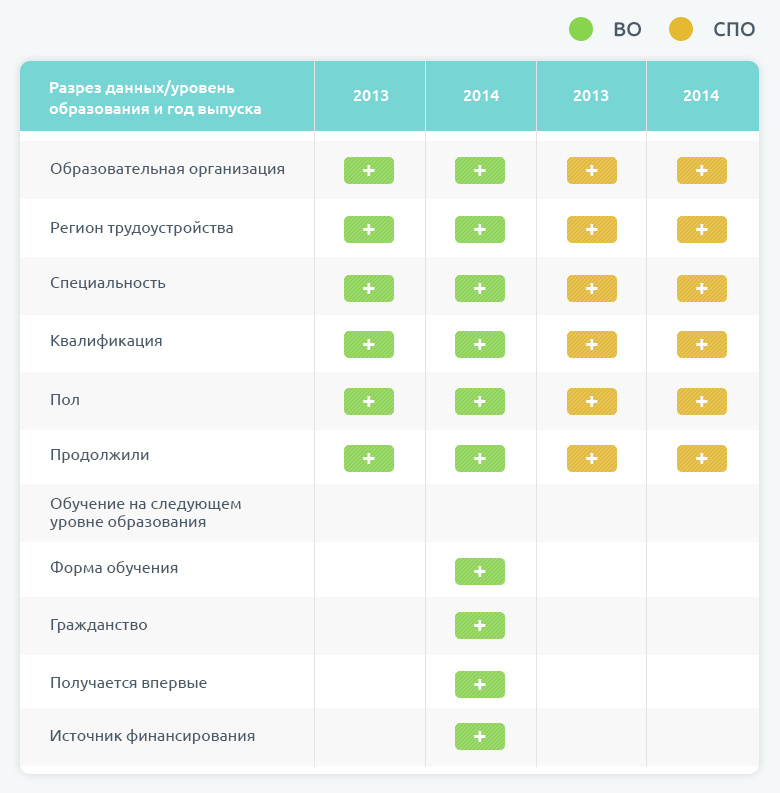
What cuts can be analyzed? Collecting data from educational organizations is not an easy and quick job. Therefore, if for universities we were able to introduce additional sections of the data collected for graduates in 2014, then for SPO there are none. What it is about will become clear from the following table:
Table 1. Data sections.
Finally, we proceed directly to the resulting figures. Let's look at the summary table of monitoring results for Russia as a whole:
Table 2. General results of SPO monitoring
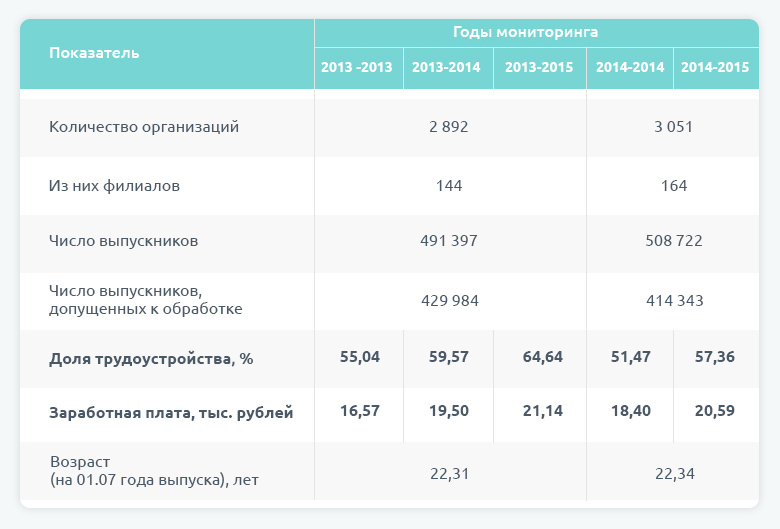
The table gives an idea of the order of the numbers. Those who remember the previous article will immediately pay attention to the relatively low share of employment and to the level of wages, which turned out to be below the national average (recall that graduates of higher education institutions have a salary approximately equal to the average in Russia).
But we are interested not only in the SPO itself, but also in its comparison with the “tower”. To do this, we will look at charts that allow to compare these two types of education in Russia as a whole (there are no employment data for graduates of the “tower” in the year of graduation):

Figure 4. Hereinafter, data are given for all graduates, except those who continued their studies (unless otherwise indicated).
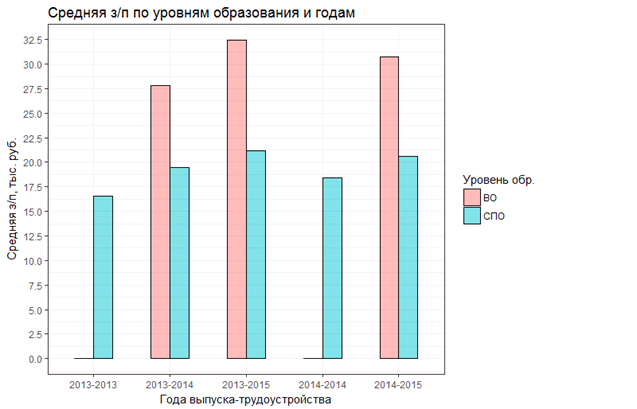
Figure 5.

Figure 6.
From the figures we can draw several conclusions:
1) The more years have passed since the release, the greater the proportion of employment and salary. By the way, please note that STRs have a higher increase in the share of employment over time. There is a hypothesis that this is due to the large number of graduates who go into the army after graduation. But in this article we will not dwell on it. In addition, as mentioned above, the analysis of the dynamics of indicators by year is the topic of our next article.
2) For graduates of higher education, both wages and the share of employment are higher. The result is quite expected, and the wage gap is almost 1.5 times, it is even more “headhunter”.
3) SPO graduates are younger than VO graduates for about 4 years. The average age itself is quite high: 22.5 and 26.5 years, respectively. This should not be embarrassing: firstly, not everyone gets an education immediately after school, and secondly, among university graduates, many receive a second higher education.
That's all seemingly. The graphs above already compare two levels of education. Got a very specific result - university graduates are better employed, get a higher salary. But the strong difference in the age of graduates, the differences between specialties, as well as our geographical surveys at the very beginning of the article say that it was only the average temperature in the hospital, and it’s impossible to compare SPO and HE directly like this. Well, let's try to consider the issue in a bit more detail.
Let us turn to the main thing - a detailed comparison of the two levels of education. The head-on comparison does not work, as we saw above. So it is necessary to select those segments of VO and SPO graduates that we can correctly compare with each other.
The following section will describe the comparison technique, the most impatient can skip it and go directly to the results .
Comparing graduates of VO and vocational schools, we compare people who not only received different education, but also have different socio-demographic characteristics:
1) High rates of "tower" can be largely due to the dominance of this type of education in Moscow and St. Petersburg - cities with a good (relative to other regions) situation in the labor market, where there is more opportunity and higher wages. It means that it is necessary to correct the calculations taking into account the region of employment of the graduate. We will take this feature into account in our metric used for comparison (see below).
2) Among university graduates, many have received a second higher education, as well as those who study by correspondence or “at an evening”. Both of these groups have an obvious advantage, since at the time of graduation from the university, they most likely already have work experience, that is, they start their careers not from scratch. So, it is necessary to remove from the sample all who receive not the first higher education.
3) Among university graduates there are foreigners, the employment results of which rarely have a positive trend on average indicators. So, it is necessary to remove from the sample of all foreigners.
Thus, we need to select graduates who meet the following conditions: citizens of the Russian Federation, full-time students who received education for the first time. This will make it possible to somewhat equalize the socio-demographic characteristics in both samples.
As can be seen from Table 1 , we have all these data (citizenship, obtaining a second higher education, form of education) for graduates of HE in 2014, but not for graduates of secondary vocational education. However, this is not critical due to the following features:
• in contrast to the students of the “tower”, of all those who receive vocational secondary education according to official statistics, only about 16% do not study full-time;
• getting a second secondary vocational education is much more rare than getting a second higher education;
• The number of foreign students in the STR system varies in the area of error.
Consequently, it can be assumed that SPO graduates satisfy this selection by default and in full, and from graduates of universities we will select only those who fit the conditions described above. And further, unless otherwise specified, we will mean by "graduates of VO" namely "filtered" graduates.
Let's see if such a selection has made the effect we need (I remind you that such filtering became possible only starting from 2014):
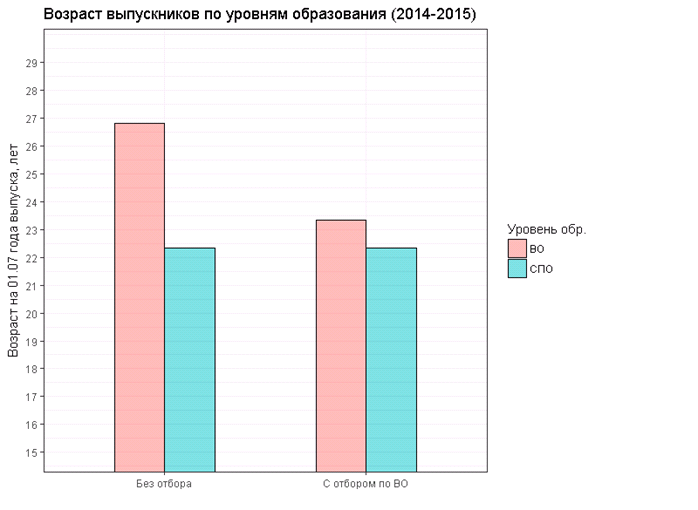
Figure 7.
From the graph of ages it is clear that we are already comparing categories of citizens that are much closer to each other. But, despite the fact that the average age of the samples is now closer to each other, this is not enough. Firstly, the difference is still more than a year, which is quite a lot, and, secondly, within the sample, graduates with very different age can still be found.
So, we need to look for such cases, when both graduates of both VO and SPO will finish their studies at approximately the same age. For the duration of training, the qualification of the specialist is mainly responsible (bachelor, master, middle level specialist, etc.).
The duration of training is also affected by the specialty of the graduate. In addition, it seems obvious that graduates working in approximately the same areas should be compared (it is strange to compare cooks with a medical worker, even if they graduated at exactly the same age).
Summing up, we will compare graduates of the same specialties, whose age at the time of graduation is about the same: they spent the same amount of time on training and began their career conditionally "from scratch". That is, it is necessary to find such combinations of specialties and qualifications for which the age of graduates would differ only slightly (let us accept a discrepancy of 1 year as acceptable). It turns out a kind of INNER JOIN of VO and SPO graduates on the condition of equality of specialty and age of graduation.
To exclude emissions, we remove from the comparison a pair of “specialty-qualifications,” for which there were less than a hundred graduates in one of the levels of education. Then the comparison will involve 54 pairs.
As we remember from the previous article, we have two main indicators of employment - the average wage and the share of employment. For an objective comparison, it would be nice to consider both of them. At the same time, wages should be taken into account as corrected by the level of the average wage of the region in which the graduate was employed. The point here is not only in the high wages of residents of metropolitan megacities, but also, for example, in the high average wages of the northern regions. A graduate who earns 50 thousand in Rostov and Kamchatka are two big differences.
Thus, the assessment of employment will be considered for each pair of "specialty-qualification" according to the formula:
Where:
• - The salary of graduates in this specialty and qualification in the i-th region of employment;
• n - the number of regions in which graduates of this specialty and qualification were employed;
• DT - the share of employment for this specialty and qualifications in Russia as a whole.
• Wed. The RFP is the corresponding average salary for 2015 by region and for Russia as a whole (according to Rosstat).
In simple words: we adjust the salary of graduates in each specialty and qualification to the level of salaries in the region in which they were employed, and to the share of employment of graduates of this specialty.
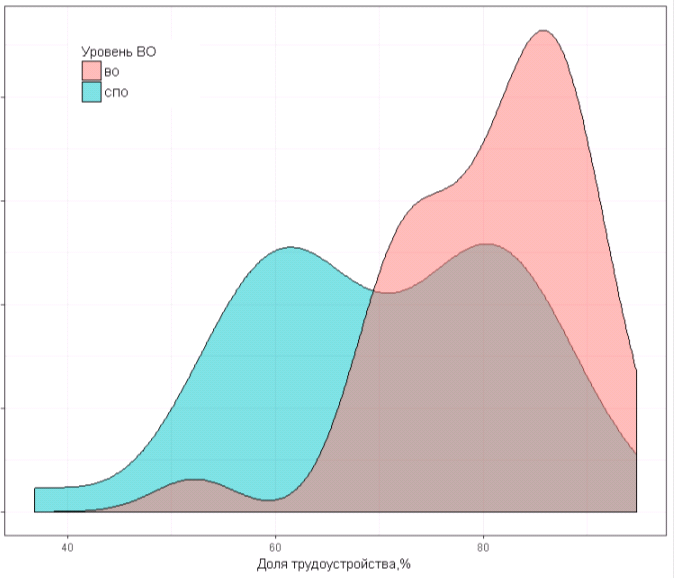
Finally, a comparison: in general, the distribution of employment estimates, as expected, in favor of higher education. To begin with, we will look at their distribution:

Figure 9.
But judging by the schedule, the advantage of VO cannot be called devastating. Therefore, we will look at these tables for a better understanding of the situation:
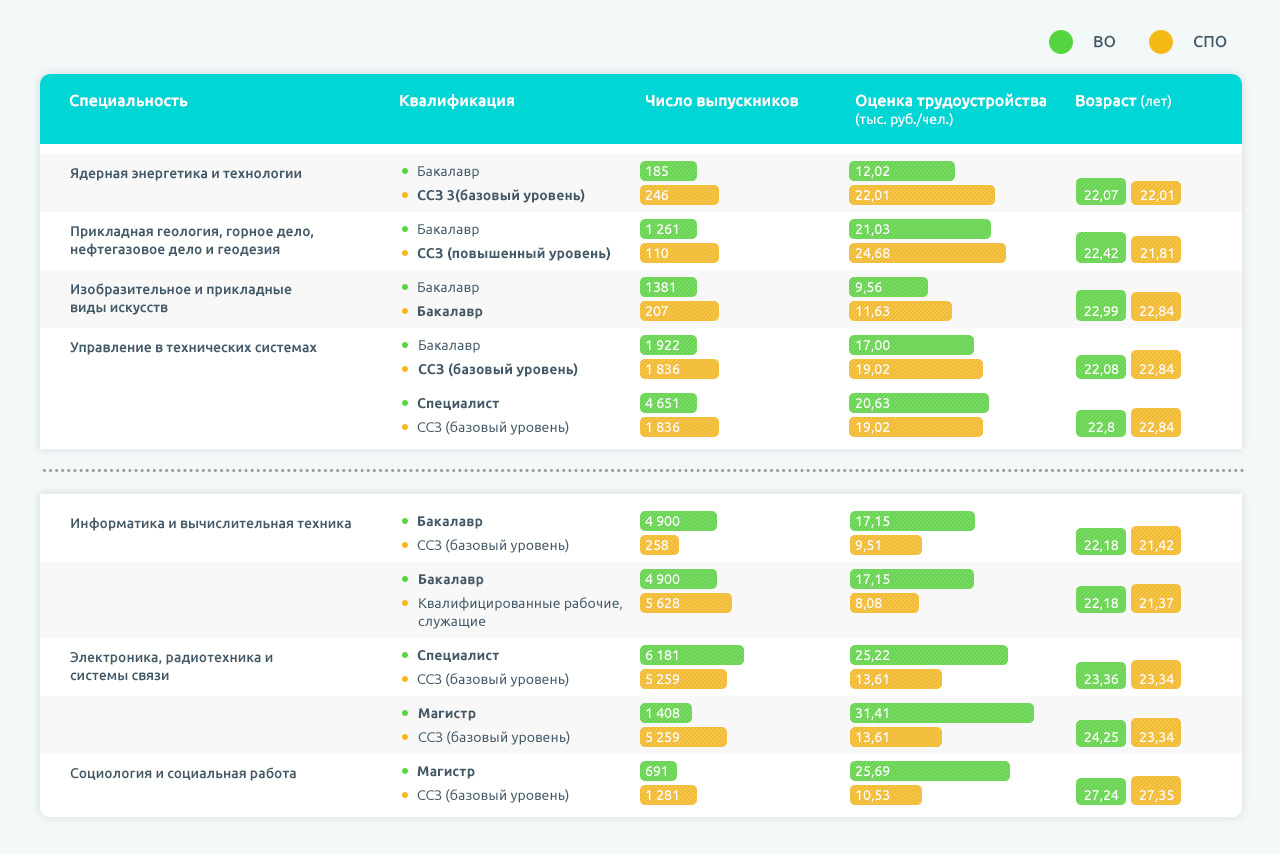
Table 3. To save space in the post, we have derived only the best and worst lines.
The full version of the table is available here. The table is grouped so that you can conveniently compare the results by specialties. Interactive version of the table in the first comment.
It may be noted that in some cases the age of graduates of the basic level of training is higher than that of advanced graduates. Most likely, this is due to the peculiarities of the duration of training in specific areas of training in the framework of the relevant UGOS.
As expected, for most (but not all) specialties, VO graduates received higher marks. In seven cases, representatives of the open source software “won,” and in seven more, the advantage of the “tower” is quite small (up to 2,000 rubles). Thus, we can say that there are such specialties, obtaining secondary vocational education in which in general is not less “profitable” than obtaining a higher one.
Naturally, this is only a comparison within the framework of existing indicators. Of course, in each case it is necessary to understand individually. The first (like any other) line of the table should not be perceived by nuclear students as proof of the infidelity of the choice of education level :). It is also necessary to remember that the equality of specialties between the two levels of education means only a general field of activity, but not the absolute identity of the professions received.
We could not but include in the article a kind of “bonus track” - an analysis of universities that teach the same UGSN for both HE and SPO programs. Suddenly it happens that SPE graduates find a job better than their peers from the literally neighboring audience?
Let's go the beaten path and find such cases when the age of graduates of both levels of education is about the same. Only this time, instead of qualifying, we will use the university itself. In addition, now there is no need to take into account the region of employment, so we limit ourselves to the share of employment and the average wage. Also, we will exclude too small issues (the division into pairs “specialty-university” turns out to be smaller than the pairs “specialty-qualification”, therefore we take not 100 people for the threshold value, but 30).Just in case, I would like to warn applicants and their parents that these results should not be taken as the only correct guide to action when choosing a "university or college?"
By tradition, first the distributions that go in favor of
higher education , and again, the advantage does not seem critical: Figure 10. The distribution of the share of employment among university graduates who teach both in HE and in secondary education programs.

Figure 10. Distribution of the average salary for university graduates who teach both VO programs and SPO programs.
And here is the list of such universities:
Table 4. The

full version of the table is available here.
The situation is similar to the one that was when comparing pairs of "specialty-qualification." Total "victory" again for HE. However, the fact that some SPO specialties managed to circumvent HE both in terms of the share of employment and in terms of average wages seems to be a very entertaining fact. I hope this table does not demotivate future agricultural specialists from KSTU :)
We briefly introduced you to the results of monitoring the employment of graduates of secondary vocational education organizations and made a small comparison with the results of a similar monitoring on the “tower”. We are not tired of reminding that this is only one of the possible methods of comparison, and we welcome everyone who decided to use our data for independent analysis (let us recall once again the address of our portal - graduate.edu.ru ).
One thing is for sure, despite all the assumptions: SPO loses IN, but not “dry”. We must not forget about the "black" and the "gray" salaries. It is likely that graduates of secondary vocational education have their role in the formation of income much higher, which may reduce the advantage of HE.
Unfortunately, so far we have to ignore in our comparisons one of the most important factors - the dynamics of changes in employment indicators. For example, the rapid growth of wages may well compensate for its low initial level.
Hopefully, the monitoring project will continue and develop in the coming years, which will allow tracking both the dynamics and a larger number of cuts. Thanks for attention!
First, data on university graduates in 2014 and 2015 were collected and processed. The data for 2015 was processed and published just a few days ago (perhaps, someone from the readers noticed recent publications in the media on this topic). So now you can analyze the results of monitoring over three years at once, tracing the dynamics of indicators. But we will tell about it in more detail in the next article.
Secondly, data on graduates of secondary vocational education in 2013 and 2014 graduates were collected, processed and published on the spo.graduate.edu.ru portal. For those who are not very versed in official terms, these are graduates of “colleges”, “technical schools”, etc. Here we will talk about the results of this monitoring, as well as their comparison with the results of monitoring universities, in this article.
')
We tried to tell as much as possible about the project, so the article turned out to be quite voluminous and therefore divided into several parts. In the first, we will briefly discuss what secondary vocational education is and what should be expected from it. The second discussion will deal with the results of monitoring. A separate important section is devoted to trying to compare the results of graduates of secondary vocational education with the results of university graduates. In other words, we will try to at least partially answer the eternal question “Is higher education important?”, But from an objective, new point of view, relying on dry numbers.
If you are too lazy to read the theory and other explanations, then you can go directly to the most interesting - the results, but we strongly recommend that you familiarize yourself at least with the research methodology.
Table of contents:
1. Theoretical part
- What is open source software?
- Stereotypes, features, expectations
- Geography of training
- Method
2. General results
3. Detailed comparison of VO and SPO
- Data preparation
- Comparison metric
- Comparison results
4. Comparison of graduates from one university
5. Conclusions
Theoretical part
What is open source software?
To begin with, let's deal with the terms in order to understand each other correctly. What is a secondary vocational education? As the name suggests, this is, first of all, professional education.
273-FZ
(It should be noted that with the introduction of the new N 273- “On education in the Russian Federation”, the term “ higher professional education” was abolished and replaced by “higher education”).
The main task of this level of education is to teach students in the shortest possible time key skills and knowledge, which will be enough to start working. Some specialties can be entered after the 9th grade. Such graduates are now often called “workers” or “blue collars”, i.e. people who work with their hands in factories, warehouses, in hairdressing salons, shops, etc.
Sometimes it is considered that the ACT is more aimed only at obtaining workers or specialties that do not require in-depth knowledge. However, this is not quite true. Many, though not all, specialties that can be taught in higher education programs are also available in vocational education. Of course, the training programs and the intensity of training will be different. It should be noted that many higher education institutions can also teach in secondary vocational education programs.
GEF 3+
Hereinafter, by specialty, we will mean “an integrated group of specialties and areas of training.” More details can be found in the GEF 3+ reference books:
STR is divided into:
- training programs for skilled workers and employees (roughly speaking, what used to be called primary vocational education);
- training programs for mid-level specialists.
The latter, in turn, are divided into basic and in-depth levels (training lasts about a year longer). If it is interesting, then you can learn more about the system of secondary vocational education in Russia at one of the resources of the Ministry of Education and Science of Russia.
For simplicity, hereinafter, we will call all graduates who have received secondary vocational education “graduates of secondary vocational education” or “graduates of technical schools” and those who graduated from higher education - “graduates of higher education” or “graduates of higher educational institutions”. Although formally, this is not entirely true, but it is immediately clear to everyone.
Stereotypes, features, expectations
Secondary vocational education is generally considered less prestigious than higher education. Accordingly, it is considered that both salaries and employment for secondary school graduates are worse than those who have received higher education. However, at some point, the view began to become popular about the increasing value of the labor market cadres in the labor market. It is, of course, about highly skilled professions, for example, an operator of a CNC machine. And, according to official statements , the popularity of open source software in recent years is indeed growing, including through projects such as Worldskills .
A cursory analysis of the state of affairs in the labor market shows that the first of stereotypes is more likely to be true. To do this, we use the well-known portal hh.ru and select vacancies that require “secondary special” or “secondary vocational” education. And then compare with those where you need a "higher education". The figure below confirms that, in general, specialists with higher education "are" more expensive:
Figure 1. (Data for July 4, 2017 for the region of Russia)If we calculate the average salaries offered, then for a specialist with VO, sums are offered approximately ~ 1.24 times more.
This is a very rough assessment of the labor market. If only because besides hh there are portals that specialize in vacancies specifically for people with open source software, and there the situation may differ.
At the same time, we must not forget that many specialties of open source software also have “freelancing”. For example, the familiar example of a plumber, who takes money for the work in his pocket, or teams of workers who make repairs without a contract. Unfortunately, it is impossible to estimate these revenues and their share using official data.
Study geography
Obviously, both the average wage and the share of employment strongly depend on the region. First, look at the differences in the geographical distribution of graduates. Is the popularity of VO and ACT in the regions of Russia evenly distributed? How to evaluate what kind of education "prevails" in the region? We construct the dependence of the share of secondary school and high school graduates on the total population. Given that not all regions have equally well filled in the data for monitoring, we will use the official statistics of the ministry (data taken for 2014, for 2013 the situation is about the same), but not monitoring data.
Figure 2
Signed regions are marked in red. These are regions where the “bias” in the direction of an education is 2 or more times. Of course, our two capitals are striking - these are two large cities that have a clear bias towards the “tower”.
Now let's look a little from a different angle: let's calculate the share of graduates who studied in a particular region, from the total graduation in the corresponding educational level:
Figure 3
Most of the points are located along a straight line inclined by about 45 degrees to the abscissa axis - that is, in most cities the “contribution to production” of graduates of the VO and SPO programs is about the same. But, as was to be expected, Peter and Moscow again stand out against the general background by a strong numerical superiority towards higher education. However, one should not lose sight of the fact that these regions are among the leaders in the absolute number of secondary school graduates.
This means that the geography factor should be taken into account when comparing the indicators of higher education and secondary vocational education: after all, the situation in the labor market in Moscow and St. Petersburg is better than in most regions. Thus, a significant part of university graduates will be easier to find a job due to the “good” location of their educational organizations. Unlike their colleagues from technical schools.
Monitoring methodology
I would like to repeat a couple of disclaimers from the previous article:
1) The data presented on the portal, have many sections. Their analysis can be done in various ways and methods. We strongly encourage everyone who wants to perform an independent analysis of our data. All of them are available for free on graduate.edu.ru for download in various formats (registration required).
Below is just one of the options for such an analysis, which allows, in the first approximation, to evaluate the results, as well as compare the indicators of monitoring of STR and HE The purpose of this article was not a deep scientific analysis of the data, but a brief acquaintance of readers with the project, its results and examples of possible analysis.
2) For those who rarely deal with statistics. In the general case, when it comes to statistical laws, we cannot talk about what is the cause and what is the effect. Good incomes and relative ease of employment for graduates of the prestigious university NN do not prove the university’s exceptional merit in this. Since many talented and capable students come to prestigious universities, it is likely that they would have reached the same or even greater heights by studying in another university. The answer to such questions is the subject of a separate large study.
Those who have not read our first article on this topic, we recommend to read it. If not with the results, then at least with the monitoring methodology. This will help to avoid unnecessary questions.
If you read too lazy, then the following is a summary of the methodology:
1) The project was launched the year before last together with several ministries and departments.
2) The data on graduates (specialty, date of birth, year of graduation, etc.) is filled in by the educational organizations themselves at the FIS FRDO .
3) Then, verified and correct data is transferred to the Pension Fund (with the exception of foreigners who continue to study at the next level of education), who returns information about who gets what salary and in which region he or she works. Thus, only the “white salary” is taken into account.
PS If you know how reliable
In the course of the implementation of the project on secondary vocational education, we received data on graduates of the 2013 graduation year and “traced” their employment in 2013, 2014 and 2015. The same was done with graduates of 2014 graduation years for 2014 and 2015, respectively, of employment. For simplicity, in the future, we will replace the phrase “graduates of the 20 year of graduation in the 20th year of employment” with “20-20”. For example, “2013-2013”, “2013-2015”.
Unfortunately, not all organizations that implement open source software programs have entered information into the FIS FRDO. In contrast to the monitoring of employment for the "tower", where data were submitted by approximately 99% of graduates, during this project it was possible to obtain data only on ~ 2/3 graduates. This introduces some distortions in the results, but does not prevent to evaluate the whole picture (we carried out a number of statistical checks, which showed that the average share of employment does not depend on the volume of output). Let us hope that next time educational organizations will approach the issue of submitting data more responsibly.
What cuts can be analyzed? Collecting data from educational organizations is not an easy and quick job. Therefore, if for universities we were able to introduce additional sections of the data collected for graduates in 2014, then for SPO there are none. What it is about will become clear from the following table:
Table 1. Data sections.
Main results
Finally, we proceed directly to the resulting figures. Let's look at the summary table of monitoring results for Russia as a whole:
Table 2. General results of SPO monitoring
The table gives an idea of the order of the numbers. Those who remember the previous article will immediately pay attention to the relatively low share of employment and to the level of wages, which turned out to be below the national average (recall that graduates of higher education institutions have a salary approximately equal to the average in Russia).
But we are interested not only in the SPO itself, but also in its comparison with the “tower”. To do this, we will look at charts that allow to compare these two types of education in Russia as a whole (there are no employment data for graduates of the “tower” in the year of graduation):
Figure 4. Hereinafter, data are given for all graduates, except those who continued their studies (unless otherwise indicated).
Figure 5.
Figure 6.
From the figures we can draw several conclusions:
1) The more years have passed since the release, the greater the proportion of employment and salary. By the way, please note that STRs have a higher increase in the share of employment over time. There is a hypothesis that this is due to the large number of graduates who go into the army after graduation. But in this article we will not dwell on it. In addition, as mentioned above, the analysis of the dynamics of indicators by year is the topic of our next article.
2) For graduates of higher education, both wages and the share of employment are higher. The result is quite expected, and the wage gap is almost 1.5 times, it is even more “headhunter”.
3) SPO graduates are younger than VO graduates for about 4 years. The average age itself is quite high: 22.5 and 26.5 years, respectively. This should not be embarrassing: firstly, not everyone gets an education immediately after school, and secondly, among university graduates, many receive a second higher education.
That's all seemingly. The graphs above already compare two levels of education. Got a very specific result - university graduates are better employed, get a higher salary. But the strong difference in the age of graduates, the differences between specialties, as well as our geographical surveys at the very beginning of the article say that it was only the average temperature in the hospital, and it’s impossible to compare SPO and HE directly like this. Well, let's try to consider the issue in a bit more detail.
Detailed comparison of VO and SPO
Let us turn to the main thing - a detailed comparison of the two levels of education. The head-on comparison does not work, as we saw above. So it is necessary to select those segments of VO and SPO graduates that we can correctly compare with each other.
The following section will describe the comparison technique, the most impatient can skip it and go directly to the results .
Data preparation
Comparing graduates of VO and vocational schools, we compare people who not only received different education, but also have different socio-demographic characteristics:
1) High rates of "tower" can be largely due to the dominance of this type of education in Moscow and St. Petersburg - cities with a good (relative to other regions) situation in the labor market, where there is more opportunity and higher wages. It means that it is necessary to correct the calculations taking into account the region of employment of the graduate. We will take this feature into account in our metric used for comparison (see below).
2) Among university graduates, many have received a second higher education, as well as those who study by correspondence or “at an evening”. Both of these groups have an obvious advantage, since at the time of graduation from the university, they most likely already have work experience, that is, they start their careers not from scratch. So, it is necessary to remove from the sample all who receive not the first higher education.
3) Among university graduates there are foreigners, the employment results of which rarely have a positive trend on average indicators. So, it is necessary to remove from the sample of all foreigners.
Thus, we need to select graduates who meet the following conditions: citizens of the Russian Federation, full-time students who received education for the first time. This will make it possible to somewhat equalize the socio-demographic characteristics in both samples.
As can be seen from Table 1 , we have all these data (citizenship, obtaining a second higher education, form of education) for graduates of HE in 2014, but not for graduates of secondary vocational education. However, this is not critical due to the following features:
• in contrast to the students of the “tower”, of all those who receive vocational secondary education according to official statistics, only about 16% do not study full-time;
• getting a second secondary vocational education is much more rare than getting a second higher education;
• The number of foreign students in the STR system varies in the area of error.
Consequently, it can be assumed that SPO graduates satisfy this selection by default and in full, and from graduates of universities we will select only those who fit the conditions described above. And further, unless otherwise specified, we will mean by "graduates of VO" namely "filtered" graduates.
Let's see if such a selection has made the effect we need (I remind you that such filtering became possible only starting from 2014):
Figure 7.
From the graph of ages it is clear that we are already comparing categories of citizens that are much closer to each other. But, despite the fact that the average age of the samples is now closer to each other, this is not enough. Firstly, the difference is still more than a year, which is quite a lot, and, secondly, within the sample, graduates with very different age can still be found.
So, we need to look for such cases, when both graduates of both VO and SPO will finish their studies at approximately the same age. For the duration of training, the qualification of the specialist is mainly responsible (bachelor, master, middle level specialist, etc.).
For those who are interested in exactly how qualifications affect the duration of training, you can take a look at this Gantt chart.
Figure 8. Since we are talking about graduates of 2013–2014, both the internship that has been canceled and the specialty are present in the diagram. The diagram shows only the most popular options for the duration of studies at various qualifications and levels of education.
Figure 8. Since we are talking about graduates of 2013–2014, both the internship that has been canceled and the specialty are present in the diagram. The diagram shows only the most popular options for the duration of studies at various qualifications and levels of education.
The duration of training is also affected by the specialty of the graduate. In addition, it seems obvious that graduates working in approximately the same areas should be compared (it is strange to compare cooks with a medical worker, even if they graduated at exactly the same age).
Summing up, we will compare graduates of the same specialties, whose age at the time of graduation is about the same: they spent the same amount of time on training and began their career conditionally "from scratch". That is, it is necessary to find such combinations of specialties and qualifications for which the age of graduates would differ only slightly (let us accept a discrepancy of 1 year as acceptable). It turns out a kind of INNER JOIN of VO and SPO graduates on the condition of equality of specialty and age of graduation.
To exclude emissions, we remove from the comparison a pair of “specialty-qualifications,” for which there were less than a hundred graduates in one of the levels of education. Then the comparison will involve 54 pairs.
Comparison metrics
As we remember from the previous article, we have two main indicators of employment - the average wage and the share of employment. For an objective comparison, it would be nice to consider both of them. At the same time, wages should be taken into account as corrected by the level of the average wage of the region in which the graduate was employed. The point here is not only in the high wages of residents of metropolitan megacities, but also, for example, in the high average wages of the northern regions. A graduate who earns 50 thousand in Rostov and Kamchatka are two big differences.
Thus, the assessment of employment will be considered for each pair of "specialty-qualification" according to the formula:
Where:
• - The salary of graduates in this specialty and qualification in the i-th region of employment;
• n - the number of regions in which graduates of this specialty and qualification were employed;
• DT - the share of employment for this specialty and qualifications in Russia as a whole.
PS
, . , . , , , , .
• Wed. The RFP is the corresponding average salary for 2015 by region and for Russia as a whole (according to Rosstat).
In simple words: we adjust the salary of graduates in each specialty and qualification to the level of salaries in the region in which they were employed, and to the share of employment of graduates of this specialty.
Comparison results
Finally, a comparison: in general, the distribution of employment estimates, as expected, in favor of higher education. To begin with, we will look at their distribution:
Figure 9.
But judging by the schedule, the advantage of VO cannot be called devastating. Therefore, we will look at these tables for a better understanding of the situation:
Table 3. To save space in the post, we have derived only the best and worst lines.
The full version of the table is available here. The table is grouped so that you can conveniently compare the results by specialties. Interactive version of the table in the first comment.
It may be noted that in some cases the age of graduates of the basic level of training is higher than that of advanced graduates. Most likely, this is due to the peculiarities of the duration of training in specific areas of training in the framework of the relevant UGOS.
As expected, for most (but not all) specialties, VO graduates received higher marks. In seven cases, representatives of the open source software “won,” and in seven more, the advantage of the “tower” is quite small (up to 2,000 rubles). Thus, we can say that there are such specialties, obtaining secondary vocational education in which in general is not less “profitable” than obtaining a higher one.
Naturally, this is only a comparison within the framework of existing indicators. Of course, in each case it is necessary to understand individually. The first (like any other) line of the table should not be perceived by nuclear students as proof of the infidelity of the choice of education level :). It is also necessary to remember that the equality of specialties between the two levels of education means only a general field of activity, but not the absolute identity of the professions received.
Comparison of graduates from one university
We could not but include in the article a kind of “bonus track” - an analysis of universities that teach the same UGSN for both HE and SPO programs. Suddenly it happens that SPE graduates find a job better than their peers from the literally neighboring audience?
Let's go the beaten path and find such cases when the age of graduates of both levels of education is about the same. Only this time, instead of qualifying, we will use the university itself. In addition, now there is no need to take into account the region of employment, so we limit ourselves to the share of employment and the average wage. Also, we will exclude too small issues (the division into pairs “specialty-university” turns out to be smaller than the pairs “specialty-qualification”, therefore we take not 100 people for the threshold value, but 30).Just in case, I would like to warn applicants and their parents that these results should not be taken as the only correct guide to action when choosing a "university or college?"
By tradition, first the distributions that go in favor of
higher education , and again, the advantage does not seem critical: Figure 10. The distribution of the share of employment among university graduates who teach both in HE and in secondary education programs.
Figure 10. Distribution of the average salary for university graduates who teach both VO programs and SPO programs.
And here is the list of such universities:
Table 4. The
full version of the table is available here.
The situation is similar to the one that was when comparing pairs of "specialty-qualification." Total "victory" again for HE. However, the fact that some SPO specialties managed to circumvent HE both in terms of the share of employment and in terms of average wages seems to be a very entertaining fact. I hope this table does not demotivate future agricultural specialists from KSTU :)
findings
We briefly introduced you to the results of monitoring the employment of graduates of secondary vocational education organizations and made a small comparison with the results of a similar monitoring on the “tower”. We are not tired of reminding that this is only one of the possible methods of comparison, and we welcome everyone who decided to use our data for independent analysis (let us recall once again the address of our portal - graduate.edu.ru ).
One thing is for sure, despite all the assumptions: SPO loses IN, but not “dry”. We must not forget about the "black" and the "gray" salaries. It is likely that graduates of secondary vocational education have their role in the formation of income much higher, which may reduce the advantage of HE.
Unfortunately, so far we have to ignore in our comparisons one of the most important factors - the dynamics of changes in employment indicators. For example, the rapid growth of wages may well compensate for its low initial level.
Hopefully, the monitoring project will continue and develop in the coming years, which will allow tracking both the dynamics and a larger number of cuts. Thanks for attention!
Source: https://habr.com/ru/post/332726/
All Articles