How does JVM allocate objects?
 How does the JVM create new objects? What exactly happens when you write
 new Object() ?
At conferences, they periodically say that TLABs (thread-local allocation buffer) are used to allocate objects: memory areas allocated exclusively to each thread, the creation of objects in which is very fast due to the lack of synchronization.
But how to choose the right size TLAB'a? What to do if you need to allocate 10% of the size of TLAB, and only 9% is free? Can an object be allocated outside TLAB? When (if) the allocated memory is reset?
After asking these questions and not finding all the answers, I decided to write an article to correct the situation.
Before reading it is useful to remember how some garbage collector works (for example, after reading this series of articles).
Introduction
What steps are needed to create a new object?
First of all, you need to find an unallocated memory area of the required size, then you need to initialize the object: reset the memory, initialize some internal structures (information that is used when getClass() called and synchronized on the object, etc.) and finally you need to call the constructor.
The article is structured like this: first, let's try to understand what should happen in theory, then somehow climb into the inside of the JVM and see how it all happens, and in the end we will write some benchmarks to make sure for sure.
Disclaimer: Some parts are deliberately simplified without loss of generality. Speaking about garbage collection, I mean any compacting collector, and speaking of address space - eden of the younger generation. For other [standard or widely known] garbage collectors, parts may vary, but not too much.
TLAB 101
The first part is to allocate free memory for our object.
In general, effective allocation of memory is a non-trivial task, full of pain, suffering, and dragons. For example, coherent lists are created for sizes multiple of powers of two, they are searched and, if necessary, memory areas are cut and moved from one list to another (aka buddy allocator ).
Fortunately, there is a garbage collector in the Java machine that takes the hard part of the work. During the young generation process, all living objects are moved to the survivor space, leaving one large continuous region of free memory in eden.
Since the memory in the JVM frees up the GC, the allocator only needs to know where to look for this free memory, to actually control access to one pointer to this free memory. That is, the allocation should be very simple. and consist of ponies and rainbows : you need to add to the pointer to the free eden object size, and our memory (this technique is called bump-the-pointer ).
Memory can be allocated multiple threads, so you need some form of synchronization. If you make it the easiest way (blocking on a heap region or atomic pointer increment), memory allocation can easily become a bottleneck, so JVM developers developed the previous idea with bump-the-pointer: each thread is allocated a large chunk of memory that belongs only to it . Allocations within such a buffer occur with the same pointer increment (but local, without synchronization) as long as possible, and a new area is requested each time the current one ends. This area is called the thread-local allocation buffer . It turns out a kind of hierarchical bump-the-pointer, where the heap region is on the first level, and the current stream is on the second level. Some cannot stop at this and go even further, hierarchically putting buffers into buffers.

It turns out that in most cases the allocation should be very fast, run in just a couple of instructions and look something like this:
start = currentThread.tlabTop; end = start + sizeof(Object.class); if (end > currentThread.tlabEnd) { goto slow_path; } currentThread.setTlabTop(end); callConstructor(start, end); It looks too good to be true, so we will use PrintAssembly and see what the method that java.lang.Object creates is compiled:
; Hotspot machinery skipped mov 0x60(%r15),%rax ; start = tlabTop lea 0x10(%rax),%rdi ; end = start + sizeof(Object) cmp 0x70(%r15),%rdi ; if (end > tlabEnd) ja 0x00000001032b22b5 ; goto slow_path mov %rdi,0x60(%r15) ; tlabTop = end ; Object initialization skipped Possessing the secret knowledge that in the register %r15 there is always a pointer to the VM flow (lyrical digression: due to such an invariant thread-local and Thread.currentThread() work very quickly), we understand that this is the code which we expected to see. At the same time, we note that the JIT compiler injects the allocation directly into the calling method.
In this way, the JVM is almost free (without recalling garbage collection) creating new objects for a dozen instructions, shifting the responsibility for clearing the memory and defragmentation to the GC. A nice bonus is the locality of the allocated data in a row, which classical allocators may not guarantee. There is a whole study about the effect of such locality on the performance of typical applications. Spoiler alert : does everything a bit faster even though the GC is heavily loaded.
The effect of TLAB size on what is happening
What should be the size of a TLAB? In the first approximation, it is reasonable to assume that the smaller the buffer size, the more memory allocation will pass through a slow branch, and, therefore, TLAB needs to be done more: less often we go to a relatively slow overall heap for memory and quickly create new objects.
But there is another problem: internal fragmentation .
Consider a situation where TLAB has a size of 2 megabytes, eden region (from which TLABs are allocated) is 500 megabytes, and an application has 50 streams. As soon as the space for new TLABs in the heap is over, the very first thread that runs out of its TLAB will trigger garbage collection. If we assume that TLABs are filled with ± uniformly (in real applications this may not be the case), then on average, the remaining TLABs will be filled in about half. That is, if there is another 0.5 * 50 * 2 == 50 megabytes of unallocated memory (as much as 10%), garbage collection begins. It turns out not very well: a significant part of the memory is still free, but the GC is still called.

If you continue to increase the size of TLAB or the number of threads, then the memory loss will grow linearly, and it turns out that TLAB accelerates allocations, but slows down the application as a whole, straining the garbage collector once again.
And if there is still a place in TLAB, but the new object is too big? If you throw away the old buffer and allocate a new one, then fragmentation will only increase, and if in such situations you always create an object directly in eden, then the application will start to work slower than it could?
In general, what to do is not very clear. You can hard-code the mystical constant (as it was done for inlinating heuristics), you can give the size to the developer and tune it for each application individually (incredibly convenient), you can teach the JVM how to guess the correct answer.
What to do?
Choosing a constant is a thankless task, but Sun engineers did not despair and went the other way: instead of specifying the size, the percentage of fragmentation is indicated - part of the heap, which we are willing to sacrifice for quick allocations, and the JVM will somehow figure it out. Parameter TLABWasteTargetPercent responsible for this and defaults to 1%.
Using all the same hypothesis about the uniformity of memory allocation by threads, we get a simple equation: tlab_size * threads_count * 1/2 = eden_size * waste_percent .
If we are ready to donate 10% of eden, we have 50 threads, and eden occupies 500 megabytes, then at the beginning of garbage collection 50 megabytes can be free in half-empty TLABs, that is, in our example, the size of TLAB will be 2 megabytes.
There is a serious omission in this approach: the assumption is used that all flows are allocated in the same way, which is almost always not true. It is undesirable to adjust the number to the speed of allocation of the most intensive streams, I do not want to offend their less fast colleagues (for example, scheduled-workers). Moreover, in a typical application there are hundreds of streams (for example, in the trades of your favorite app server), and there will be only a few new objects created without serious workload, this also needs to be somehow taken into account. And if you recall the question "What to do if you need to allocate 10% of the size of the TLAB, and only 9% is free?", Then it becomes completely unobvious.
There are too many details to just guess or spy on a blog, so it's time to figure out how things really work out ™: look at the hotspot sources.
I used the jdk9 wizard, here is CMakeLists.txt , which CLion starts working with if you want to repeat the journey.
Tumbling down the rabbit hole
The file of interest is located on the first grep and is called threadLocalAllocBuffer.cpp , which describes the structure of the buffer. Despite the fact that the class describes the buffer, it is created once for each stream and reused when allocating new TLABs, at the same time it also stores various statistics on the use of TLABs.
To understand the JIT compiler, you need to think like a JIT compiler. Therefore, we immediately skip the initial initialization, creating a buffer for the new stream and calculating default values and look at the resize method, which is called for all streams at the end of each assembly:
void ThreadLocalAllocBuffer::resize() { // ... size_t alloc =_allocation_fraction.average() * (Universe::heap()->tlab_capacity(myThread()) / HeapWordSize); size_t new_size = alloc / _target_refills; // ... } Aha For each stream, the intensity of its allocations is monitored, and depending on it and the _target_refills constant (which is carefully signed as "the number of TLABs that the stream would like to request between two assemblies" would be calculated), the new size is calculated.
_target_refills initialized once:
// Assuming each thread's active tlab is, on average, 1/2 full at a GC _target_refills = 100 / (2 * TLABWasteTargetPercent); This is exactly the hypothesis that we assumed above, but instead of the size of TLAB, the number of requests for a new TLAB for the stream is calculated. In order for all threads to have at most x% free memory at the time of assembly, it is necessary that the TLAB size of each thread be 2x% of the entire memory, which it usually allocates between assemblies. Dividing 1 by 2x is just the desired number of requests.
Share share allocations need to be updated sometime. At the beginning of each garbage collection, statistics of all streams is updated, which is in the accumulate_statistics method:
- Check if the thread has updated its TLAB at least once. There is no need to recalculate the size for a stream that does nothing (or, at least, does not allocate).
- We check if half of eden was used to avoid the influence of full GC or pathological cases (for example, an explicit call to
System.gc()) on the calculations. - In the end, we consider what percentage of eden'a spent the flow, and update its share of allocations.
- We update the statistics of how the thread used its TLABs, how much it allocated and how much memory it wasted.
To avoid various unstable effects due to the frequency of assemblies and different allocation patterns associated with inconsistency of the garbage collector and flow desires, the share of allocations is not just a number, but an exponentially weighted moving average that maintains the average value for the last N assemblies. The JVM has its own key for everything, and this place is no exception, the TLABAllocationWeight flag controls how quickly the average “forgets” old values (not that someone wanted to change the value of this flag).
Result
The information received is enough to answer the question of interest to us about the size of a TLAB:
- The JVM knows how much memory it can spend on fragmentation. From this value, the number of TLABs that the stream should request between garbage collections is calculated.
- The JVM keeps track of how much memory each thread uses and smooths out these values.
- Each thread receives the size of the TLAB in proportion to the memory it uses. This solves the problem of non-uniform allocation between threads and, on average, all allocate quickly and waste little memory.

If an application has one hundred threads, 3 of which are in full servicing user requests, 2 have a timer on some auxiliary activity, and all the others are idle, then the first group of threads will receive large TLABs, the second will be very small, and all the others will have default values . Best of all, the number of "slow" allocations (TLAB requests) will be the same for all threads.
Allocation in C1
With the size TLAB'ov figured out. In order not to go far, we dig the source further and see how exactly TLABs stand out when it's fast, when it's slow, and when it's very slow.
Here you will not manage with one class and you need to look into what the new operator is compiling. In order to avoid traumatic brain injury, we will look at the client compiler code (C1): it is much simpler and clearer than the server compiler, well describes the overall picture of the world, and since the new thing in Java is quite popular, there are plenty of interesting optimizations for us.
We are interested in two methods: C1_MacroAssembler::allocate_object , which describes the allocation of an object in TLAB and initialization, and Runtime1::generate_code_for , which is executed when the memory cannot be quickly allocated.
It is interesting to see if an object can always be created quickly, and the "find usages" chain leads us to the following comment in instanceKlass.hpp :
// This bit is initialized in classFileParser.cpp. // It is false under any of the following conditions: // - the class is abstract (including any interface) // - the class has a finalizer (if !RegisterFinalizersAtInit) // - the class size is larger than FastAllocateSizeLimit // - the class is java/lang/Class, which cannot be allocated directly bool can_be_fastpath_allocated() const { return !layout_helper_needs_slow_path(layout_helper()); } From it it becomes clear that very large objects (more than 128 kilobytes by default) and finalizeable classes always go through a slow call to the JVM. (Riddle - where does the abstract classes come from?)
Let's take note of this and go back to the allocation process:
tlab_allocate - an attempt to quickly allocate an object, exactly the code we saw when we looked at PrintAssembly. If it worked, then we finish the allocation and proceed to initializing the object.
tlab_refill - an attempt to allocate a new TLAB. Using an interesting test, the method decides whether to allocate a new TLAB (by discarding the old one) or allocate an object directly in eden, leaving the old TLAB:
// Retain tlab and allocate object in shared space if // the amount free in the tlab is too large to discard. cmpptr(t1, Address(thread_reg, in_bytes(JavaThread::tlab_refill_waste_limit_offset()))); jcc(Assembler::lessEqual, discard_tlab);tlab_refill_waste_limitis just responsible for the size of the TLAB, which we are not ready to sacrifice for the sake of allocating one object. The default value is1.5%of the current TLAB size (for this, of course, there is a parameter -TLABRefillWasteFraction, which suddenly has a value of 64, and the value itself is considered as the current size of TLAB'a divided by the value of this parameter). This limit is raised at each slow allocation to avoid degradation in unsuccessful cases, and is reset at the end of each GC cycle. Another issue less.- eden_allocate - an attempt to allocate memory (object or TLAB) in eden. This place is very similar to the allocation in TLAB: we check if there is a place, and if so, then atomically, using the
lock cmpxchginstruction, we take away our memory, and if not, then we leave in slow path. Selection in eden is not wait-free: if two threads try to allocate something in eden at the same time, then with some probability one of them will fail and have to repeat everything anew.
Jvm upcall
If it did not work out to allocate memory in eden, then a call is made to the JVM, which leads us to the InstanceKlass::allocate_instance . Before the call itself, a lot of auxiliary work is carried out - special structures are set up for the GC and the necessary frames are created to meet the calling conventions , so the operation is not fast.
There is a lot of code and you will not get by with one superficial description, so in order not to bore anyone, I’ll give you only an approximate scheme of work:
- First, the JVM tries to allocate memory through an interface specific to the current garbage collector. There the same call chain occurs as it was above: first an attempt to allocate from TLAB, then an attempt to allocate TLAB from the heap and the creation of an object.
- In case of failure, garbage collection is called. There is also a GC error overhead limit exceeded, various GC notifications, logs and other checks that are not related to allocation.
- If garbage collection did not help, then an allocation attempt is made directly to Old Generation (here the behavior depends on the selected GC algorithm), and in case of failure another assembly occurs and an attempt to create an object, and if it did not work here, then in the end it rushes
OutOfMemoryError. - When the object has been successfully created, it is checked whether it is an hour finalizable and if so, it is registered, which consists in calling the
Finalizer#registermethod (you, too, always wondered why this class is in the standard library, but never by anyone not used explicitly?). The method itself was clearly written a long time ago: the Finalizer object is created and under the global (sic!) Lock it is added to the linked list (with the help of which the objects will then be finalized and assembled). This fully justifies the unconditional challenge in the JVM and (in part) the advice "do not use the finalize method, even if you really want to."
As a result, we now know almost everything about allocation: objects are allocated quickly, TLABs are filled quickly, objects in some cases are allocated immediately in eden, and in some cases they go through unhurried calls in the JVM.
Monitoring slow allocations
How the memory is allocated, we found out, but what to do with this information is not yet.
Somewhere above, I wrote that all statistics (slow allocations, the average number of refills, the number of allocating flows, the loss to internal fragmentation) are recorded somewhere.
 - — perf data, hsperfdata, jcmd
 sun.jvmstat.monitor API.
, Oracle JDK, JFR ( API, OpenJDK), -.
Is this important? , Twitter JVM team, , .
Prefetch
, - prefetch', .
Prefetch — , , , , ( ) , . Prefetch , , , , (, ) , , .
prefetch C2- , C1. : TLAB , , . Java- , : , .

prefetch' , AllocatePrefetchStyle : prefetch , , , . AllocatePrefetchInstr , prefetch : L1- (, - ), L3 : , .ad .
, JVM-, SPECjbb- Java - , ( , , , ).
, , . C1-, ARM — , .
C1_MacroAssembler::initialize_object :. — mark word ,
, identity hashcode ( biased locking) , klass pointer, — , metaspace,java.lang.Class.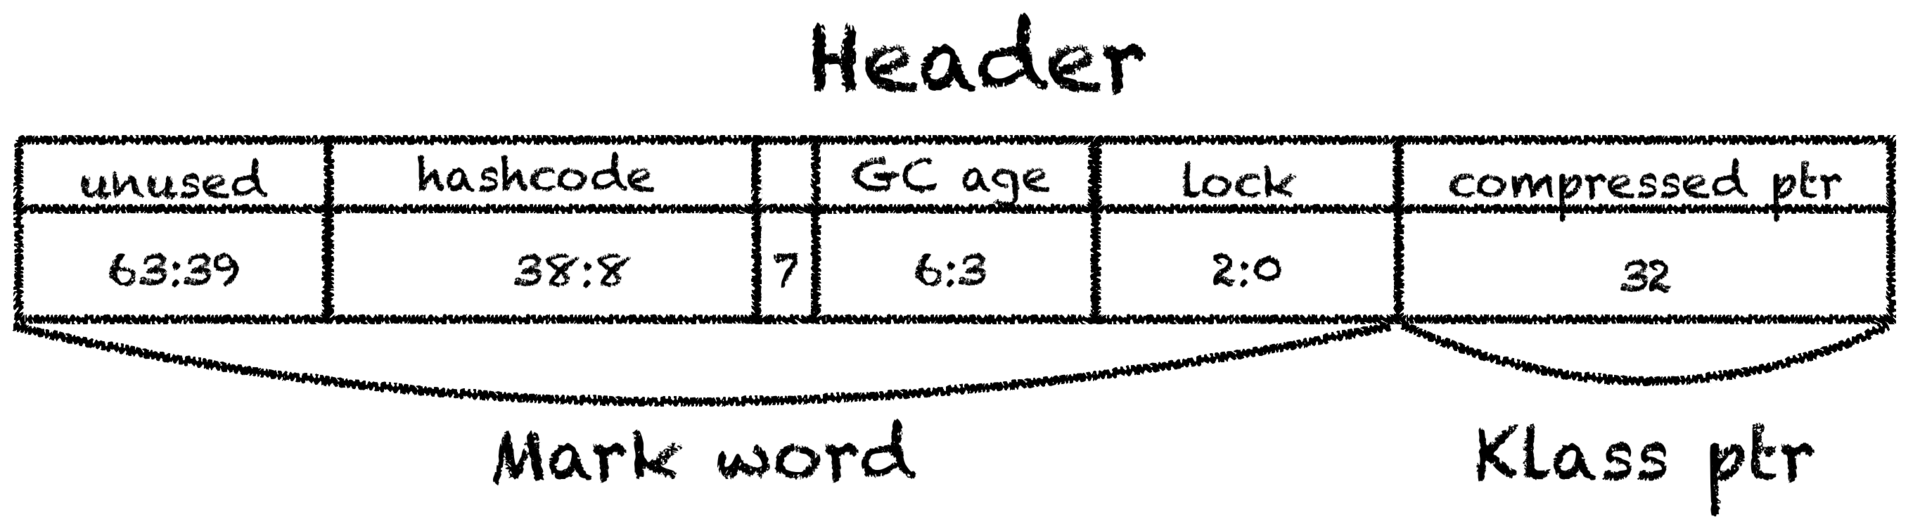
32 64. , 12 ( , 16).
,
ZeroTLAB. :
, , . C2- , . .- StoreStore ( gvsmirnov ), (, ) , .
// StoreStore barrier required after complete initialization // (headers + content zeroing), before the object may escape. membar(MacroAssembler::StoreStore, tmp1);: , - , ( ) , , , (out of thin air) , . x86 , , ARM.
Beware of bugs in the above code; I have only proved it correct, not tried it.
: , , , , .
PrintAssembly new Long(1023) :
0x0000000105eb7b3e: mov 0x60(%r15),%rax 0x0000000105eb7b42: mov %rax,%r10 0x0000000105eb7b45: add $0x18,%r10 ; 24 : 8 , ; 4 , ; 4 , ; 8 long 0x0000000105eb7b49: cmp 0x70(%r15),%r10 0x0000000105eb7b4d: jae 0x0000000105eb7bb5 0x0000000105eb7b4f: mov %r10,0x60(%r15) 0x0000000105eb7b53: prefetchnta 0xc0(%r10) ; prefetch 0x0000000105eb7b5b: movq $0x1,(%rax) ; 0x0000000105eb7b62: movl $0xf80022ab,0x8(%rax) ; Long 0x0000000105eb7b69: mov %r12d,0xc(%rax) 0x0000000105eb7b6d: movq $0x3ff,0x10(%rax) ; 1023 , , .
, :
- TLAB'.
- TLAB' , eden' TLAB, eden', .
- eden' , .
- , .
- , OOM.
- .
: , prefetch TLAB' -.
, , . , java.lang.Object , JVM.
Java 1.8.0_121, Debian 3.16, Intel Xeon X5675. — , — .

:
- , ,
new. , : - (,Blackhole#consumeCPU), , . - prefetch . JVM , -, . , .
- TLAB' : — JIT -> JVM, , .
finalize , eden' finalizable-:

!
Conclusion
JVM , , TLAB' — , . TLAB' : , .
? , , [] .
apangin gvsmirnov , , , , .
')
Source: https://habr.com/ru/post/332708/
All Articles