Automation IP-network. Part 2 - Monitoring the speed of opening Web pages
 We continue a series of articles on affordable automation in the IP network. Each of the engineers working with the Internet, in one way or another, periodically has the need to measure the speed of loading of the web page. There are many tools for this, one of them is the wget utility. For example, to measure the download speed, you can use the following command from the console (Unix / Linux):
[root@localhost ~]# wget -E -H -p -Q300K --user-agent=Mozilla --no-cache --no-cookies --delete-after --timeout=15 --tries=2 habrahabr.ru 2>&1 | grep Downloaded Downloaded: 7 files, 411K in 0.3s (1.22 MB/s) It should be noted that the Q300K restriction is sufficient to understand the download speed, especially if the network delay to the site is more than 10 ms. However, the speed results will not be obvious if the amount of downloaded information is less than 100K.
But what if there is a need to track the resource loading speed on an ongoing basis? You can try to solve the issue with a small script, monitoring system (able to run scripts) and waterproofing tape.
To write the script, take Python3, as an example, take Cacti 0.8.8h.
The script will look like this:
')
Python code
#!/usr/bin/env python # -*- coding: utf-8 -*- import datetime import re import os import subprocess import argparse parser = argparse.ArgumentParser() parser.add_argument("-h_page", "--hostname_page", dest = "hostname_page") args = parser.parse_args() curent_time=str(datetime.datetime.now().strftime("%Y-%m-%d_%H:%M:%S_")) pid=os.getpid() fweb=open('/usr/TEST_Script/TMP_FILES/web_temp'+curent_time+str(pid)+'.txt', 'w') web=subprocess.call(["timeout 120 wget -E -H -p -Q300K --user-agent=Mozilla --no-cache --no-cookies --delete-after --timeout=15 --tries=2 "+args.hostname_page+" 2>&1 | grep '\([0-9.]\+ [KM]B/s\)'"], bufsize=0, shell=True, stdout=(fweb)) fweb.close() fweb=open('/usr/TEST_Script/TMP_FILES/web_temp'+curent_time+str(pid)+'.txt', 'r') data=fweb.read() os.remove('/usr/TEST_Script/TMP_FILES/web_temp'+curent_time+str(pid)+'.txt') speed_temp=re.findall(r's \((.*?)B/s', str(data)) speed_temp_si=re.findall(r's \((.*?) [KM]B/s', str(data)) try: if re.findall(r'M', str(speed_temp))==[] and re.findall(r'K', str(speed_temp))==[]: speed_="{0:.3f}".format(float(speed_temp_si[0])*0.001*8) elif re.findall(r'M', str(speed_temp))!=[]: speed_="{0:.3f}".format(float(speed_temp_si[0])*1000*8) elif re.findall(r'K', str(speed_temp))!=[]: speed_="{0:.3f}".format(float(speed_temp_si[0])*1*8) except: speed_='no_data' print ('web_speed_test:'+speed_) To test it, you can run it from the console:
[root@localhost ~]# python3.3 /usr/TEST_Script/web_open.py -h_page habrahabr.ru web_speed_test:10160.000 Now you need to perform standard manipulations in Cacti to run scripts, they are well documented on the Cacti website, you can also use the hint below.
Cacti comics
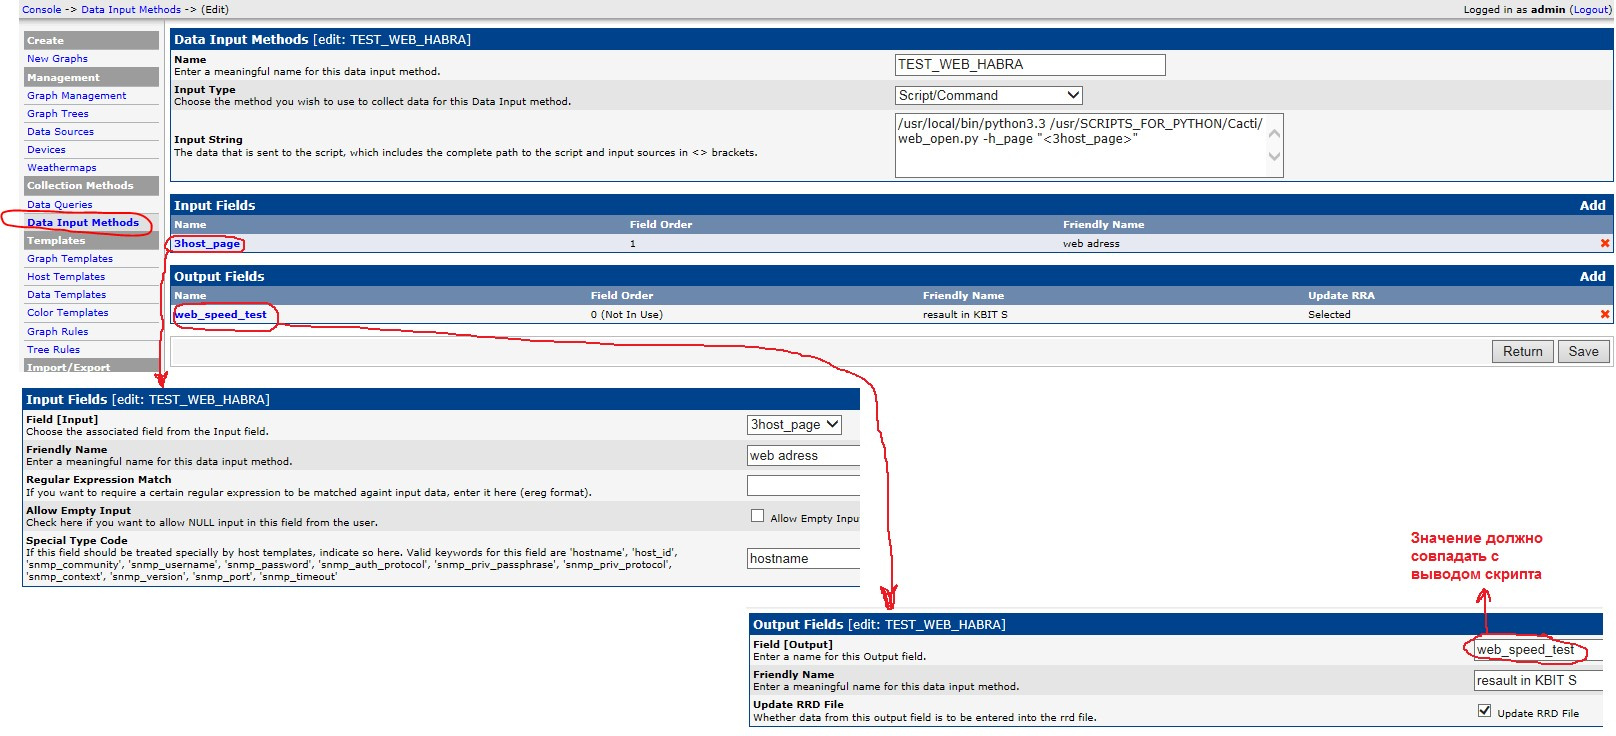
1. Console -> Data Input Methods
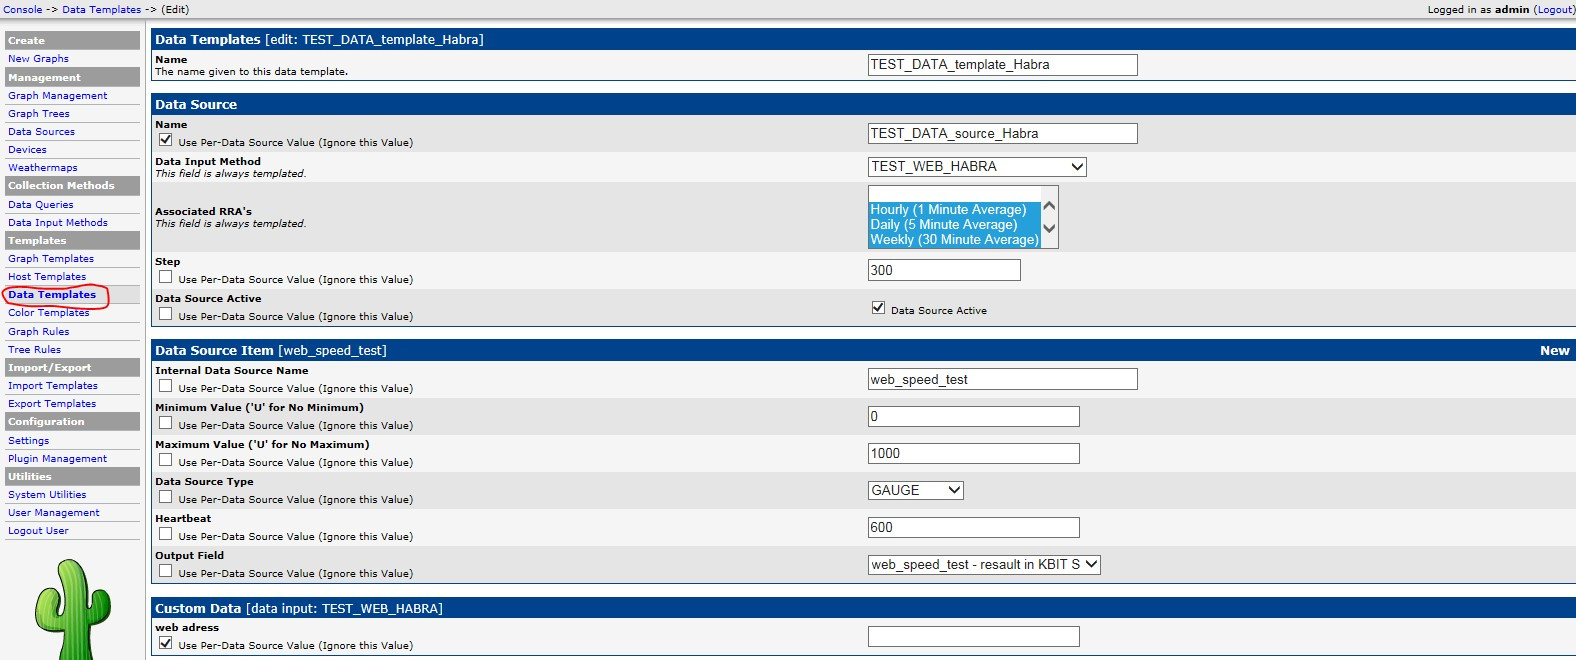
2. Console -> Data Templates
3. Console -> Graph Templates

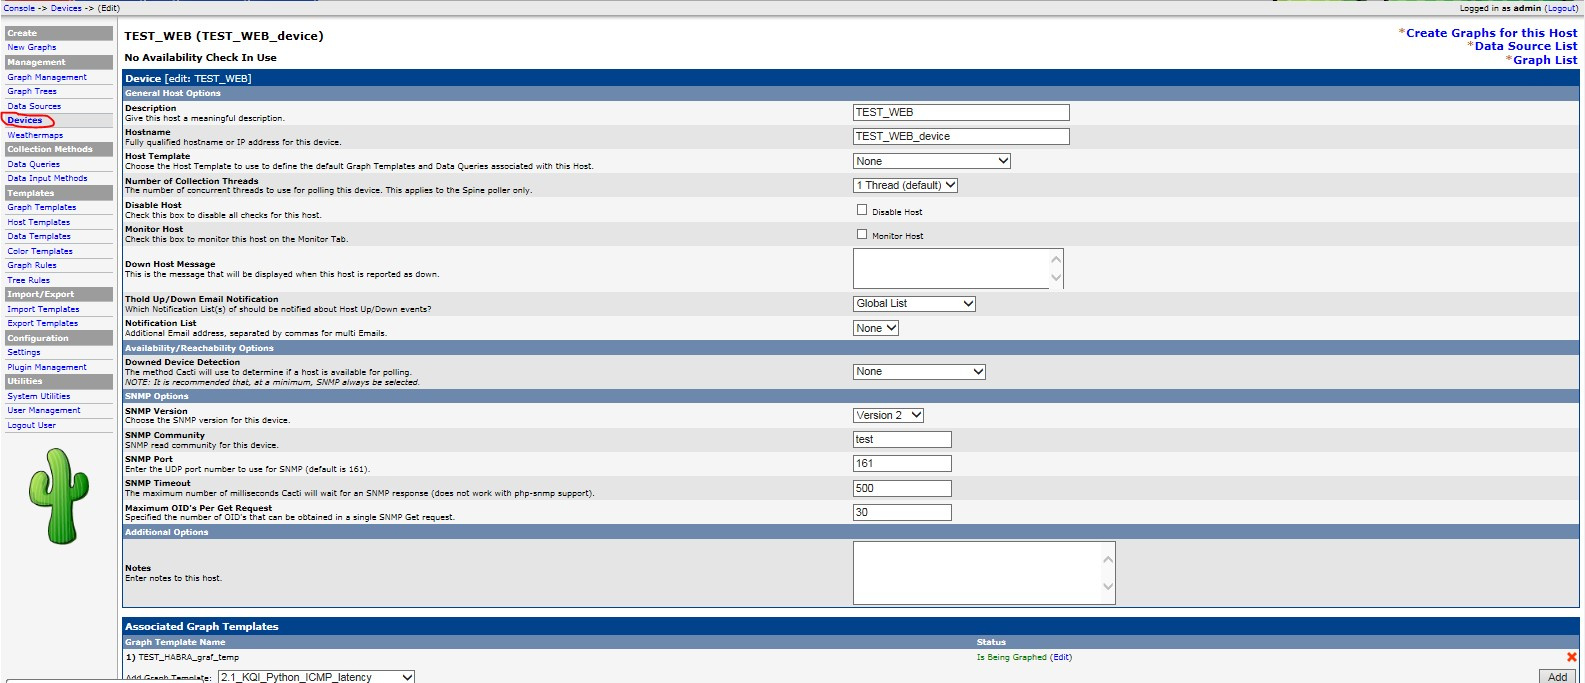
4. Console -> Devices
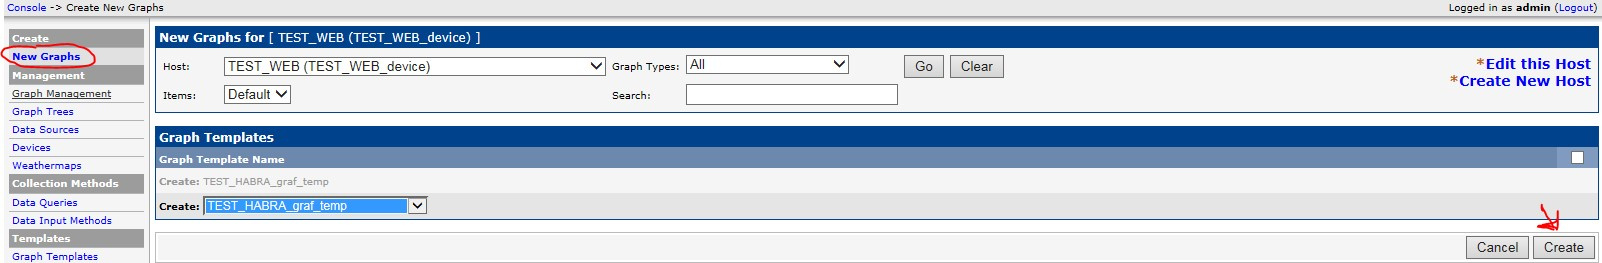
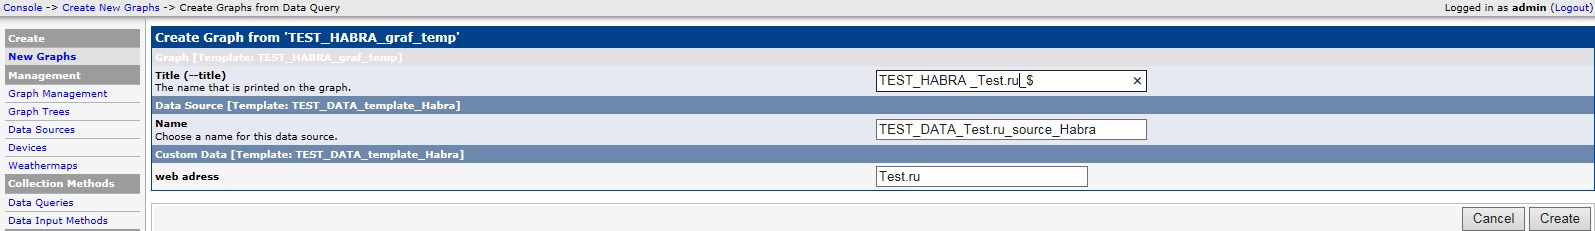
5. Console -> Create New Graphs
2. Console -> Data Templates
3. Console -> Graph Templates
4. Console -> Devices
5. Console -> Create New Graphs
If done correctly, you should end up with similar graphics:

The thin line is the measured data, have a sawtooth view. the measurement in this case takes place simultaneously and is displayed on the graph, while when loading for example network interfaces we see the average speed value for the measured period (usually 5 minutes by default). The thick line is a trend line that helps approximate the visualization. On the presented graph, the actual measured values for one of the Web sites. A drawdown in the center, technical problems confirmed by the site administrator, and further partial restoration.
You found this article useful for you, then perhaps in this section you will also be interested in the following non-standard monitoring features:
- Monitoring TCP retransmission when measuring the download speed of the site.
- Monitoring ICMP RTD from any router on your Internet network (Juniper, Huawei, Cisco) to Web resources.
- Monitoring RTD latency to sites with closed ICMP protocol.
Write in the comments if you need to continue. Thank you for your time.
Source: https://habr.com/ru/post/332690/
All Articles