Using LibVirt API, InfluxDB and Grafana to collect and visualize VM execution statistics
In my practice, I devote a lot of time to designing and administering cloud infrastructures for various purposes. This is mainly Apache CloudStack. This system has excellent capabilities, but in terms of monitoring, there is clearly not enough functionality (read - no), especially if monitoring is viewed more broadly than monitoring an individual observation object (server, virtual machine).
In general, in connection with broader requirements for visual information analysis systems and requirements for integration with data sources, specialized solutions for ad-hoc data analysis, such as Kibana, Grafana, and others, have been distributed. These systems can be integrated with specialized data time series repositories, one of which is InfluxDB . The article will tell about a ready-made solution distributed as a Docker image using the LibVirt API, Grafana and InfluxDB, designed to collect and analyze parameters of running VMs for the KVM hypervisor.
Solution Overview
The solution is presented in the form of a Docker container distributed under the Apache License v2, so it can be applied without restrictions in any organization and can be modified to reflect the needs of a specific task. The container is hosted on a dedicated server, the python data collection utility remotely connects via TCP to LibVirt and sends data to InfluxDB, from where they can be requested using Grafana for visualization and analysis.
The container is available as source code on GitHub and as an installable image on DockerHub . The implementation language is python.
Why Docker Container
This solution is final and convenient for implementation, and also does not require any additional configuration and installation of additional software on virtualization servers, except allowing access to the LibVirt API over the network. If access to the LibVirt API from outside is not possible, then it is possible to install Docker on the virtualization host and launch the container locally.
As part of the solutions that I use in my practice, there is always a secure network, access to which is restricted for unauthorized users, respectively, I do not restrict access to LibVirt with a password, and the presented container does not support authentication. In the event that such a function is required, it can simply be added.
What data is collected
The sensor collects the following data about virtual machines available through LibVirt:
CPU:
{ "fields": { "cpuTime": 1070.75, "cpus": 4 }, "measurement": "cpuTime", "tags": { "vmHost": "qemu+tcp://root@10.252.1.33:16509/system", "vmId": "i-376-1733-VM", "vmUuid": "12805898-0fda-4fa6-9f18-fac64f673679" } } RAM:
{ "fields": { "maxmem": 4194304, "mem": 4194304, "rss": 1443428 }, "measurement": "rss", "tags": { "vmHost": "qemu+tcp://root@10.252.1.33:16509/system", "vmId": "i-376-1733-VM", "vmUuid": "12805898-0fda-4fa6-9f18-fac64f673679" } } Statistics for each network adapter with a MAC address:
{ "fields": { "readBytes": 111991494, "readDrops": 0, "readErrors": 0, "readPackets": 1453303, "writeBytes": 3067403974, "writeDrops": 0, "writeErrors": 0, "writePackets": 588124 }, "measurement": "networkInterface", "tags": { "mac": "06:f2:64:00:01:54", "vmHost": "qemu+tcp://root@10.252.1.33:16509/system", "vmId": "i-376-1733-VM", "vmUuid": "12805898-0fda-4fa6-9f18-fac64f673679" } } Statistics for each disk:
{ "fields": { "allocatedSpace": 890, "ioErrors": -1, "onDiskSpace": 890, "readBytes": 264512607744, "readIOPS": 16538654, "totalSpace": 1000, "writeBytes": 930057794560, "writeIOPS": 30476842 }, "measurement": "disk", "tags": { "image": "cc8121ef-2029-4f4f-826e-7c4f2c8a5563", "pool": "b13cb3c0-c84d-334c-9fc3-4826ae58d984", "vmHost": "qemu+tcp://root@10.252.1.33:16509/system", "vmId": "i-376-1733-VM", "vmUuid": "12805898-0fda-4fa6-9f18-fac64f673679" } } General statistics on the virtualization host, as LibVirt "sees" it:
{ "fields": { "freeMem": 80558, "idle": 120492574, "iowait": 39380, "kernel": 1198652, "totalMem": 128850, "user": 6416940 }, "measurement": "nodeInfo", "tags": { "vmHost": "qemu+tcp://root@10.252.1.33:16509/system" } } LibVirt setup
In the configuration file /etc/libvirt/libvirtd.conf you need to install:
listen_tls = 0 listen_tcp = 1 tcp_port = "16509" auth_tcp = "none" mdns_adv = 0 Attention ! The above settings will allow you to connect to the LibVirt API via TCP, configure the firewall correctly to limit access.
After completing these settings, LibVirt must be restarted.
sudo service libvirt-bin restart InfluxDB
Installation (for Ubuntu)
InfluxDB is installed according to the documentation , for example, for Ubuntu:
curl -sL https://repos.influxdata.com/influxdb.key | sudo apt-key add - source /etc/lsb-release echo "deb https://repos.influxdata.com/${DISTRIB_ID,,} ${DISTRIB_CODENAME} stable" | sudo tee /etc/apt/sources.list.d/influxdb.list sudo apt-get update && sudo apt-get install influxdb sudo service influxdb start Authentication Setting
Run the influx command to open a session to the DBMS:
$ influx Create an administrator (we will need it when we activate authentication):
CREATE USER admin WITH PASSWORD '<password>' WITH ALL PRIVILEGES Create a database pulsedb and regular pulse user with access to this database:
CREATE DATABASE pulsedb CREATE USER pulse WITH PASSWORD '<password>' GRANT ALL ON pulsedb TO pulse Enable authentication in the /etc/influxdb/influxdb.conf configuration file:
auth-enabled = true Restart InfluxDB:
service influxdb restart If everything is done correctly, now when opening a session you need to specify a username and password:
influx -username pulse -password secret Running a container to start collecting data
docker pull bwsw/cs-pulse-sensor docker run --restart=always -d --name 10.252.1.11 \ -e PAUSE=10 \ -e INFLUX_HOST=influx \ -e INFLUX_PORT=8086 \ -e INFLUX_DB=pulsedb \ -e INFLUX_USER=pulse \ -e INFLUX_PASSWORD=secret \ -e GATHER_HOST_STATS=true -e DEBUG=true \ -e KVM_HOST=qemu+tcp://root@10.252.1.11:16509/system \ bwsw/cs-pulse-sensor Most of the parameters are self-evident, I will explain only two:
- PAUSE - the interval between the request values in seconds;
- GATHER_HOST_STATS - determines whether or not to collect additional statistics on the host;
After that, the container log with the help of the docker logs command should reflect the activity and should not reflect errors.
If you open a session to InfluxDB, then in the console you can execute a command and make sure that the measurement data is available:
influx -database pulsedb -username admin -password secret > select * from cpuTime limit 1 name: cpuTime time cpuTime cpus vmHost vmId vmUuid ---- ------- ---- ------ ---- ------ 1498262401173035067 1614.06 4 qemu+tcp://root@10.252.1.30:16509/system i-332-2954-VM 9c002f94-8d24-437e-8af3-a041523b916a This concludes the main part of the article, then we will see how you can work with persistent time series using Grafana.
Install and configure Grafana (Ubuntu)
Install as described in the documentation.
wget https://s3-us-west-2.amazonaws.com/grafana-releases/release/grafana_4.4.1_amd64.deb sudo apt-get install -y adduser libfontconfig sudo dpkg -i grafana_4.4.1_amd64.deb sudo service grafana-server start sudo update-rc.d grafana-server defaults Launch the web browser and open the Grafana administrative interface http ://influx.host.com.000000/.
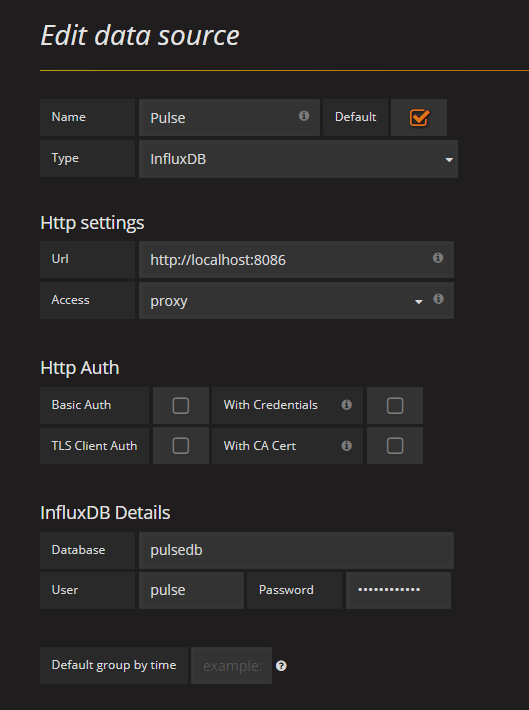
Adding a data source to Grafana
Detailed instructions for adding a data source on the project website. In our case, the added data source might look like this:
After saving the data source, you can create "deshbordy" and try to create queries for graphs (since this instruction is not about how to use Grafana, then I give only expressions for queries):
CPU load (minutes):
select NON_NEGATIVE_DERIVATIVE(MAX("cpuTime"), 1m) / LAST("cpus") / 60 * 100 from "cpuTime" where "vmUuid" = '6da0cdc9-d8ff-4b43-802c-0be01c6e0099' and $timeFilter group by time(1m) CPU load (five minutes):
select NON_NEGATIVE_DERIVATIVE(MAX("cpuTime"), 5m) / LAST("cpus") / 300 * 100 from "cpuTime" where "vmUuid" = '6da0cdc9-d8ff-4b43-802c-0be01c6e0099' and $timeFilter group by time(5m) CPU load (all VMs):
select NON_NEGATIVE_DERIVATIVE(MAX("cpuTime"),1m) / LAST("cpus") / 60 * 100 as CPU from "cpuTime" WHERE $timeFilter group by time(1m), vmUuid 
VM memory (five minute aggregation):
SELECT MAX("rss") FROM "rss" WHERE "vmUuid" = '6da0cdc9-d8ff-4b43-802c-0be01c6e0099' and $timeFilter GROUP BY time(5m) fill(null) ReadBytes, WriteBytes for disk statistics (five-minute aggregation):
select NON_NEGATIVE_DERIVATIVE(MAX("readBytes"),5m) / 300 from "disk" where "image" = '999a1942-3e14-4d04-8123-391494a28198' and $timeFilter group by time(5m) select NON_NEGATIVE_DERIVATIVE(MAX("writeBytes"),5m) / 300 from "disk" where "image" = '999a1942-3e14-4d04-8123-391494a28198' and $timeFilter group by time(5m) ReadBits, WriteBits statistics for NIC (five-minute aggregation):
select NON_NEGATIVE_DERIVATIVE(MAX("readBytes"), 5m) / 300 * 8 from "networkInterface" where "mac" = '06:07:70:00:01:10' and $timeFilter group by time(5m) select NON_NEGATIVE_DERIVATIVE(MAX("writeBytes"), 5m) / 300 * 8 from "networkInterface" where "mac" ='06:07:70:00:01:10' and $timeFilter group by time(5m) All the power of the query language InfluxDB at your service, and you can build such deshboards that meet your needs and allow you to make a visual analysis of the data. For example, one of the most useful cases for me is the analysis of incidents, it happens that a client complains that "your code is **** o" © and says that his VM worked wonderfully, and then everything. We build the expression, look at the picture, we see how the CPU of its VM for an hour left at the peak and left. Screenshot is a great argument for resolving a conflict.
You can also analyze the most intensively using various resources of the VM, in order to migrate them to individual hosts. Yes, whatever. In this sense, Grafana, Kibana and similar systems compare favorably with traditional monitoring systems (for example, Zabbix) in that they allow you to do on-demand analysis and build complex analytical sets, and InfluxDB helps to ensure high performance analysis even on a large data set.
Conclusion
The code that receives data from LibVirt has been tested with VMs that use volumes in QCOW2 format. I tried to take into account the options LVM2 and RBD, but not tested. If someone succeeds in testing the code on other versions of the VM volumes and sending corrections for the code, I would be grateful.
PS: When monitoring VM network traffic, you may find that the PPS data is much less than what you receive via Sflow / Netflow on the router or tcpdump in the VM. This is a well-known feature of KVM, the network subsystem of which does not adhere to the standard MTU of 1500 bytes.
PPS: LibVirt API documentation for python is terrible and I had to wade through different versions to still find out how the data is returned and what they mean.
PPS2: If anything, as they say on Gazorpazorp, "I'm there, if you need to talk" ©
')
Source: https://habr.com/ru/post/332652/
All Articles