Go Developer Tools: Meet Profiler Labels
 Hey. My name is Marco. I am a system programmer at Badoo. I present to you the translation of the post of a wonderful rakyll about a new feature in Go 1.9. It seems to me that labels will be very useful for profiling your Go programs. We at Badoo, for example, use the same thing to tag code snippets in our C programs. And if the timer is triggered and the stack trace is outputted to the log, then in addition to it we output such a tag. In it, for example, it can be said that we processed photos of the user with a specific UID. This is incredibly useful, and I am very glad that a similar opportunity has appeared in Go.
Go 1.9 has new profiler labels : the ability to add a key-value pair to the samples made by the CPU profiler. Profiler collects and displays information about the hottest features where the processor spends the most time. The output of a regular CPU profiler consists of the function name, the source file name and the line number in the file, and so on. From this data, you can also understand which parts of the code caused these hot functions. You can even filter the output to get a deeper insight into one or another branch of the performance.
Information about the complete call stack is very useful, but it is not always enough to look for a performance problem. A large number of Go programmers use Go to write servers, and it is even more difficult to understand where the performance problem is in the server. It is difficult to separate some branches of execution from others or it is difficult to understand when only one branch of execution causes problems (some user or a certain handler). Starting with Go 1.9, we had the opportunity to add additional information about the context of what is happening at the moment, and to use this information in the future to get more isolated data.
Labels can be useful in many cases. Here are just the most obvious ones:
- you don't want abstractions from your program to flow into the profiling process, but data about your objects would be useful there. For example, it would be much more useful for a web server to see the URL in the profiler instead of the bare function names.
- The stack-trace is not enough to understand who initiated the work. For example, the queue handler handles events that were created by someone earlier. The handler could mark his work with the name of this someone.
- To look for performance problems, it is critical to have a processing context.
Adding labels
The runtime/pprof will have several new features for adding labels. Most users will use the Do function, which takes a context, adds labels to it, and passes a new context to the f function:
func Do(ctx context.Context, labels LabelSet, f func(context.Context)) Do writes a set of labels only within the current gorutiny. If you create new gortines in f, you can pass a context as an argument.
labels := pprof.Labels("worker", "purge") pprof.Do(ctx, labels, func(ctx context.Context) { // - ... go update(ctx) // }) The work above will be labeled worker:purge .
We look at the output profiler
This section will demonstrate the use of a profiler with labels. After you have marked all the pieces of code that interest you with labels, it's time to profile the code and look at the profiler output.
I will use the net/http/pprof in this example. See the Profiling Go programs article for details.
package main import _ "net/http/pprof" func main() { // ... log.Fatal(http.ListenAndServe("localhost:5555", nil)) } We collect data on the use of CPU ...
$ go tool pprof http://localhost:5555/debug/pprof/profile After the utility goes online, you can view all recorded labels with the tags command. Notice that the pprof-utility names them tags, despite the fact that they are called labels in the standard Go library.
(pprof) tags http-path: Total 80 70 (87.50%): /messages 10 (12.50%): /user worker: Total 158 158 ( 100%): purge As you can see, there are two keys ( http-path , worker ) and several values for each. The http-path key points to HTTP handlers, and worker: purge points to the code from the example above.
Filtering by label, we can focus, for example, only on the code from the handler /user .
(pprof) tagfocus="http-path:/user" (pprof) top10 -cum Showing nodes accounting for 0.10s, 3.05% of 3.28s total flat flat% sum% cum cum% 0 0% 0% 0.10s 3.05% main.generateID.func1 /Users/jbd/src/hello/main.go 0.01s 0.3% 0.3% 0.08s 2.44% runtime.concatstring2 /Users/jbd/go/src/runtime/string.go 0.06s 1.83% 2.13% 0.07s 2.13% runtime.concatstrings /Users/jbd/go/src/runtime/string.go 0.01s 0.3% 2.44% 0.02s 0.61% runtime.mallocgc /Users/jbd/go/src/runtime/malloc.go 0 0% 2.44% 0.02s 0.61% runtime.slicebytetostring /Users/jbd/go/src/runtime/string.go 0 0% 2.44% 0.02s 0.61% strconv.FormatInt /Users/jbd/go/src/strconv/itoa.go 0 0% 2.44% 0.02s 0.61% strconv.Itoa /Users/jbd/go/src/strconv/itoa.go 0 0% 2.44% 0.02s 0.61% strconv.formatBits /Users/jbd/go/src/strconv/itoa.go 0.01s 0.3% 2.74% 0.01s 0.3% runtime.memmove /Users/jbd/go/src/runtime/memmove_amd64.s 0.01s 0.3% 3.05% 0.01s 0.3% runtime.nextFreeFast /Users/jbd/go/src/runtime/malloc.go This output contains only samples marked with the http-path:/user label. And in this conclusion, we can easily understand where the most loaded places are / user-handlers.
You can also try the tagshow , taghide and tagignore for additional filtering. For example, tagignore gives you the opportunity to get data on all labels except the specified one. The filter below will return everything except the / user handler. In this case, this is worker:purge and http-path:/messages .
(pprof) tagfocus= (pprof) tagignore="http-path:/user" (pprof) tags http-path: Total 70 70 ( 100%): /messages worker: Total 158 158 ( 100%): purge If you try to visualize the filtered data, the output will show how much each label adds to the total “cost”.
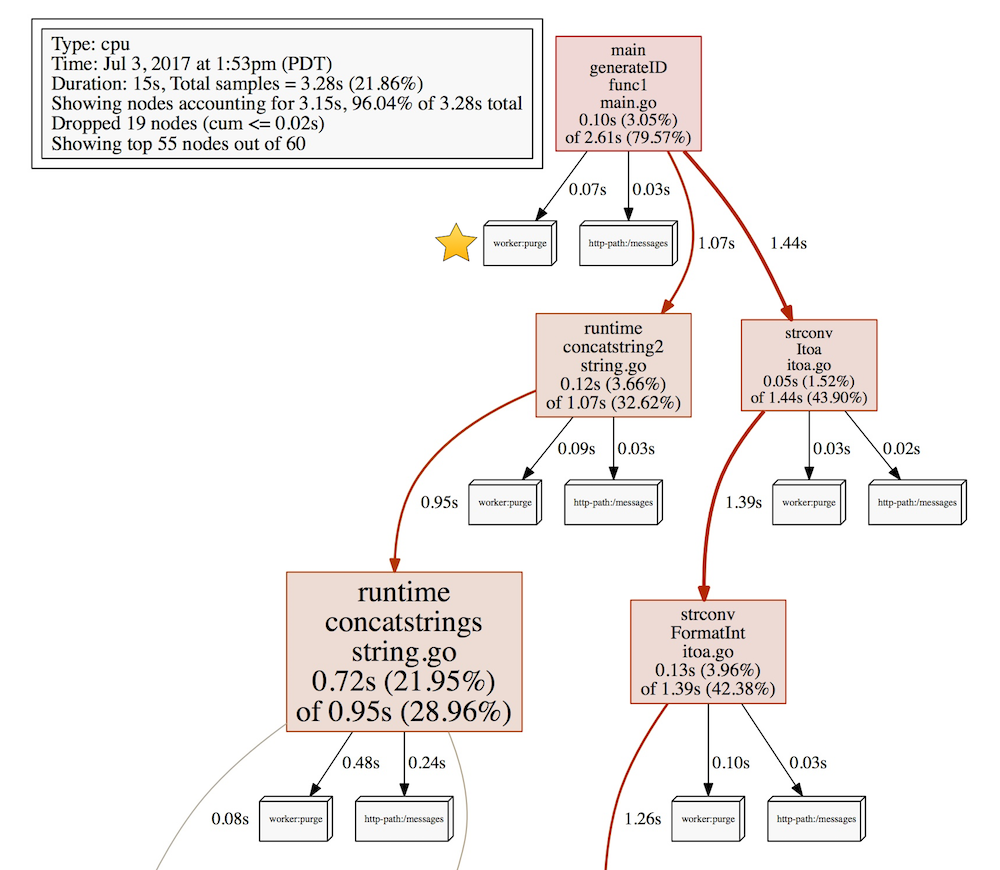
Here you can see that worker:purge introduced 0.07s, and the handler of messages 0.03s in the generateID function.
Try it yourself!
Labels allow you to add additional information to a profiler that is not available from a simple call stack. If you need additional dimensions in your profiler, then you can try it now by downloading the Go 1.9 beta beta version. Also try the pprofutil package to automatically wrap your HTTP paths with labels.
Go version 1.9 beta 2 is currently available. There are no known bugs in it, but the development team asks to try it on its programs, and in case of problems, report it to the bug tracker. I want to say that to collect Go and be on the cutting edge of development is very, very simple. The very same assembly takes no more than a minute. Dare!
')
Source: https://habr.com/ru/post/332636/
All Articles