The choice of algorithm for calculating quantiles for a distributed system

Hello! My name is Alexander, I lead the Data Team in Badoo. Today I will tell you how we chose the optimal algorithm for calculating quantiles in our distributed event processing system.
Earlier we talked about how our UDS (Unified Data Stream) event handling system is arranged. In short, we have a stream of heterogeneous events on which we need to aggregate data in various sections in a sliding window. Each type of event is characterized by its own set of aggregate functions and measurements.
During the development of the system, we needed to implement support for the aggregate function for quantiles. You can learn more about what percentiles are and why they better represent the behavior of a metric than min / avg / max, in our post about using Pinba in Badoo . We could probably take the same implementation that Pinba uses, but the following features of UDS should be taken into account:
- The calculations are spread over the Hadoop cluster.
- System design involves grouping by an arbitrary set of attributes. This means that the number of metrics of the "percentile" type is in the millions.
- Since calculations are performed using Map / Reduce, all intermediate calculations of aggregate functions must have the property of additivity (we must be able to “merge” them from different nodes that perform calculations independently).
- Pinba and UDS have different implementation languages - C and Java, respectively.
Criteria for evaluation
Based on these architectural features, we have put forward a number of parameters by which we will evaluate quantile calculation algorithms:
Calculation accuracy
We decided that we would be satisfied with the accuracy of calculations up to 1.5%.
lead time
It is important for us to minimize the time period from the occurrence of the event to the visualization of its quantiles on the graphs. This factor is made up of three others:
- “Mathematics” time (Map stage) - overhead for initializing data structures and adding data to them;
- serialization time - in order to merge two data structures, they must be serialized and transmitted over the network.
- merge time (stage Reduce) - the overhead of merging the two data structures calculated independently.
Memory
Millions of metrics are processed in our system, and it is important for us to monitor the rational use of computational resources. By memory, we mean the following:
- RAM is the volume occupied by quantile data structures.
- Shuffle - since the calculation is performed using Map / Reduce, the exchange of intermediate results between the nodes is inevitable. In order for this to be possible, the data structure must be serialized and written to disk / network.
We also set the following conditions:
Data types
The algorithm must support calculations for nonnegative values represented by double type.
Programming language
There must be Java implementation without using JNI.
Study participants

Naive
In order to have some reference for comparison, we wrote an implementation "in the forehead", which stores all incoming values in double[] . If it is necessary to calculate a quantile, the array is sorted, the cell corresponding to the quantile is calculated, and its value is taken. The merging of two intermediate results occurs by concatenating two arrays.
Twitter algebird
This solution was found by us during consideration of the algorithms ground under Spark (used in the basis of UDS). The Twitter library Algebird is designed to extend the algebraic operations available in the Scala language. It contains a number of widely used functions ApproximateDistinct , CountMinSketch and, among other things, the implementation of percentiles based on the Q-Digest algorithm. Mathematical justification of the algorithm can be found here . In brief, the structure is a binary tree in which each node stores some additional attributes.
Ted dunning t-digest
The library is an improvement to the aforementioned Q-Digest algorithm with lower memory consumption, improved performance and higher accuracy.
Airlift Quantile Digest
We stumbled upon this product during reverse engineering of Facebook Presto distributed SQL engine. It was somewhat surprising to see the implementation of quantiles in the REST framework, but the high speed and Presto architecture (similar to Map / Reduce) pushed us to test this solution. Again, Q-Digest is used as a mathematical tool.
High Dynamic Range (HDR) Histogram
This decision was the ideological inspiration for the implementation of percentiles in Pinba. Its distinguishing feature is that it is necessary to know the upper range of data when initializing the structure. The whole range of values is divided into the N-th number of cells, and when added, we increment the value into one of them.
Test procedure

Qualitative assessment
Each of the considered software solutions was wrapped by some layer (model) (in order to adapt it for testing framework). Before conducting performance tests for each model, unit tests were written to test its validity. These tests verify that the model (its underlying software solution) can produce quantiles with a given accuracy (1% and 0.5% accuracy were checked).
Performance Tests
For each model, tests were written using JMH . They were divided into categories, about each of which I will tell in detail. I will not “litter” the post with the raw output from JMH - I'd rather immediately visualize it in the form of graphs.
Raw test
In this test, we measure the performance of data structures by insertion, that is, measurements are made of the time required to initialize the structure and fill it with data. We will also look at how this time changes depending on the accuracy and number of elements. Measurements were made for sequences of monotonically increasing numbers in the ranges of 10, 100, 1000, 10,000, 100,000, 1,000,000 with a calculation error of 0.5% and 1%. The insert was made in a pack (if the structure supports) or elementwise.
As a result, we got the following picture (the logarithmic ordinate scale, smaller values — better):
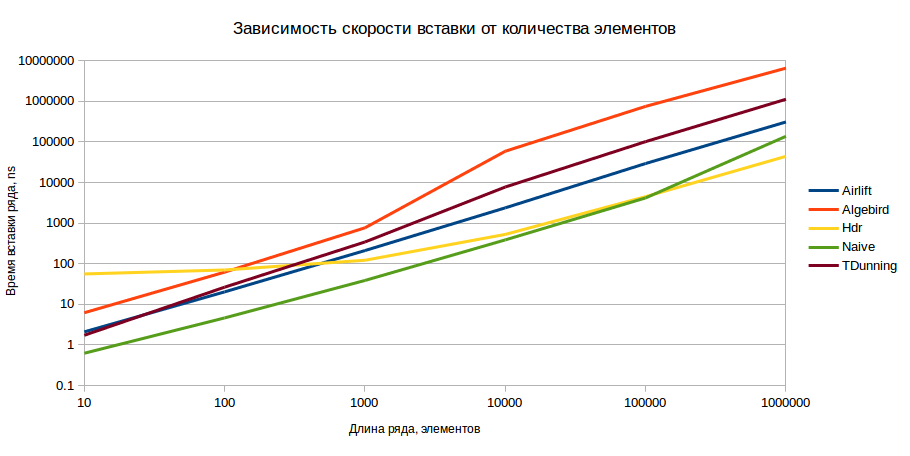
The results are shown for an accuracy of 1%, but for an accuracy of 0.5%, the picture does not fundamentally change. To the naked eye, it is clear that in terms of HDR insertion is the best option, provided that there are more than 1000 elements in the model.
Volume test
In this test, we measure the volume occupied by the models in memory and in serialized form. The model is filled with data sequences, then its size is estimated. It is expected that the best model will be with a smaller amount of memory occupied. Measured using Spark SizeEstimator .

As can be seen, with a small number of elements HDR loses to other implementations, however, it has the best growth rate in the future.
The serialized size estimate was made by serializing the model through Kryo , which is the de facto standard in the field of serialization. For each model, its own serializer was written, which transforms it as quickly and compactly as possible.

The ultimate champion is again HDR.
Map / Reduce Test
This test most fully reflects the behavior of the system in a combat situation. The test procedure is as follows:
- Predefined ten models containing the n-th number of values.
- They are merged (emulation map-side combine).
- The resulting value is serialized and deserialized ten times (emulation of transmission over the network from different workers).
- Deserialized models are merged (emulation of the final reduce-stage).
Test results (lower values are better):
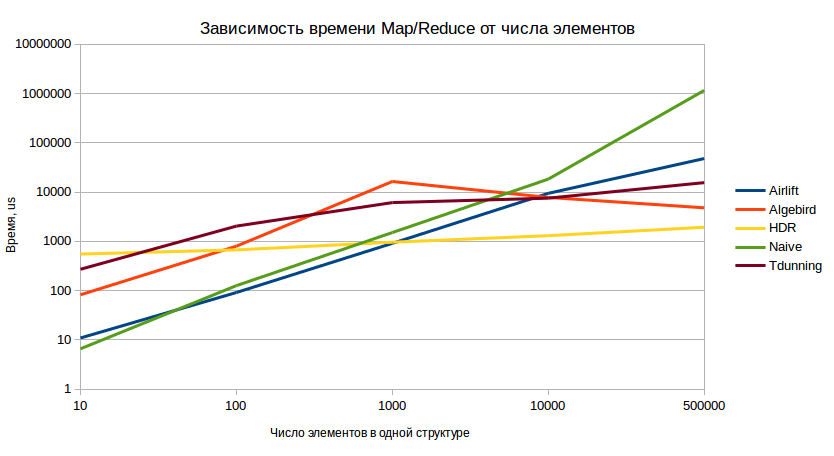
And in this test, we again clearly see the confident dominance of HDR in the long term.
Results analysis
After analyzing the results, we came to the conclusion that HDR is the optimal implementation on a large number of elements, while on models with a small amount of data there are more profitable implementations. The specificity of aggregation in many dimensions is such that one physical event affects several aggregation keys. Imagine that one EPayment event should be grouped by country and gender of the user. In this case, we get four aggregation keys:

Obviously, when processing a stream of events, keys with a smaller number of dimensions will have a greater number of values for percentiles. The usage statistics of our system gives us the following picture:

These statistics allowed us to decide on the need to look at the behavior of metrics with a large number of measurements. As a result, we found that 90 percentile of the number of events per metric (that is, our test model) is within 2000. As we saw earlier, with a similar number of elements, there are models that behave better than HDR. So we have a new model - Combined, which combines the best of two worlds:
- If the model contains less than n elements, the Naive model algorithms are used.
- When the threshold n is exceeded, the HDR model is initialized.
See the results of this new member!


As can be seen from the graphs, the Combined model really behaves better than HDR on a small sample and is compared with it with an increase in the number of elements.
If you are interested in the research code and examples of the API of the considered algorithms, you can find all this on GitHub . And if you know the implementation that we could add to the comparison, write about it in the comments!
')
Source: https://habr.com/ru/post/332568/
All Articles