What if throwing all the excess out of the database into a distributed cache is our experience using Hazelcast

Since Yandex.Money databases are forced to store a lot of secondary and temporary information, once such a solution has ceased to be optimal. Therefore, a distributed Data Grid with Hazelcast-based in-memory database functions appeared in the infrastructure.
In exchange for consistently high performance and fault tolerance, we got a curious implementation experience that doesn’t repeat the documentation. Under the cut, you will find a story about solving Hazelcast problems when working under high loads, dealing with Split Brain , as well as impressions from working with a distributed data warehouse in a large infrastructure.
Why did you need an in-memory database
In Yandex.Money, Hazelcast is used as an in-memory database and, secondarily, as a distributed cache for the Java infrastructure. When making each payment, you need to hold a lot of information somewhere, which is no longer needed after the transaction, and it should be easily accessible. We call such data the context of the user's session and relate to them the source and method of transferring money, the sign of transfer from the card, the way of confirming the transfer, etc.
In addition to a longer response, it was inconvenient to maintain the script and store excess data in backups. Many different payment contexts, other temporary data, the need to support automatic cleaning, the increasing load on the database - all this prompted us to reconsider the approach to storing temporary data.
It was necessary to have separate scalable storage with high access speed. The impetus for the change and the search for a more elegant and fast storage of temporary data was the earlier partial replacement with PostgreSQL .
Among the key requirements for the solution sought were:
Fault tolerance at the level of a single data center (DC), and between the two available.
The minimum memory overhead for data storage (memory overhead) . First of all, the solution will be used as a data storage, therefore it is important to take into account the memory consumption by the storage itself. In our case, we managed to distribute some local application caches according to the cluster memory, which gave us a dozen times gain.
- The cost of scaling . Since the payment service is constantly building up muscles (not always linearly), the new database should be able to do this as cheaply as possible in production and in test or local environments.
If you break down the three criteria described above in more detail, this is what the software you were looking for should be:
High read / write speed compared to a regular database and a small memory overhead for data storage.
Fault tolerance when errors occur on individual nodes.
Replication both inside data centers and between them.
High uptime in work and the possibility of configuration on the fly.
The ability to set a fixed lifetime of objects - TTL.
Distributed storage (sharding) and load balancing on cluster nodes by the client.
Support for cluster status monitoring and the ability to test on a local computer.
Easy setup and maintenance of infrastructure, flexibility.
- Automatic cluster expansion, the ability to limit the amount of cache of a particular type of object.
In addition to all this, it would be great to get in the appendage a distributed locking mechanism, integration with applications, client-side cache, Memcache protocol support, as well as clients for JVM, Java, REST, Node.js.
Most of these requirements are satisfied by the following products:
Redis - does not allow max-idle-seconds for cache entries, perform complex replication and limit the amount of memory for a specific type of object.
Ehcache big memory - has good characteristics, but provides only a paid license.
Gridgain is also good, but replication between the DC and inside the DC is only in the paid version.
Infinispan - everything seems to be good, but rather complicated to set up and does not contain commercial support. What is even sadder is that there is no information on the behavior in production in the network, and this increases our risks.
- Hazelcast meets all requirements and is actively used in production. Moreover, it is on this system that migrate with Redis. Of the minuses, only paid management studio for monitoring, which balances the API for implementing its monitoring system.
Now I’ll tell you more about how everyone set up and what conclusions they made, because the difficulties with Hazelcast were connected just with the “rake” of the configuration.
Cluster about 25 nodes
Since local and geo-redundancy is necessary for the Yandex.Money infrastructure, we have included nodes in two data centers in the Hazelcast cluster, as shown in the figure below.

The diagram shows a Hazelcast cluster distributed between two remote DCs.
In total, it consists of 25 nodes divided into two groups. Hazelcast stores data in a cluster in partitions, distributing these partitions between nodes. Grouping partitions allows Hazelcast to back up partitions between groups. We have combined each cluster of cluster nodes into clusters and obtained a simple and transparent data backup between the DC.
Configuration example:
<?xml version="1.0" encoding="UTF-8"?> <hazelcast xsi:schemaLocation="http://www.hazelcast.com/schema/config hazelcast-config-3.5.xsd" xmlns="http://www.hazelcast.com/schema/config" xmlns:xsi="http://www.w3.org/2001/XMLSchema-instance"> <!-- --> <network> <port auto-increment="false">5701</port> <join> <multicast enabled="false"/> <!-- --> <tcp-ip enabled="true"> <!-- 1 --> <member>192.168.0.0-255</member> <!-- 2 --> <member>192.168.1.0-255</member> </tcp-ip> </join> </network> <!-- --> <partition-group enabled="true" group-type="CUSTOM"> <member-group> <!-- 1 --> <interface>192.168.0.*</interface> </member-group> <member-group> <!-- 2 --> <interface>192.168.1.*</interface> </member-group> </partition-group> <properties> <property name="hazelcast.logging.type">slf4j</property> <!-- --> <property name="hazelcast.health.monitoring.level">NOISY</property> <!-- JMX --> <property name="hazelcast.jmx">true</property> <!-- SEGTERM --> <property name="hazelcast.shutdownhook.enabled">false</property> </properties> </hazelcast> The network block is responsible for setting the addresses of the servers that will form the cluster (in our infrastructure, these are separate ranges for two data centers). Partition-group contains settings for partition groups between which data is backed up. Here is also a binding to two DCs for duplicating data in both.
What if you overload Hazelcast 80 times
After setting up the system and some monitoring it, I can note the high read-write speed, which does not change even with increased loads (data is stored in memory). But, like any other distributed system, Hazelcast is sensitive to bandwidth and network response. Hazelcast is a Java application, which means it requires fine tuning of the garbage collector (Garbage Collector), according to the load profile.
For fine tuning, you usually refer to the documentation, but there’s a clear lack of it. Therefore, we are actively studying the source code and so brought to mind the configuration. In general, the solution turned out to be reliable and coping with its tasks - this was confirmed by the load tests, the 80-fold load of which was not reflected in the Hazelcast metrics.
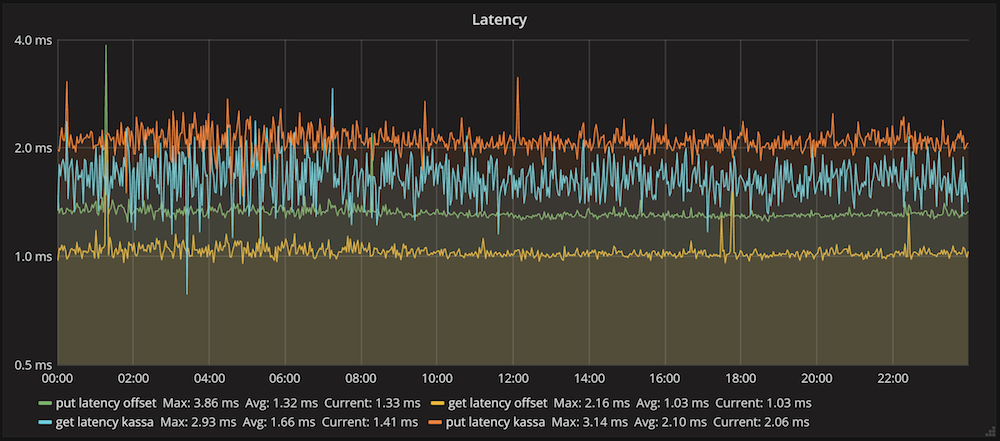
The graph shows the average execution time of insert operations and receiving data in Hazelcast for one of the clients. The average insertion time was 2.1 ms, and the read time was 1.6 ms. These numbers reflect the overall system performance: sending a request, running it in a cluster, networking, and deserializing the response.
But with a general positive background, there are several areas to which particular attention should be paid. For example, we encountered the following problems when using Hazelcast:
The collapse of the cluster and Split Brain, fraught with downtime and violation of SLA.
False triggered data policies that lead to data loss.
Loading data without taking into account the settings of IMap leads to clogging of the storage.
- For a long time, commands are executed when the cluster structure is changed. With a regular restart, the insertion and retrieval commands inhibit the cluster node.
And if there is little documentation for the product, I’ll focus on solutions in more detail.
Cluster collapse and Split Brain
Errors in the network occur constantly, and Hazelcast processes them to eliminate data loss and inconsistency. In our case, each Hazelcast node is launched as part of an application that performs the necessary settings and monitors. This allows Hazelcast to be integrated into the infrastructure, provides more flexibility and provides uniform methods of supplying, monitoring, logging and managing the Yandex.Money infrastructure.
The application runs Spring Boot, which implements its classLoader. In the meantime, the self-written classLoader Spring Boot has one very bad bug. In the event of an abnormal situation, the cluster sends an exception identifier to its nodes to handle the situation. Nodes receive error messages and try to deserialize exception classes. The Spring Boot class loader does not have time to load classes at high load and generates a NoClassDefFoundError error.
Ultimately, the cluster may fall apart, transforming into several smaller independent “clusters”. We have this just happened under load, and in the logs there were only NoClassDefFoundError classes of Hazelcast itself. As a treatment, before launching the application, I had to forcefully unpack the classes of all libraries with the following command:
(springBoot {requiresUnpack = ['com.hazelcast:hazelcast', 'com.hazelcast:hazelcast-client']} ) To prevent this from happening in the future, we simply turned off its package builder in spring boot:
apply plugin: 'spring-boot' bootRepackage { enabled = false } Then when you start the application, you must explicitly unload the entire contents of the .jar at startup:
-Dsun.misc.URLClassPath.disableJarChecking=true \$JAVA_OPTS -cp \$jarfile:$libDirectory/*:. $mainClassName Using the standard Class Loader eliminated class loading errors when the application was running, but required writing code to build the package for installation.
False Data Policy Evict Triggers
In our infrastructure, Hazelcast is used primarily as a data warehouse; IMap is ideally suited for this - the distributed Map <Key, Value> . To protect yourself from memory shortages and OutOfMemory exceptions, each of the IMap instances pre-configured on the Hazelcast side has an upper memory limit, as well as rotation policies for obsolete entries.

Garbage Collector at work.
To correctly remove unnecessary information, we use a bunch of TTL and MaxIDLE () parameters to limit the lifetime of the data in these collections, as well as limiting the size of the stored data on each node.
The collection restriction policies by size (MaxSizePolicy) are several:
PER_NODE: The maximum number of entries for each JVM.
PER_PARTITION: The maximum number of entries for one partition.
USED_HEAP_SIZE: The maximum amount of memory that records of a particular collection can take is the sum of the calculated sizes of each record.
USED_HEAP_PERCENTAGE: The same as USED_HEAP_SIZE, only in percentage.
FREE_HEAP_SIZE: The minimum size of the remaining JVM allocated memory, based on the data of the JVM itself.
- FREE_HEAP_PERCENTAGE: the same as FREE_HEAP_SIZE, only in percent).
Initially used FREE_HEAP_PERCENTAGE, but eventually switched to USED_HEAP_PERCENTAGE. The fact is that these similarly designed policies work in completely different ways:
FREE_HEAP_PERCENTAGE - starts to clear data in collections at Runtime.getRuntime (). FreeMemory () is less than the set limit. Suppose I want to start panicking and deleting data if less than 10% of the memory available to the application is left. Then we get a constant response of this policy under load. And this is normal, because this is how a Java machine works when allocating and freeing memory.
- USED_HEAP_PERCENTAGE - works in a completely different way (and this can be understood only after carefully studying the source code of Hazelcast, it’s good that it is freely available), this policy works on each collection separately, and the calculated cost of the stored data, which is approximately equal to real value. Since this is not JVM readings, but calculated data, the EntryCost change graph does not look like a cardiogram, and the sensor does not work erroneously and the data deletion process does not start.
As for FREE_HEAP_PERCENTAGE, we tried to configure the GC so that the threshold of available memory was never reached, but at best nothing changed. Either there were problems with OldGen and Stop-the-World.
Using USED_HEAP_PERCENTAGE, it was possible to completely get rid of problems with premature evikt data from the collections. One of the features of the work of the evikta is the mechanism for selecting elements for removal (EvictionPolicy: LRU, RANDOM, etc.). We need LRU (Last Recently Used), but, from his point of view, the data just downloaded and the data never requested have the same weight, which needs to be taken into account.
Data download without IMap settings
Programming Hazelcast gives you the freedom to configure it — for example, you can start the cluster node first and then apply the storage settings. You should not do this, because after launching, the node is already included in the sharding mechanism, replication and backup of Hazelcast data. Under the load in these fractions of a second, we can get a certain number of records in collections that have evicts default settings, i.e infinite TTL in our case. Records are immediately replicated and backed up to other nodes.
While the problem manifested itself, enough time passed, and a decent amount of ballast accumulated in the cluster. The settings are not applied to these records, and they themselves will never be deleted, because in Hazelcast, the properties of each record are baked at the time of saving. And finding and deleting all such records is not an entirely trivial task. Conclusion: first we configure the instance, then we start it.
For a long time, commands are executed when the cluster structure is changed.
Hazelcast responds adequately to the shutdown of one node or even half of the entire cluster, because the data is replicated between all participants. But staffing behavior for Hazelcast is not so good for its customers. The client has a wonderful smartRouting setting, which allows it to switch to another node on its own when the connection is lost by default.
It works, but not fast enough, and all requests to add or receive data come to other nodes of the cluster with pre-established connections. Delays in setting up a connection and operations with data under load do not fit into client timeouts (we limited the operation time to 400 ms), and their operations are interrupted. Therefore, it is important to teach the client part to handle such errors and try to repeat the operation.
In turn, it is also not the best idea to carry out operations without an expired timeout, because by default it is 60 seconds - does the client have enough patience? All these problems can be avoided with a regular reboot of the Hazelcast node - it is enough not to use smartRouting on the client, and stop all its clients before stopping the node.
Cluster Monitoring
Hazelcast has its own monitoring tool, the Management Center, available under the Enterprise license. But all metrics are available on JMX and they can be collected, for example, using Zabbix. So, in our network, the memory occupied by the application and, if necessary, any other available metric are monitored.
Nevertheless, Zabbix is poor in terms of its ability to compile queries, build and design graphs, so it is more suitable as a source of data for Grafana . To monitor collection sizes, hit rate, latency, their values are sent to Graphite from the component that controls the launch of the Hazelcast node.
Temporary data requires automatic cleaning, and you also need to keep an eye on it. Therefore, the log gets every addition, deletion or evikt data from the collections. Live logs are available at Kibana - Adele recently talked about this - and are great for investigating incidents or tracking the effectiveness of caches. Such logging can be implemented using MapListener , which fully covers the needs of our team in monitoring the cluster.
Restart cluster nodes
In order to make the process of restarting all the nodes of the cluster as painless as possible for the system, we use the following approach:
Each change to the Hazelcast settings — setting up new or existing collections, monitoring, and allocating memory to the application — is performed as part of the cluster release process as a component of our system.
To automate the process of restarting all the nodes with the new settings, a script was written that, based on the monitoring data of the node, decides whether it can be restarted with the new version. Hazelcast has PartitionService with information about the state of cluster partitions, including information about all data backups, isLocalMemberSafe (). The script interprets this flag as a sign of the ability to safely restart a node - all its data can be recovered from other node backups.
- By itself, the isLocalMemberSafe () flag does not guarantee that everything will not fall apart in the next millisecond. Therefore, we run Hazelcast with the following parameter:
<property name="hazelcast.shutdownhook.enabled">false</property>
This allows you to disable Terminate (hard disconnect) node when receiving a signal SEGTERM. The script sends the SEGTERM node, the application context is closed with a call to Graceful Shutdown.
This method ensures the regular output of the node from the cluster, waiting for complete data synchronization before turning off the node. The process of cluster release takes about an hour in semiautomatic mode, and the node input to the cluster takes an average of 5 seconds.
Loss of half node nodes
An interesting schedule I noticed one good morning. The maintenance service conducted exercises to disable one DC, and at some point the Hazelcast cluster was left without half of its nodes. All data was successfully restored from the partition group backups, and the decrease in the number of nodes in the cluster had a positive effect on the speed of work.

With a complete shutdown of one DC, Hazelcast repartitioned the data to the remaining nodes, and the speed of work increased almost 2 times.
The question arises: why don't we leave 2 times less nodes? Here is just the space for research - we will select a configuration that will provide maximum speed without harming fault tolerance.
Was it worth it
The distributed in-memory database allowed organizing convenient and “beautiful” storage of a mass of temporary information. In addition, the architecture was not only productive, but also well-scalable. But I would be careful not to advise such distributed systems to everyone in a row, as they are rather difficult to maintain, the benefits of which can only be felt on a really large data stream.
In addition, according to the results of the project, we learned not to trust solutions based only on their popularity (hi Spring Boot), as well as to thoroughly test a new product before implementation. But even after all the settings described in the article, I will have to do something to twist and change: for example, I have yet to learn the “joy” of updating from Hazelcast 3.5.5 to the latest version 3.8. The point is that the versions are backwards incompatible and therefore the thrill is guaranteed. But I will tell you about this some other time.
')
Source: https://habr.com/ru/post/332462/
All Articles