Cisco CDR and Asterisk Telephony Analysis with Splunk
Today there is a classic, from the point of view of analytics, task - analysis of CDR telephony. In this article, we will describe how two different companies solved two completely different tasks. Company X analyzed the Cisco CDR telephony, and company Y analyzed the CDR Asterisk telephony. Why do we write about this in one article? Because as a tool for analysis, both companies use Splunk , about which we wrote a lot earlier .

Under the cat you will find a detailed description of the tasks and their solutions with pictures and queries.
Tasks
Company X has about 30 departments, in which there are about 400 internal numbers and about 100,000 calls per month.
')
Company Y has a call center based on Asterisk telephony with 1 million calls per day and wants to receive analytics about its work. Most of all, company Y wants to know the number of competitive calls (occupied by time slots) at a certain time quantum (for example, at each hour), with distribution to external flows. Plus basic kpi, such as: average call duration, average call duration, percentage of answered calls, and so on.
In this article we will not talk about how to connect Splunk data and how to do field parsing (if that's what you are interested in, write to us - and we will make a separate article about it, but in fact, there is no rocket science). We will show basic queries, graphics and dashboards.
Company X
Analytics across the organization:

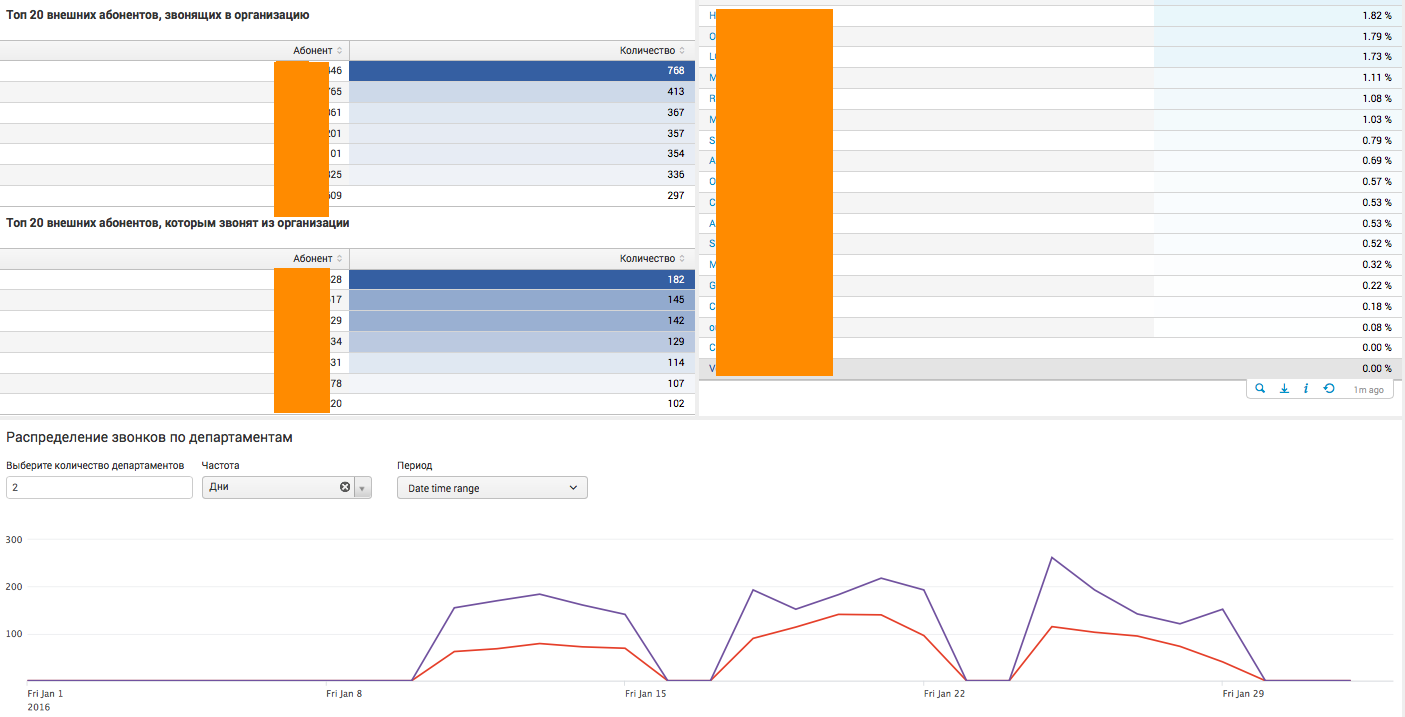
This dashboard collected general analytics for the company as a whole, with various statistical indicators. The dashboard is live, that is, it has various filters, and can also send the user to the next level of detail. For example, when you click on a particular department or phone number, the user will see the analyst in the context of the selected segment.
Analytics within a separate department:
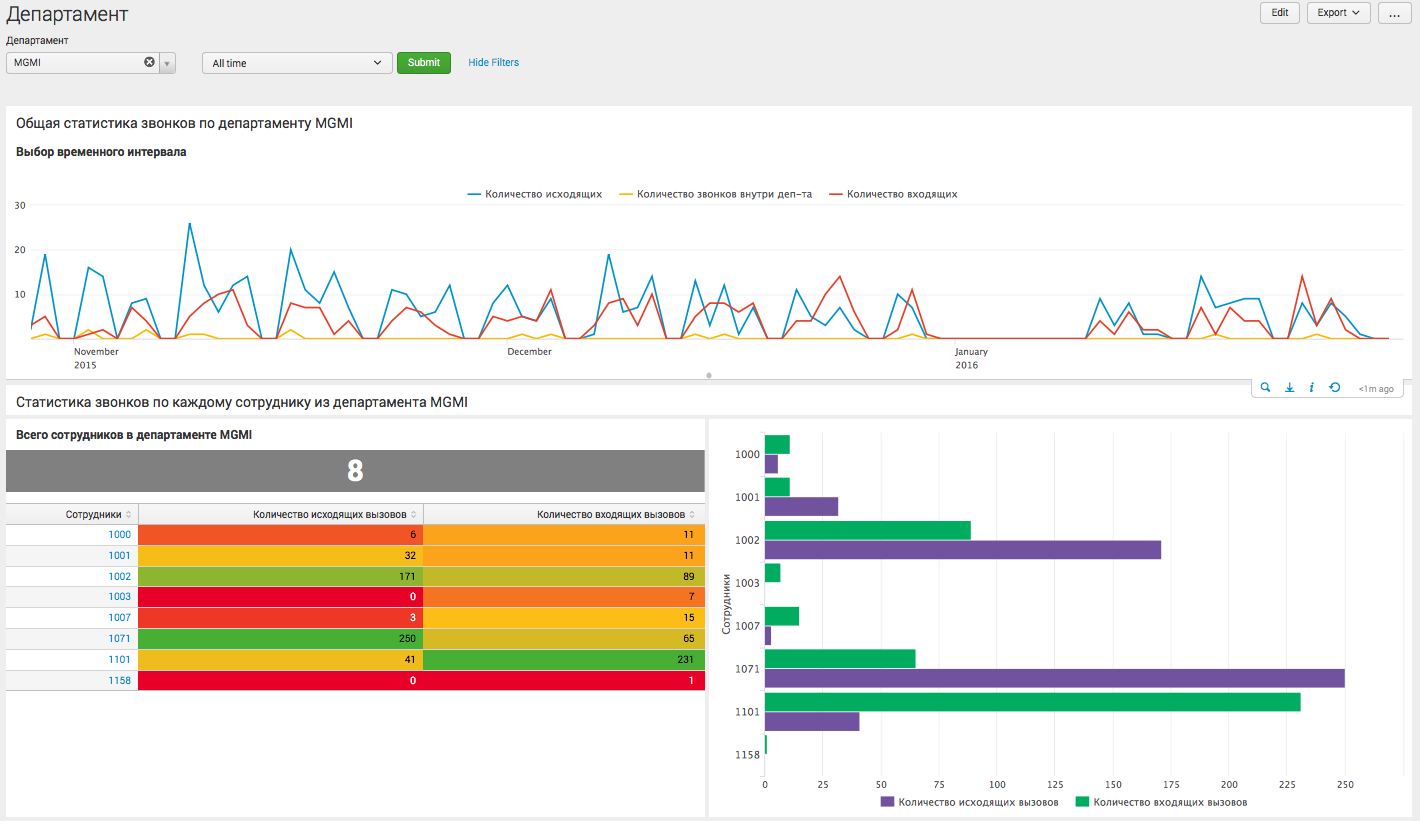
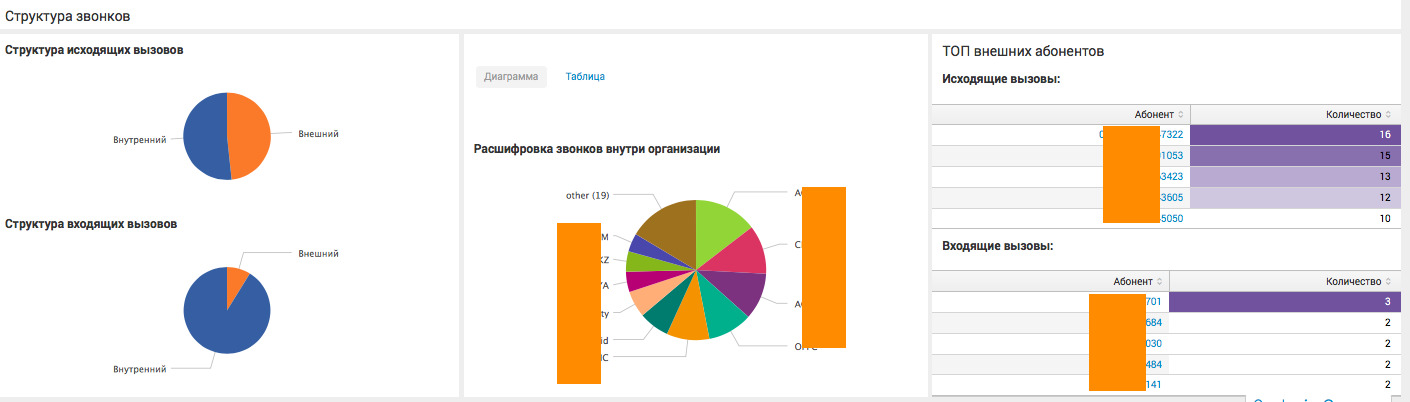
On this dashboard, the user sees the details for a specific department of the company, and can make a conclusion about the statistics of the interaction of the staff of this department with other internal departments, as well as external calls.
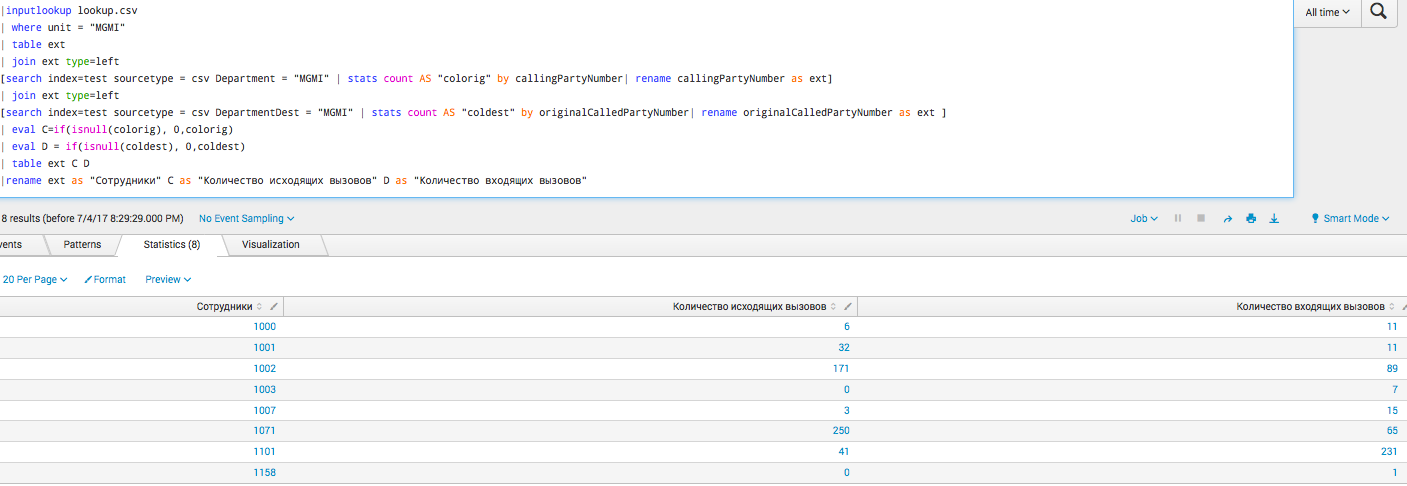
User-specific analytics:
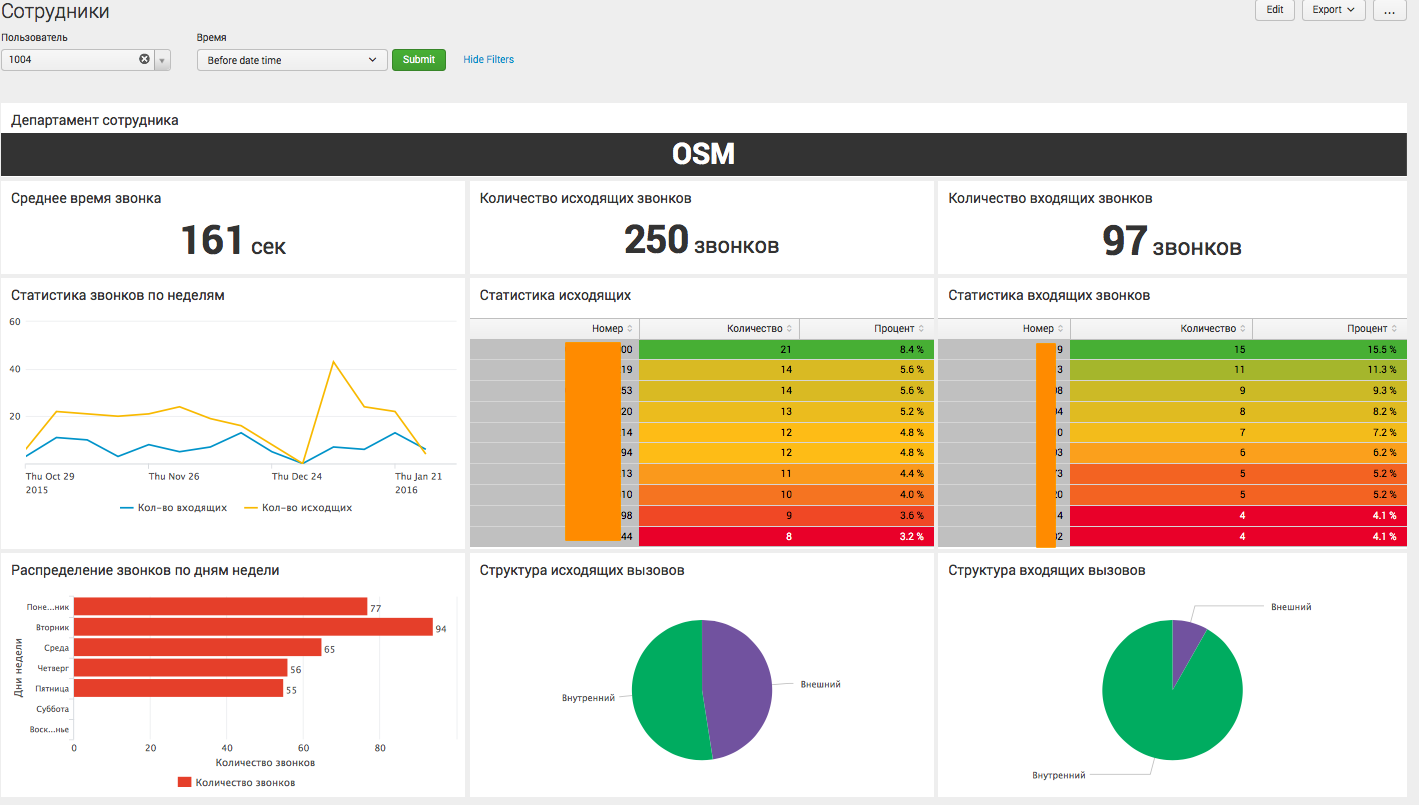
This is the last level of detail, where we see information relating to a particular employee of the organization, and we can judge its activity.
Requests
In fact, all these graphs are built on fairly simple queries, the level of complexity is comparable to those we discussed in our previous articles . Below is one of the most difficult:
Company Y
Everything is much simpler here, since the call center has only one type of calls, and the company is more interested in only summary information. However, the possibility of dorobotki and detailing is not excluded, for example, for a specific employee. Below are the main Asteriska CDR based dashboards:
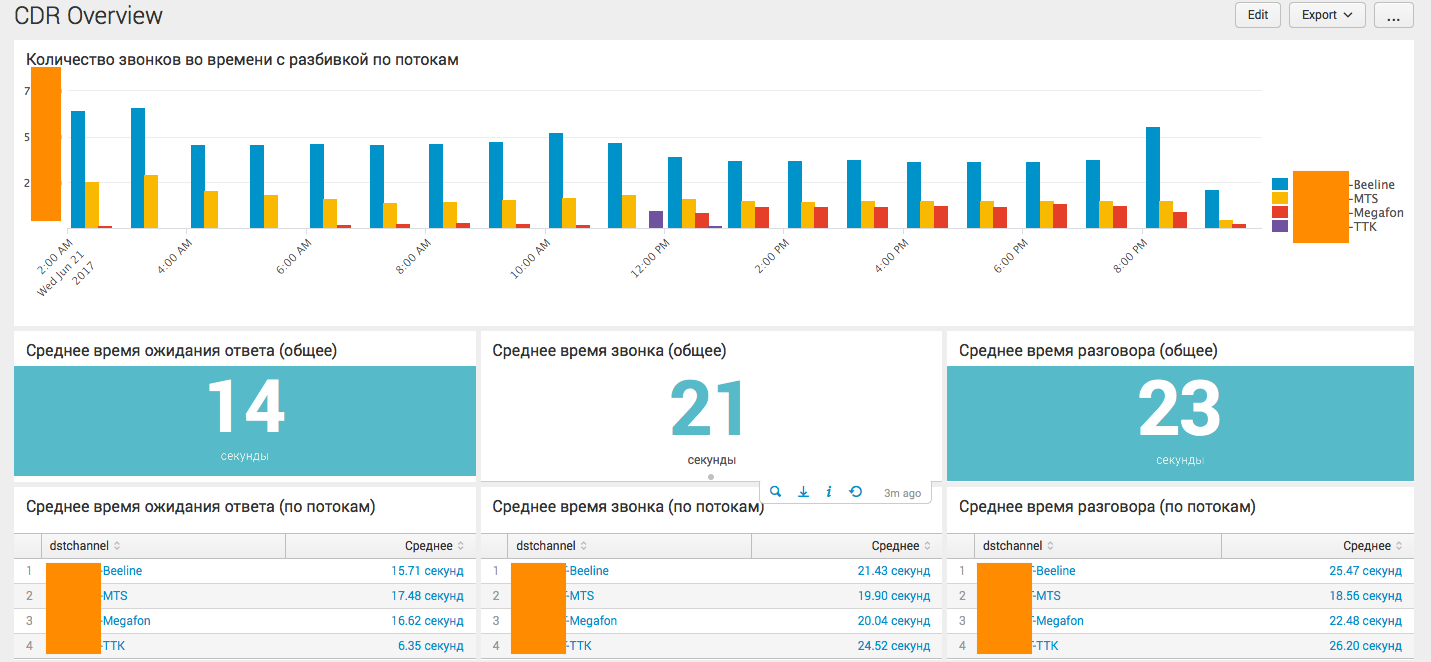

The most interesting is the lowest chart, where the problem of calculating competitive sessions is solved.
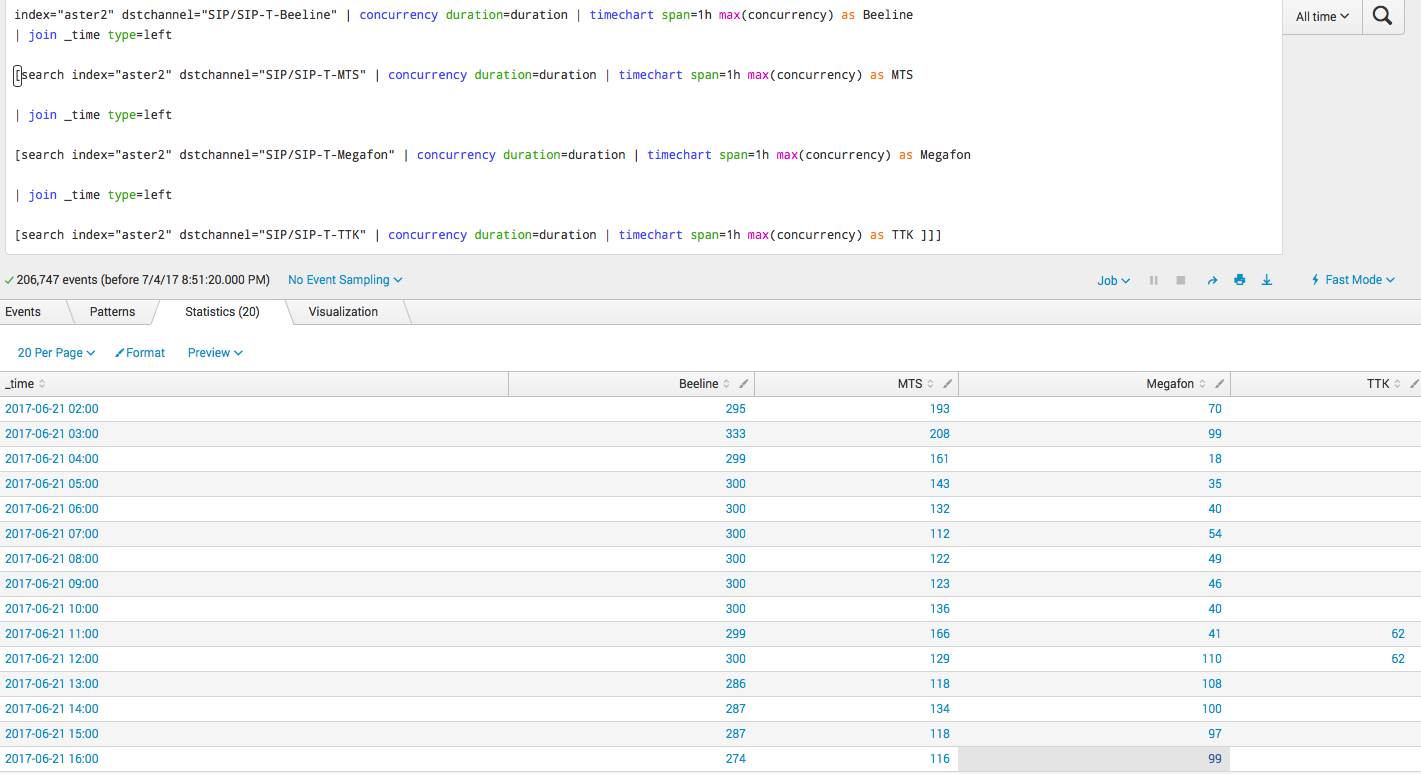
Requests
Below is one of the most complex requests, just about competitive sessions:
We are happy to answer all your questions and comments on this topic. Also, if you are interested in something specifically in this area, or in the field of machine data analysis in general, we are ready to refine the existing solutions for you, for your specific task. To do this, you can write about it in the comments or simply send us a request through the form on our website .
On June 28, 2018, “ Splunk Getting Started ” will be taught in Moscow , where in 6 hours the participants will receive a theoretical base and practical skills for working in Splunk. Learn more about learning and register at this link .
Under the cat you will find a detailed description of the tasks and their solutions with pictures and queries.
Tasks
Company X has about 30 departments, in which there are about 400 internal numbers and about 100,000 calls per month.
')
- Company X wants to receive analytics of calls made by internal users both outside and among themselves. It is necessary to receive information on the number of phone calls, the number of callers, the distribution of incoming and outgoing calls, the most calling subscribers inside / outside.
- Reports are required showing how employees from different departments interact with counterparties. Often, such a task is difficult to solve objectively on the basis of surveys, and by analyzing phone calls you can get the most objective picture possible.
- It is necessary to assess the intensity of calls to understand the activity of the work of managers within the organization.
Company Y has a call center based on Asterisk telephony with 1 million calls per day and wants to receive analytics about its work. Most of all, company Y wants to know the number of competitive calls (occupied by time slots) at a certain time quantum (for example, at each hour), with distribution to external flows. Plus basic kpi, such as: average call duration, average call duration, percentage of answered calls, and so on.
Problem solving
In this article we will not talk about how to connect Splunk data and how to do field parsing (if that's what you are interested in, write to us - and we will make a separate article about it, but in fact, there is no rocket science). We will show basic queries, graphics and dashboards.
Company X
Analytics across the organization:
This dashboard collected general analytics for the company as a whole, with various statistical indicators. The dashboard is live, that is, it has various filters, and can also send the user to the next level of detail. For example, when you click on a particular department or phone number, the user will see the analyst in the context of the selected segment.
Analytics within a separate department:
On this dashboard, the user sees the details for a specific department of the company, and can make a conclusion about the statistics of the interaction of the staff of this department with other internal departments, as well as external calls.
User-specific analytics:
This is the last level of detail, where we see information relating to a particular employee of the organization, and we can judge its activity.
Requests
In fact, all these graphs are built on fairly simple queries, the level of complexity is comparable to those we discussed in our previous articles . Below is one of the most difficult:
|inputlookup lookup.csv | where unit = "MGMI" | table ext | join ext type=left [search index=test sourcetype = csv Department = "MGMI" | stats count AS "colorig" by callingPartyNumber| rename callingPartyNumber as ext] | join ext type=left [search index=test sourcetype = csv DepartmentDest = "MGMI" | stats count AS "coldest" by originalCalledPartyNumber| rename originalCalledPartyNumber as ext ] | eval C=if(isnull(colorig), 0,colorig) | eval D = if(isnull(coldest), 0,coldest) | table ext CD |rename ext as "" C as " " D as " " Company Y
Everything is much simpler here, since the call center has only one type of calls, and the company is more interested in only summary information. However, the possibility of dorobotki and detailing is not excluded, for example, for a specific employee. Below are the main Asteriska CDR based dashboards:
The most interesting is the lowest chart, where the problem of calculating competitive sessions is solved.
Requests
Below is one of the most complex requests, just about competitive sessions:
index="aster2" dstchannel="Beeline" | concurrency duration=duration | timechart span=1h max(concurrency) as Beeline | join _time type=left [search index="aster2" dstchannel="MTS" | concurrency duration=duration | timechart span=1h max(concurrency) as MTS | join _time type=left [search index="aster2" dstchannel="Megafon" | concurrency duration=duration | timechart span=1h max(concurrency) as Megafon | join _time type=left [search index="aster2" dstchannel="TTK" | concurrency duration=duration | timechart span=1h max(concurrency) as TTK ]]] Conclusion
We are happy to answer all your questions and comments on this topic. Also, if you are interested in something specifically in this area, or in the field of machine data analysis in general, we are ready to refine the existing solutions for you, for your specific task. To do this, you can write about it in the comments or simply send us a request through the form on our website .
PS
On June 28, 2018, “ Splunk Getting Started ” will be taught in Moscow , where in 6 hours the participants will receive a theoretical base and practical skills for working in Splunk. Learn more about learning and register at this link .
Source: https://habr.com/ru/post/332426/
All Articles