What kind of involvement does your product need and how to measure it more accurately

User engagement is considered to be directly related to monetization. The creators of mobile applications often measure it and discuss numbers. It only seems that everyone investigates it equally. In fact, everything is much more interesting.
A very long article provides an overview of the approaches, methods and results of research on the involvement of users of mobile applications. It will not be simple and fast "top-10" tips for guaranteed increase of DAU, MAU, ARPU, etc. Instead, we will try to understand the types of engagement and come to understand what should be measured and when is better, and what does not make sense. Difficult moments will be disassembled "on the fingers." In addition, we will look at several translated methodologies for measuring engagement from scientific peer-reviewed journals.
')
The article may be useful to the creators of mobile applications, product managers, analysts, researchers, UX-specialists.
I decided to draw conclusions to the beginning.
The shortest conclusions from the article
1. What do you want to explore?
1) How does the user relate to the product / brand: explore marketing engagement.
2) How involved is the user in using the application: explore user engagement.
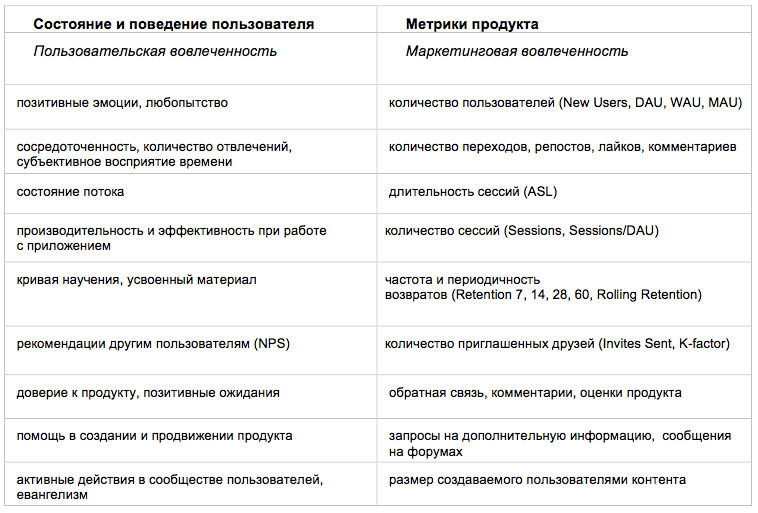
2. How involvement is determined: Table 1 .
3. What are explored through engagement: Table 2 .
4. How to measure engagement levels: Table 3 .
5. What to explore for different types of applications and involvement: Table 4 .
6. How to choose a method at different stages of product development: Table 6 .
7. What questionnaires are used by researchers: see Appendices.
And now, I will write how it all came about.
It all started for a reason. More than two years ago, I came up with the idea of a SAAS service for automating recruitment and evaluation, I found an investor, our companies in partnership created a service and launched it into operation. Among other things, I was engaged in marketing, research and watched how users perceive and buy the product. I wrote about one of these studies in the last article .
It took time and money to test marketing moves. We monitored the change in demand and began to notice that our marketing efforts and product refinements for client requests did not particularly affect their behavior changes. There was no global increase in demand and involvement due to these changes. And then we moved away from metrics and marketing, stopped modifying usability and began to figure out what else affects customer behavior. Here it turned out that the metrics we used in principle did not help us understand what the users needed, and distracted attention to the fuss with analytics.
Now we are developing a mobile application for assessing professional competencies. In order not to lose time again, I decided from the very beginning to figure out how involvement in mobile applications is measured and how it can be increased. Articles describe mainly metrics like DAU, MAU, retention, ARPU. But until such time as these metrics can say something to me, much will have already been spent.
Therefore, I thought seriously about measuring engagement, I was overlaid with scientific articles and new research and tried to find some kind of system in it. In the article, I will show you step by step how I rebuilt this system and how I ended up with 3 types of involvement, 3 groups of applications and 5 tables in order to choose a method and explore all this well.
1. What is engagement
Here I will explain how involvement is defined. Then we will face difficulties and learn the good news. If you are not interested in the subtleties of the definitions, you can skip this section. But then you will not know how much involvement is defined differently, and what kind of two types of involvement it all comes down to.
Indeed, what is involvement? Everyone intuitively understands what it is. And it is actively investigated. But the definition is rarely given. And this causes confusion. Involvement is a special condition during the use of the application, or a general loyalty to the product, or a willingness to actively interact with it and recommend to others, or something else?
For my competency assessment app, what can be considered user engagement? Before applying the metrics, I want to figure out exactly what I want from users and what I will consider the success of the application.
Since we are talking about the study of involvement, the stage of conceptualization (determining what it is from the point of view of a particular product) cannot be missed. Therefore now there will be a little tediousness and work with dictionaries.
Often, in research, the concept of engagement is narrowed down only to the emotions that the user experiences in relation to the product, or the company's brand. Sometimes we are talking only about the study of the real actions of users. A study of the involvement of players refers to immersion, psychological preoccupation, state of flow and dissociation [21]. The review by M. Lamas et al. Lists approaches to the study of engagement through the analysis of positive emotions, focused attention, accessibility and control, novelty, etc. [1] I found several definitions, made a feasible translation and attached the originals. If you have recommendations for improving the translation here and further, I will be glad to them in the comments.
Table 1. Variants of definitions of user engagement.

So, they share approaches to engagement, how to result (the user got involved and began to push / recommend / buy more), and how to the process (the user is involved at the moment, his attention is absorbed by the application). In the first case, intersections with the concepts of retention, return and user loyalty are often encountered.
Summary of the section
User involvement is understood in various studies as:
- positive emotions, fun,
- curiosity, interest,
- attitude, attitudes,
- preference
- motivation,
- behavior
- habit,
- concentration,
- dissociation,
- preoccupation,
- flow condition.
The lack of a single definition is good news. Now you can choose a convenient definition for the research tasks, for the type of application and - ultimately - for the product development stage.
Already two types of involvement are clearly visible:
User engagement - engagement in an activity in an application: a state in which the user is engrossed in interacting with the application and experiences the pleasure of this interaction.
Marketing involvement - brand involvement: the intensity of consumer interest in the product.
We analyze on the fingers.

Figure 1. Types of engagement on the fingers.
How to apply it to my application?
When I need to understand how well users are in my application, whether they like the process, whether they are comfortable with them, I will study user engagement. When I will be interested in how users perceive the application, how they react to the brand, how much they know about it and are loyal to it, I will study the marketing engagement.
Next, I will show how you can measure each type of engagement, how to choose engagement for the type of application and what the third type of engagement looks like.
2. How engagement is operationalized.
Here we will discuss operationalization - that is, through what specific measurable manifestations can involvement be studied. We learn 2 stories when the duration of the sessions in the application showed itself from an unexpected side. As a result, it will become clear what needs to be measured for each type of engagement. The third type of involvement (activity) will not open in this section yet. If you are looking for only him - go on.
If I find out that users often log into my application. Or find out that they stay in it for a long time. Is this a good performance? It seems, yes. Which one is better? And what if I find out that when an application is open, the user does nothing - what will it mean in terms of engagement?
I found in literature 2 approaches to the operationalization of engagement:
1. Involvement as a user state.
2. Involvement as a metric of a product.
1. Involvement as a user state
Here, researchers are trying to understand what internal forces underlie engagement and drive interest, loyalty, and user behavior.
The review by M. Lamas lists the following ways to operationalize engagement [1]:
1. Focused attention. To engage users should be as focused as possible. To measure focus and involvement, violations in the subjective perception of time are used.
2. Positive emotions. The emotions experienced by the user are internal motivators. Emotional “hook” can cause a desire to understand the application and participate in the proposed activities.
3. Aesthetics. The touch, visual design of the interface stimulates the user and leads to a focus of attention.
4. Durability. People remember a pleasant and rewarding experience and want to repeat it. Characteristic is expressed in the willingness of people to recommend the product to other people.
5. Novelty. The characteristic concerns the curiosity of users, craving for novelty, unusual. Novelty awakens curiosity and provokes repeated engagement.
6. Accessibility and control. Accessibility provides an increase in user activity, and control is responsible for what level of activity users can achieve.
7. Reputation, trust and expectations. Trust is a prerequisite for engaging users. There is an unspoken contract between users and products that goes beyond technological requirements.
8. Motivation, interests, incentives and rewards.
2. Involvement as a metric of a product.
Here, no one delves into the motives and states of users. Only their behavior in relation to the product is evaluated (the number of new users, DAU, WAU, MAU, returns, "Stiky factor", etc.).
To measure user involvement on the product side in 2008, Forrester described the “4I” approach [cit. by 1].
Involment. Presence of the user. Measured by number of visits, time of sessions, etc.
Interaction. User activity. CTR, on-line actions, uploaded photos and videos are measured.
Intimacy. Attraction, or disgust of the user. Measured by satisfaction ratings, mood analysis on blogs, comments, polls.
Influence. The likelihood that the user will become a promoter. It is measured by repost, the number of invitations sent to friends.
AppLift and Localytics companies evaluate the involvement by one metric: through the average time spent by the user in the application during the month (ASL). According to their estimates, news applications with an average session duration of 6 minutes and an average monthly time of 90 minutes (2015) have the greatest involvement, which continues to grow from year to year. On the second place were entertainment: 8 minutes and 77 minutes, respectively [2].
Assessment of engagement through the duration of sessions is often found in the analysis of games. For example, in a recent large study of the influence created by developers and users of add-ons on the involvement of players (2017) [9]. But with the duration of the sessions, everything is not so transparent and several interesting points are connected.
2 stories about how failed sessions.
History 1: The difference between usability-efficiency and ux-involvement.
On the one hand, the more the user likes the application, the more time he spends in it. On the other hand, if the user needs to quickly solve the problem, then the duration of his work in the application, on the contrary, will speak about failure, that he did not understand the functions, is confused in the interface, etc.
The question arises: when do monetization require a longer duration of sessions, and in which small? And what to do, for example, with store applications: if a customer spends a lot of time in an application, is it good or bad? Is he involved, or disoriented?
France, 2017 [19].
In a study of digital camera users, researchers came up with interesting observations. The longer users completed the task, the lower they rated the camera on a scale of pragmatic needs. But, interestingly, the higher they rated it as a pleasure-stimulating object. That is, it was interesting for users to get involved in the solution of the problem, to understand the functions, although in terms of the effectiveness of the task they lost.
History 2. Difference between true and formal involvement.
The second example of a failure of the session duration metric is the formal presence of the user in the application in the absence of real interaction with him. This is what happens if users “hack” engagement mechanics and use them without actually getting involved in the process.
Portugal, 2015 [16].
The game analyst of the Miniclip company R. Vladimiro described the situation when the analyst of the game (race) showed a generally good level of return of players, but he was alarmed by the duration of the sessions. He found 2 groups of players: the first returned to the game 3-4 times a day and played an average of 6 minutes, the second came into the game an average of 1 time a day, but did not leave the application for hours. He began to analyze the behavior of the players and realized that the second players simply passively accumulate currency to upgrade the car, but do not participate in races. That is, in essence, do not play. In the article, he wrote that involvement logically increases retention, but high retention of players does not necessarily mean their high involvement: "Involvement is the pleasure of playing, and there can be no pleasure without meaningful interaction."
It turns out that before estimating the duration of sessions (clicks, transitions, visits), you need to be well aware of user scenarios in which high levels of engagement may indicate product flaws, or unwanted interactions with it.
Summary of the section
1. Two types of operationalization of engagement almost completely correspond to two types of definition of engagement: marketing involvement is most often measured through product metrics, and user involvement is measured through user states. There are intersections, we'll talk about them in the next section.
2. Classical analytics metrics in some applications may give contradictory results due to the violation of interaction scenarios (with user difficulties, formal involvement, hacking of rules, etc.).
3. In order not to confuse with the dimension of engagement, you need to think through the scenarios that users may have in the application, and then select the behavioral examples that best reflect these scenarios. Then it will be possible to avoid incorrect conclusions due to the use of inappropriate metrics.
Table 2. Options for the operationalization of user engagement.
Disassemble the fingers

Figure 2. Types of operating on the fingers.
How to apply it to my application?
Now I know what indicators to measure the marketing and user involvement of my application. I used to ask: is it good to have a longer duration and frequency of sessions? Now I can assume: if a user passes a competency assessment in my application for a long time, he is either carried away or has difficulty. To understand this, I can see the effectiveness of the task (how many users complete the assessment and get the result). If he comes in often, he either often conducts interviews, or often tests himself and prepares for interviews. I will be able to evaluate this by analyzing the time of the day at which the user enters the application.
But I still have confusion: too many indicators. Which ones to choose and which ones are better than others? To understand this, let's go further.
4. Levels of engagement
It turns out that you can not choose which indicator to study, but use them consistently, measuring involvement by levels. Here we find out what levels are in marketing and user engagement. And establish where their measurements still intersect.
Some researchers do not choose one concept of engagement, but present its different types as a hierarchy of states.
For example, LC Vieira et al. (2016), [12] distinguish levels:
- involvement,
- absorption
- immersion.
And only the last level - immersion - they consider the true state of the flow, calling the previous states of the micro flow (Fig. 3).

Figure 3. Engagement levels and player emotions according to LC Vieira et al. [12].
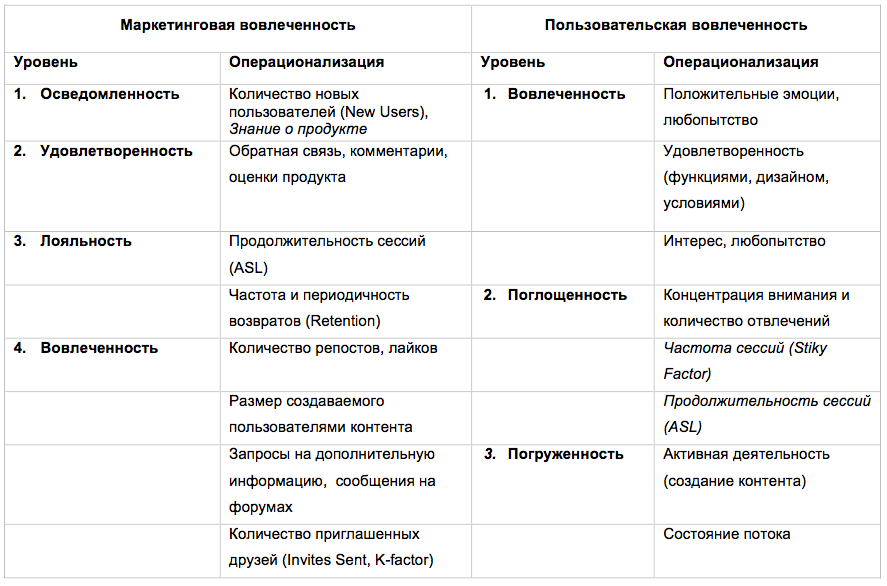
The following levels of involvement are used in marketing:
- product / brand awareness,
- satisfaction with the product / brand,
- loyalty to the product / brand,
- involvement in the product / brand.
At the last level, there is an active interaction with the brand (joint product creation), social inclusion (attracting other people to the product, spreading information about it).
Summary of the section
Involvement can be measured by level.
Let's try to combine the operationalization options with the levels of engagement (Table 3). Now the choice of metrics becomes clearer. In the table, I correlated levels of engagement with operationalization options and italicized when their methods overlap.
Table 3: Operationalization options for each level of marketing and user engagement.
Once again let's say it on the fingers.

Figure 4. Levels of marketing and user engagement "on the fingers."
How to apply it to my application?
Now I will be able to monitor the level of involvement my users have, track what percentage goes to deep levels of involvement, and record at what level I lose the most users. And as a matter of flow and active content creation, I can understand how deeply my application can involve people at the user level.
The question remains: do all users behave in the same way and is it fair to look at analytics in general, without highlighting different groups of users in it? It seems that no, not fair. We will find out what this may lead to right now.
4. Involvement of different user groups.
Here we learn 4 stories about how individual user differences influenced application analytics and confused all maps.If you investigate users and collect product analytics in general, without segmenting users and dividing indicators into groups, you may end up with unpleasant, confusing biases. About this 4 stories.
History 1. Discontented maximizers.
In marketing, there is a division of buyers into maximizers and satfirers. The first ones choose, study characteristics and read reviews. The second simply find the most suitable option and buy, without spending a lot of time to choose. From the point of view of analytics, the behavior of the maximizers will show excellent data: they often come, quickly return and spend a lot of time in the application. But in terms of business goals, these metrics are meaningless. For such users, it will only be appropriate to measure the money they ultimately spend in the application.
USA, 2013 [18].
The study of the behavior and satisfaction of these groups showed that the duration of use of the application is not associated with high income. Satfeighters quickly choose and buy, and maximizers can come back many times and choose for a long time, but in the end they don’t buy anything, or return a purchase. Maximizers are more often people of younger age, as well as people who have more money and more power. In addition, maximizers are able to spend significantly more time on buying back and writing negative reviews [18].
History 2. Permanent introverts.
Is involvement in the use of fitness devices related to personality, demographic and cultural characteristics? What user segments can be distinguished in order to consider analytics on fitness applications?
United States, 2017 [10].
The study involved 700 students. They were given Fitbit Charge HR bracelets and asked to wear bracelets regularly and synchronize data.
The researchers included dozens of variables in the analysis: gender, race, education, parents, social status, mental health, physical parameters, personal qualities, friends, siblings, even phone call data and political views, etc. It turned out that there is a significant connection with the frequency of using bracelets had only the personal qualities of the Big Five and the dimensions of the bracelet itself (duration of sleep and mobility).
, :
1) ,
2) ,
3) ,
4) ,
5) .
, , , , . , , . , , , , .
3. .
-, , 2017 , , - . , - . , .
, 2017 [8].
AE Whitehead . 578 . , - , .
4. .
, .
, 2015 [17].
– – . «C» , ( social ratio — ). «», . «». «retention 28- » «» – , , .
-. - . . , ( , ).
.

5. « ».
?
, , . , , - , . , / , . .
5. .
Jobs-to-be-done - , . , , . , 3 , , .
, , . , , . Jobs-to-be-done , , . .
, . , , on-line .
, , 3 . : , . 4.
4. .
.

6. « ».
?
, , , , .
, . . . , . , .
. , : . , . , ( , , ). , , ( ). , , , . , , .
Jobs-to-be-done , , .
, , . , ? .
6. .
. , . , . , .
, , , , , , , . .
, , , . , .
. – . - . - – (, , ). , . , . - ?
- ?
, , , , , , . - . , , , .
off-line – . , ( , , - , , Uber Booking , ).
. – – ( Rusbult, Drigotas, and Verette 1994 ). , , :
1) (, , ),
2) ,
3) ,
4) .
, , , , . , on-line , , , .
, «» «» ( ).
– , , – 2. 2 , A. Weston [11].
, , 2007.
, Baker et al. , , , Zombie Division, , (. 2).

2: Zombie Division ( )
, 2010 [20].
T. Bickmore - (. 3). . , , . , . .
– – , ( ). , , , , . , [20].

3: T. Bickmore [20].
«» : . .
« », .

7. « ».
?
. , (, , , , ). , , . , , , . , « » . , . , . .
, , ( , )? , - -. .
, . .
7.
, , , . , .
In-app / Web-
. . , , .
, [1]. , ( ). ( , ) Lifetime value (« », , , ).
, , 2012 [3].
J. Lehman , -. . . :
( , , ).
( , , ).
( , , , , ).
5. ( J. Lehman .).
, , , , , . , , , .
, 2017 [5].
A. Tarute . (, ) .
1. . , ?
2. . , , ?
3. . , - , , .
4. . , , ?
, , , . , , .
1. ( : , , , , , , .).
2. ( , , , ).
3. (, , (), , , ).
4. ( , ).
. 25 , 42.5% 57.5% . , , , .
27 (. , № 4). , , . , 4 1 . , .
(61,3%) , (Facebook Messenger, Instagram, Viber, WhatsApp). , (Trafi, Busas Kaunas, Here WeGo Maps), (Swedbank, DNB bank, SEB bank), (Duolingo, Todoist, MyStudyLife) (eg Endomondo Sports tracker, Noom Walk, WaterDrink). 14,1% .
, . . .
: . , , , – .
, 2013 [4].
YH Kim (MoEN) (. 4).

8: YH Kim .
They studied involvement as an attitude (social attitude, type of persuasion that influences behavior) and also used a division into three aspects: cognitive, affective (emotional) and conative (behavioral).
Additionally, YH Kim and colleagues introduced the motivation construct for users of mobile devices and divided it into 3 groups:
- functional (efficiency, ease of use, time saving),
- hedonistic (joy, pleasure, pleasant emotions),
- social (desire to be connected and to share emotions and information with others).
The model explores the interaction of user motivation and user involvement in product use stages: at the acquaintance stage — the cognitive stage — the user is driven by utilitarian motives and perceived value of the application, at the affective stage hedonistic motivation and satisfaction are connected, social motivation manifests between the cognitive and affective stages and, finally, at the behavioral stage, user involvement is included.
To test the model, researchers developed a questionnaire (see Appendices, No. 3). The main study involved 297 students (50.3% of men and 49.3% of women). The model was confirmed in more detail: [4].
Spain, 2017 [13].
In this study, again all parameters — from ease of use to involvement — were measured by a questionnaire (see Attachments, No. 6). The study involved 750 Spanish students (16–35 years old). The authors wanted to test how free access, ease of use, and type of content affect customer satisfaction with the service. And how satisfaction, in turn, affects loyalty, involvement, interaction, and a desire to recommend a service.
It turned out that only ease of use was associated with satisfaction. And satisfaction turned out to be associated with loyalty and engagement, and - less - with the desire to recommend and interaction (Fig. 9).

Figure 9. Model of the impact of application quality on satisfaction and involvement.
Experiment
Italy, 2015 [11].
In the study, the application was programmed to randomly divide users into control and experimental groups. The control group was asked to take a test about a healthy lifestyle at the beginning and end of the study. And the experimental group at the time of the study received access to the extended test and push notifications to the mail, which involved passing the test and getting acquainted with its materials. Although the authors built evidence for differences in involvement only from 2 study participants (out of 29) who filled an equal number of test questions with different success rates, their method of experimental involvement research deserves attention.
The authors intentionally measured involvement in two ways: 1) involvement in the application - through the number of completed test questions and 2) involvement into the problem - through the learning curve (by the number of errors in the test).
Experiments on involvement are sometimes carried out in vivo. And the signs of involvement can also be natural, as in my friend's home experiment (Fig. 10).
Russia, 2017.
Most likely, the remaining dumplings would be an indicator of a deeper level of involvement.

Figure 10. The post of my friend about life, vodka and women.
Combined Studies
In this approach, several methods are used at once: analytics and survey methods, or physiological and survey methods, are combined, or special techniques are used. It is believed that a combination of methods can give a more comprehensive picture of the subject, including by testing hypotheses from different angles.
USA, 2017 [6].
D. Ledger and D. McCaffie conducted an analysis of fitness devices and identified factors that ensure long-term user involvement. The authors measure the involvement simply as the duration of use of the device, but still paid attention to the psychological conditions for its occurrence. They compared the devices by 9 technical and 3 psychological conditions for creating engagement. According to the authors, even if one condition is not met, the involvement may not take place. 3 psychological conditions are directly related to the appointment of devices and may be applicable only to a limited group of applications. So, for fitness devices, psychological factors of involvement are: habit formation, social motivation and reinforcement of goals. The picture shows the result of the comparison of 8 devices.
Unfortunately, I was not able to find a methodology for scoring for each condition (perhaps it was a method for interviewing experts). Nevertheless, the graphical comparison looks curious and is supplemented by a detailed description of each condition with examples (Fig. 7). The report is publicly available on the Internet [6].

Figure 11. Comparison of fitness devices in terms of long-term user involvement.
USA, 2017 [7].
S. Asimakopoulos and colleagues continued research on the involvement of users of fitness devices and turned to self-determination motivation and theory. They decided to clarify how a sense of user self-efficacy is associated with motivation and long-term involvement.
Methods:
- filling in on-line diaries twice a week for 4 weeks (see Attachments, No. 5),
- the Healthcare Technology Self-efficacy (HTSE) self-efficacy questionnaire with a 7-step Likert scale (from “I completely disagree” to “I fully agree”),
- participants sent researchers photos of the mobile application interfaces that motivate them.
Sample: 34 users of fitness trackers Fitbit and Jawbone. The study showed that the motivation of users is most influenced by 3 aspects: data, gamification and content.
Methods without user intervention
Although the study of engagement without users seems an exotic approach, it is most often used.
Application creators often decide everything themselves, and when asking questions about user research, refer to Mr. Ford’s remarks (“If I asked people what they wanted, they would ask a faster horse”), S. Jobs “Create a product based on focus -groups, really hard. Most often, people don’t understand what they really need unless they themselves show it. ”And A. Lebedev (“ The answer of one fool from the street doesn’t bother anyone. But the answers of hundreds of fools are called the result of focus group research and are sold for money. ” ).
In principle, that's right: what focus groups can be at the stage of creating an idea? Here we need completely different methods. And the group of methods without user intervention is only a small part of them.
This group includes various methods of generating ideas and brainstorming, options for expert survey, benchmarking, the use of design heuristics. And, in general, with skillful use, they are able to give good results.
Physiological measurements
It is logical to use them in the study of process user involvement when it comes to changing attention, interest, emotions, etc. On the one hand, physiological methods provide more objective, immediate data on the change in player status. On the other hand, their use is often associated with the use of additional measuring equipment, which can influence these very emotions.
A review of such methods in user research requires a separate article. In the meantime, you can see the English-language reviews from the list of sources [1, 12, 13].
Portugal, 2017 [21].
The researchers decided to check how applicable programs to recognize emotions in the study of the involvement of computer game players. The equipment was a camera that captures the player’s face and software: a script written by Ergo VR Laboratory using Affdex SDK for Unity from Affectiva.
The check was successful. The emotions recognized by the program corresponded to what the players expressed, and well reflected the difficulties that some users experienced during the game (Fig. 12).

Figure 12. Differences of emotions 2 players in the same game situations.
How to apply it to my application?
Most likely, I will look at these examples when I choose methods and conduct research. But now I am only creating a prototype of the application. It is still too early for me to collect metrics and conduct experiments. And you want to understand users as soon as possible. Should I explore something already? And what methods can then be used? I found the answer to this question.
7. How to choose a method at different stages of product development.
Everything, the journey ends. Here we will discuss another approach to the choice of research method: an approach from the standpoint of product development stages. We almost will not talk - let's go straight to the tables in which all the conclusions are presented.
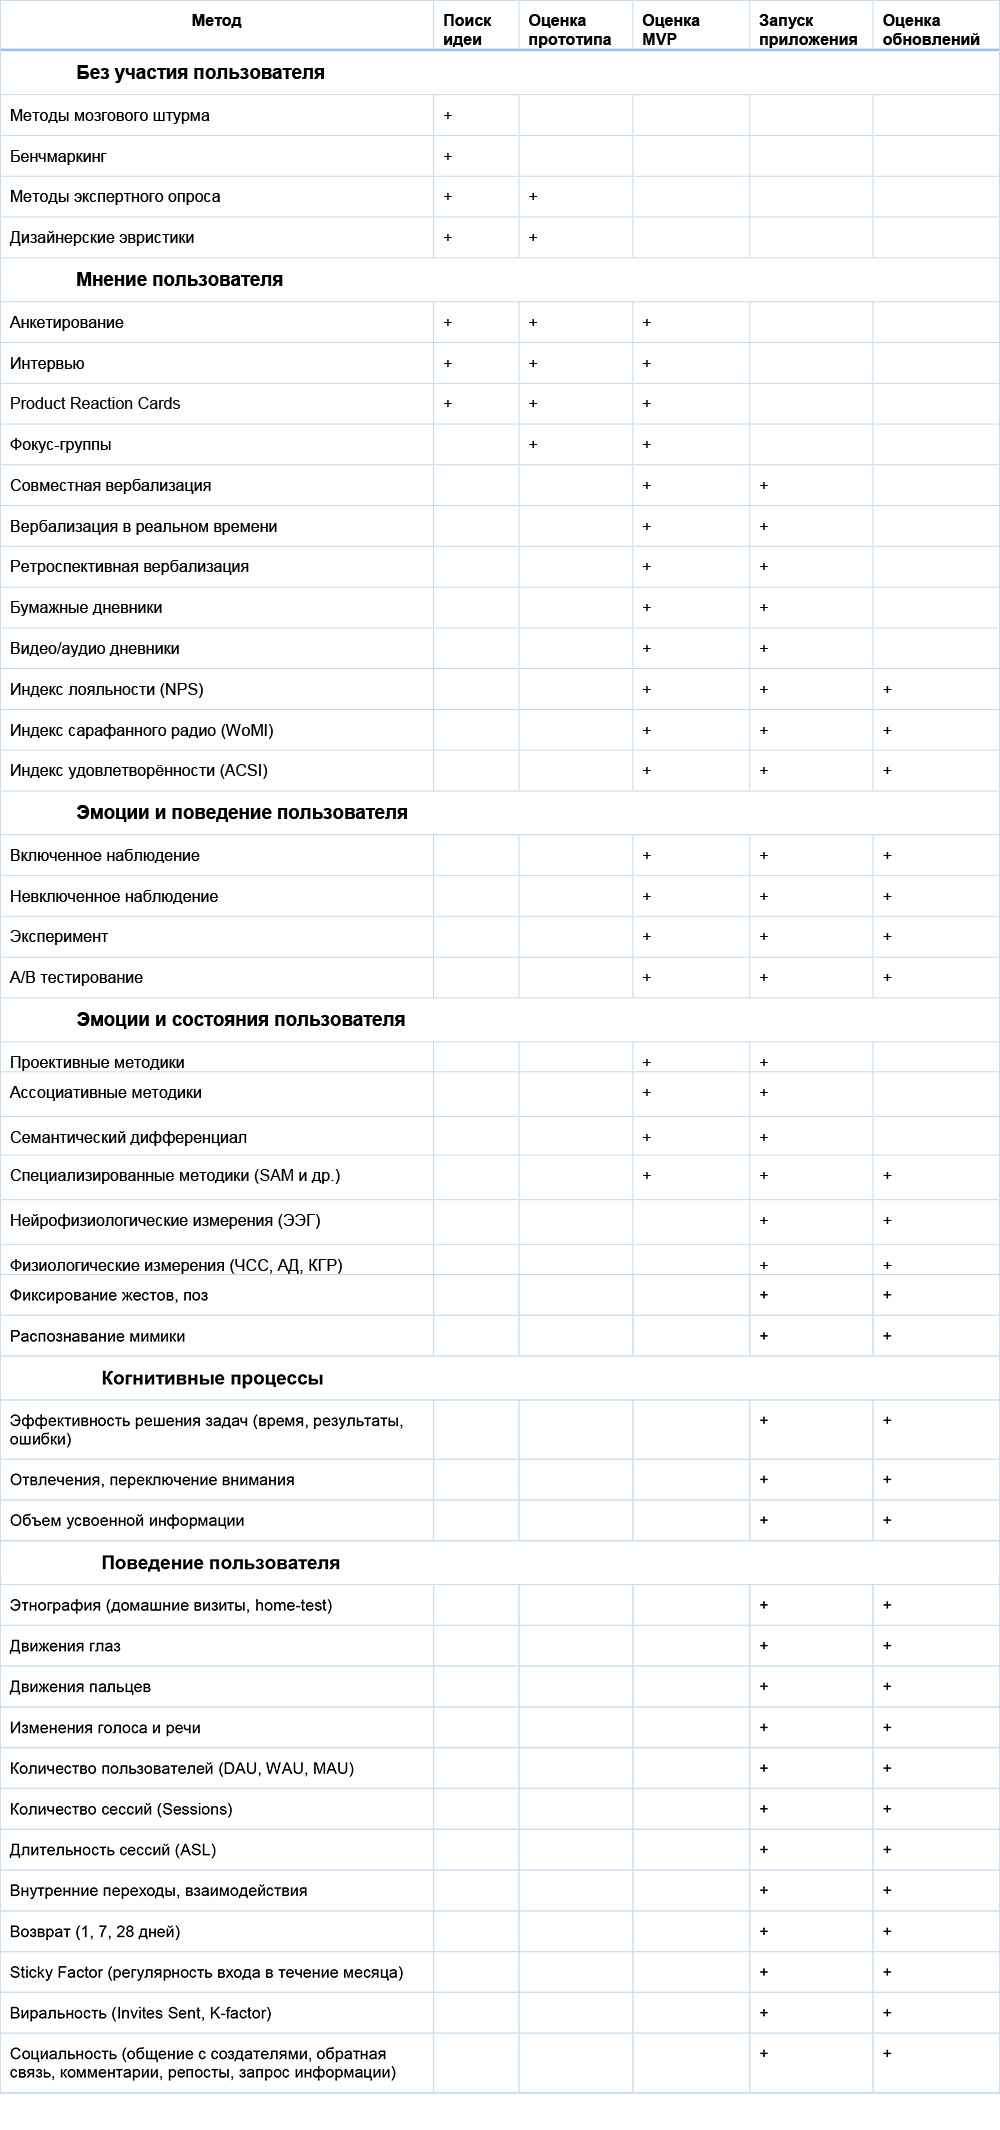
Everything that we discussed before that concerned the study of ready-made applications. How to predict involvement at the stage of searching for an idea, or testing a prototype? For this, I have compiled another table.
I used such product development stages: Search for an idea - Evaluation of a prototype - Evaluation of MVP (minimum viable product) - Evaluation of the full version - Evaluation of the update. And then she noted which methods are appropriate to use at each stage of product development.
Table 6. The choice of research methods for different stages of product development and types of applications.
Once again, let's look at the fingers of the most common research methods.
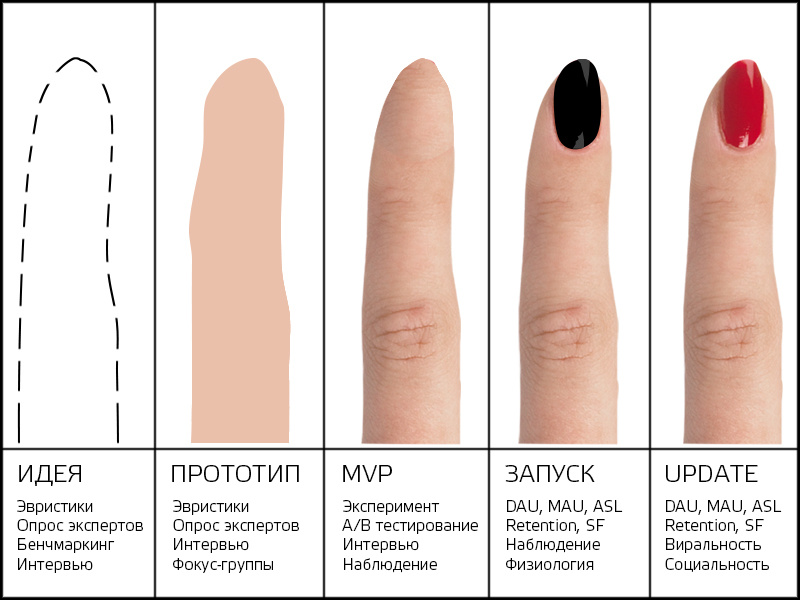
Figure 13. The most common research methods at different stages of product development "on the fingers."
How to apply it to my application?
I went through the development stage of the idea and used design heuristics and benchmarking on it. Now I have a set of methods for each stage of development of my application.
In case you missed the conclusions at the beginning of the article:
The shortest conclusions from the article
1. What do you want to explore?
1) how the user relates to the product / brand: explore marketing engagement.
2) how much the user is involved in using the application: explore user engagement.
2. How involvement is determined: Table 1 .
3. What are explored through engagement: Table 2 .
4. How to measure engagement levels: Table 3 .
5. What to explore for different types of applications and involvement: Table 4 .
6. How to choose a method at different stages of product development: Table 6 .
7. What questionnaires are used by researchers: see Appendices
I hope my investigation and invented classifications will help in understanding and researching involvement. I would be happy for your additions.
Useful sources
1. Measuring user engagement / M. Lamas, H. O'Brien, E. Yom-Tov. - 2013. - Presentation .
2. Media & Entertainment Apps: A World of Engagement [Infographic] / T. Sommer. - 2015.
3. Models of User Engagement / J. Lehmann [et al.] // Lecture Notes in Computer Science. - 2012. - Vol. 7379. - P. 164-175.
4. A study of mobile user engagement (MoEN): Engagement motivations, perceived value, satisfaction, and / or engagement intention / YH Kim, DJ Kim, K. Wachter // Decision Support Systems. - 2013. - 56. - p. 361–370.
5. Mobile Application Driven Consumer Engagement / A. Tarute, S. Nikou, R. Gatautis // Telematics and Informatics. - 2017.
6. The Secret to Long-Term Engagement / D. Ledger, D. McCaffrey. - 2014.
7. Wearables for Mobile Healthcare Wearables / S. Asimakopoulos, G. Asimakopoulos, F. Spillers // Informatics. - 2017, 4 (1), 5.
8. Mobile Technology Usage, AE [et al.] // International Journal of Sport Psychology - 2017.
9. If You Let It Build It, They Will Stay! An Empirical Study of Content and User Engagement / I. Kanat [et al.] // Hawaii International Conference on System Sciences. - 2017.
10. Exploring Compliance: Observations from a Large Scale Fitbit Study / L. Faust [et al.] // Proc. of Social Sens. - 2017.
11. Measurements of engagement in mobile behavioral interventions? / A. Weston // Digital Health. - 18 - May 20, 2015. - 8 p.
12. Assessment of fun and interactive systems: Vieira, FS Corrêa da Silva // Cognitive Systems Research. - 2017.
13. C. Calvo-Porral, A. Faín ~ a-Medín, M. Nieto-Mengotti // Computers in Human Behavior. - 2017. - 66. - p. 400–408.
14. HL O'Brien, EG Toms // Journal for the information science and technology. - 2010. - № 61. - P. 50–69.
15. Measuring emotion: The self-assessment manikin and the semantic differential / MM Bradley, PJ Lang // Journal of Behavior Therapy and Experimental Psychiatry. - Vol. 25, Iss. 1. - 1994. - P. 49–59.
16. The Tale of High Retention, Low Engagement Game / R. Vladimiro //https://ongamesndata.wordpress.com/2015/08/04/engagement-101.
17. Bartle's psycho-types and audience balancing / Sakhnov K. // https://habrahabr.ru/company/mailru/blog/263839/.
18. Maximizers and Satisficers: A Look into Consumer Regret and Dissatisfaction / T. Correia // Poster presented at McDonough Undergraduate Research Symposium on November 7th, 2013.
19. Lab Testing Beyond Usability: C. Lallemand, V. Koenig // Journal of usability studies. - Vol. 12, Iss. 3. - 2017. - P. 133–154.
20. Maintaining engagement in long-term interventions with relational agents / Bickmore, T., Schulman, D., and Yin, L. // Applied Artificial Intelligence. - 2010. - № 24, 6. - P. 648–666.
21. Digital Game Evaluation and Development: A Preliminary Study / Y. Trindade, F. Rebelo, P. Noriega // Advances in Ergonomics in Design. - 2017. - p. 371–381.
8. Applications. Several translated techniques.
Not that these techniques were exemplary. Most of them, except for number 2, I would not apply without editing. I place them for acquaintance, as we discussed above studies based on their use.
1. The scale of evaluation of emotions PANAS (Positive and Negative Affect Schedule)
How each word reflects your feelings at the moment (1 = doesn’t reflect at all; 2 = reflects a little; 3 = reflects moderately; 4 = fairly accurately reflects; 5 = perfectly reflects). Items are recommended to give out of order.
Positive points: interested, excited, confident, feel enthusiastic, proud, inspired, active, attentive, alert, decisive.
Negative points: sad, upset, feel guilty, scared, feel hostility, feel shame, nervous, feel fear, ready to give in to panic, feel irritation.
2. Self-Assessment Manikin (SAM) Self-Assessment Technique [15].
A rather old technique (1994). It helps to evaluate emotions visually. The research participant consistently selects 1 card in each row to better describe the emotion he is experiencing: row 1 - emotion modality, row 2 - level of arousal, row 3 - dominance, power of emotion. The technique is good because it circumvents linguistic barriers and allows for research with children and people from different cultures.
At the same time, the results of measurements can be encoded into numerical values and transferred into quantitative measurements, as the authors of the method did, comparing its readings with the readings of the semantic differential [15].

1. Questionnaire to measure the involvement of users of mobile devices [4].
Questions are rated by participants on a Likert scale with five grades.
Utilitarian motivation
(1 - absolutely not important / 5 - very important)
Please appreciate the importance of the following reasons why you use mobile technology:
1. To explore new ways to use mobile technology.
2. To receive information and the latest news.
3. Improve your knowledge and skills.
4. Be more organized (check email, schedule, plans, etc.)
5. Save your time and use it more efficiently.
6. To use different ways to communicate with others (voice, face to face, or through text messages).
Hedonistic motivation
(1 - absolutely not important / 5 - very important)
7. To rest and relax.
8. Enjoy a variety of content (for example, mail, applications, weather, etc.).
9. Enjoy the use of technology.
Social motivation
(1 - absolutely not important / 5 - very important)
10. To keep abreast of news and share information about events with my friends and family.
11. To meet and communicate with people with similar interests.
12. To tell my friends and family that I learned.
Perceived value
(1 - absolutely not important / 5 - very important)
13. Using mobile technology gives me pleasure.
14. I get the most benefit from using mobile technology.
15. Mobile technologies help to use my time and money correctly.
Satisfaction
(1 - completely dissatisfied / 5 - very satisfying)
16. Given all your payments, how satisfied are you with using mobile technology to pay?
17. Considering all the activities you spend time on, how satisfied are you with the use of mobile technology?
18. How generally are you satisfied with the use of mobile technology?
Probability of involvement
(1 - not at all possible / 5 - very likely)
19. How likely is it that you will be more likely to use mobile technology?
20. How likely is it that you would recommend someone to use mobile technology more often?
2. Questionnaire to measure the relationship of user involvement and the quality of a mobile application [5].
Questions are rated by participants on a Likert scale with five grades (from “totally disagree” to “totally agree” and from “absolutely not important” to “very important”).
Functionality
1. Ability to quickly make purchases.
2. The ability to make on-line payments.
3. Expansion of functions using the touch screen.
Design (aesthetics)
4. I can quickly find what I need, because the application has a convenient interface.
5. I can easily navigate, because the application has a convenient interface.
6. The visual design of the application is important to me.
7. Application design is important to me.
Quality of information
8. Mobile applications should be informative.
9. In the mobile application I can find a variety of information.
10. Mobile applications should be very interesting.
Interaction (with users and content)
11. Ability to track the actions of other users.
12. The ability to receive invitations to the social network.
13. .
14. , .
15. , .
16. .
17. , .
18. .
19. .
20. , .
21. , .
22. , .
23. .
24. .
25. , – .
26. .
27. .
3. [7].
1. 48 ?
– – – Hiking – – – ( ) – – (, ).
2. ?
–
3. 48 ?
(/ ) – – , .
4. - -?
– – (, )
5. , ? (, ).
6. ?
, – (, ).
7. 48 , :
– – .
8. 48 ?
, ( ) – – – (, ).
9. - , ?
– –
10. 48 :
– – – (, ).
11. ?
1–3 – 4-6 – 7–12 – 13–24 – 2 , .
4. , , [13].
( « » « »).
1. .
2. .
3. .
4. , .
5. .
6. .
7. .
8. , .
9. , , .
10. .
11. , .
12. , .
13. , .
14. .
15. , , .
16. , , .
17. on-line .
18. .
5. [14].
- .
( « » « »). *.
1. .
2. , .
3. , .
4. , .
5. , , .
6. .
7. .
8. .
9. .
10. .
11. .
12. .
13. , .
14. , (*).
15. .
16. .
17. .
18. .
19. .
20. .
21. .
22. (*).
23. , (*).
24. , (*).
25. , (*).
26. (*).
27. (*).
28. , .
29. , (*).
Source: https://habr.com/ru/post/332304/
All Articles