How we unify analytic work in CUSTIS

We wrote a blog about technology in the usual IT world of understanding - about our best practices in the development of information systems. Today's post is devoted to technologies of another sense - managerial: we will talk about the unification of analytical activities in CUSTIS. This story is about how to change the huge and stable system of practices that have developed over the years and direct it towards development projects.
When our company was mainly engaged in custom development and created unique products, one team worked on the project for each client throughout the entire system life cycle.
This approach responded well to the needs of customers, since the analyst:
- was engaged in only one project and deeply understood the activities of a particular customer;
- worked perfectly with architects, developers and testers in his project team;
- used to write productions familiar tools, such as Wiki and Bugzilla.
This model became ineffective when we began to move on to creating replicable solutions and work simultaneously on more projects. We needed to quickly rotate analysts between projects and reuse their artifacts, and because one described the user's actions in the Visio system and the other in Archi, there was duplication of descriptions and confusion with notations.
We set ourselves the task to select and implement for all project teams one methodology or set of methods that will meet new business objectives. In the post we describe how to develop this methodological basis.
Getting started
We began by identifying three tracks within which we will unify:
- Methodical track. We create a methodological basis for working on different projects. Following the results of tests and implementation, we make adjustments to the results of this track.
- Tests We check the developed methods on real projects. Having collected qualitative and quantitative indicators, we return to the methodical track and refine the methodology.
- Implementation. We accept successfully approved developments and make them mandatory for all analysts. This is the stage when the methodology becomes official practice for the entire company.
Then we analyzed the analytical work in different project teams and determined what needs to be unified:
- types of projects in the company;
- concepts of analytical activity (meta level);
- analyst work tools;
- roles that are involved in analytical work;
- job description of people acting in these roles:
- input artifact;
- output artifact;
- technology for creating output artifacts;
- templates of analytical artifacts;
- a list of mandatory and optional analytical artifacts for various types of projects;
- method of training analysts.
In the following sections we will discuss in more detail the results of the methodical work track.
Determine the types of projects
We identified four types of projects in the company where we need to be able to move analysts:
- Refinement of existing systems - adjustments allocated to individual projects. Labor costs: 200 to 1500 man-hours. Duration: up to six months. Such projects include, for example, the development of several visual forms with reports, algorithms for filling them out, several database tables, filtering, uploading data from reports to xlsx, pdf.
- New project (automation from scratch) - development of automated systems when the client does not have a “previous” solution or the existing system must be completely replaced. Labor costs: 1,500 to 10,000 man-hours. Duration: from six months to a year.
- Analysis request for information (RFI), pre-project, business topics management - business analysis of customers' processes. The implementation of such projects may lead to the launch of automation projects from scratch or improvements to existing systems.
- Reengineering of existing systems - complete processing of the existing system.
Next, we began to highlight the concepts in which analysts will describe the systems being created.
We describe the concepts of analytical activity
The UML diagram (see below) shows the concepts of analytic activity that we have highlighted. Using them, analysts create a description of the IT-system and communicate.
The scheme consists of the following elements:
- blue rectangles - concepts;
- dotted rectangles - chart types;
- Rectangles with a solid outline - folders in the project template in Enterprise Architect, which contains diagrams.

A detailed look at the basic concepts.
- Process is a business process of a customer. It can include both automated and non-automated functions within the system being developed.
- Described in BPMN notation. The objects on such a diagram can be of the type Business Process - for the top-level diagram and Activity - for the diagram describing the process before elementary operations.
- The description should be broader than the process being automated so that when reading the diagram the context is clear.
- Role - user role in the system or organizational unit.
- The role performing the process or operation is visualized in the BPMN diagram using Pool and Lane, and in the Use Case diagram - visualized using Actor.
- Operations - operations performed within the local process (local operations), or used in other processes (global).
- Created on BPMN diagrams by the Activity element.
- Automated operation is an elementary operation indivisible within the framework of the system being developed.
- On BPMN diagrams, it is indicated by an element of type Activity. For it, you need to set the execution type of the operation Manual, Script, User. Manual means that the operation is performed by the user in the information system, Script - the operation is performed within the system, User - users perform actions manually. When describing business processes for functions of the first two types, it is necessary to create requirements for their execution.
- Information landscape - all systems and subsystems that are involved in the business process, and the data transferred between them.
- The description uses a data flow diagram.
- The data object is a class of real-world objects.
- Created on class diagrams in UML notation.
- An automated task is a task formulated by the customer or an analyst.
- Displayed by Feature. He is present on BPMN and Use Case diagrams. On BPMN diagrams, it is associated with operations, on Use Case — with elements of type Use Case. Thus, the connection between the business model and the tasks to be automated is obtained.
- A function is a description of the behavior of a system when it interacts with someone or something. The description may coincide with the way an automated task is formulated, or summarize several tasks.
- It is displayed on Use Case diagrams with items of type Use Case. They consist of steps - atomic indivisible actions. Elements of type Requirement are attached to functions.
- Requirement - a condition that must be satisfied.
- Displayed by Requirement. May be present on three types of diagrams: BPMN, Use Case, requirements diagrams.
- On the requirements diagram, you can create a hierarchy of requirements, set the name and & nbsp description in the objects. To prioritize requirements, a modality is established: can, should, must.
- A table is a database table.
- ER charts display not only tables, but also links between them. Multiple tables can be associated with multiple implementation classes.
- Class - classes of objects of realization which are created by the developer at design.
- Implementation classes are displayed on the class diagram in UML notation.
- GUI - user interface description.
- It is created on a Dialog Wireframe Diagram type diagram. Mandatory chart elements: Use Case and screen layout, optional: component, class, table.
- A component is a part of a system that performs some function.
- The component diagram is created at the design stage of the system by architects or developers to reflect its composition.
To use concepts in practice, you need to choose a modeling tool that is uniform for all. About him - in the next section.
Choosing analytical tools
One can argue endlessly about the advantages and disadvantages of tools that provide analytical work. For example, someone likes to develop fine motor skills on the example of such solutions for modeling business processes.
For many years, our company has used DDD (Domain Driven Design) development methods [7] and Wiki [6] tools. We relied on this experience and looked for new market methods and analytical tools.
We wrote down possible cases of using the tool, tested them on several projects [9], talked to colleagues from other companies, and finally chose Enterprise Architect .
For us, the following parameters were critical:
- support for BPMN and UML notation, ArchiMate 3.0;
- versioning of projects and diagrams;
- export and import models;
- uploading documents based on diagrams without the involvement of developers to create templates for uploading documents;
- the ability to collectively work with diagrams;
- low cost and flexible licensing policy;
- the presence of an active community of users and developers.
The fact that we preferred this tool does not mean at all that it will suit you. When choosing your tool, try to collect all the restrictions and requirements for it, consider as many scenarios as possible of how your colleagues use it, and determine how well analysts, developers, testers and engineers know standards and notations. Then in the short term, you do not have to switch to a new tool.
To ensure that the analyst does not list the artifacts that need to be created each time, we developed a project template in Enterprise Architect. The next section is about him.
Developing a project template in Enterprise Architect
When we created the project template, we were guided by the needs of developers, testers, engineers, and customers, as well as the standards and notations common in the IT industry.
There are several options for describing requirements. You can learn more about them from the materials listed in the references at the end of the article [1–4]. We tried to take only the options needed to solve our problems, and left those artifacts that are used in the work of two or more people in the project, taking into account the life cycle of system development.
In the project template, we fixed the structure of folders and diagrams in them, as well as the technology of filling diagrams for various types of projects. We also gave not only a list of notations, but also their necessary modifications, for example, for unloading documentation according to GOST, mapping objects of one level of description with another.
The set of artifacts in the template varies depending on the type of project.
Those interested can follow the links below and see what these artifacts are. In the description of folders and diagrams there are explanations.
- Refinement of existing systems .
- New project (automation from scratch) .
- Analysis request for information (RFI), pre-project, management of business topics .
- Reengineering existing systems .
Conclusion
Let me remind you once again why we all gathered here today.
The presented methodical track is part of the great work on the unification of analytical activities in the CUSTIS company. At the time of this writing, we have already tested the methodology on some types of projects.
On projects like RFI, we have seen the undoubted benefit of this technique: it allowed us to reuse the functional and component work decomposition, as well as the methodology for estimating labor costs.
Working for the first time according to the proposed scheme, we created functions, system components, and other necessary elements and estimated labor costs. Upon receipt of similar RFI, we copied the already created diagrams and, if necessary, made minor corrections, for example, we changed the composition of functions and (or) components. Thus, we were able to reuse the artifacts created and minimize the time needed to estimate the labor costs for similar RFIs.
On projects to refine existing and develop new systems, the time to create analytical artifacts “in a new way” turned out to be less than the time to develop them “in the old way” by 25–40%.
We compared the time spent on the development of an artifact in the new methodology and the expert assessment of the time spent by each of the analysts working in the project on the development of the artifact “as before”. The analyst, who was working under the new rules for the first time, spent more time on mastering the methodology, best practices and examples, and consulted with more experienced colleagues, but after two or three iterations, the time for chart development was significantly reduced.
This is demonstrated in the diagram:
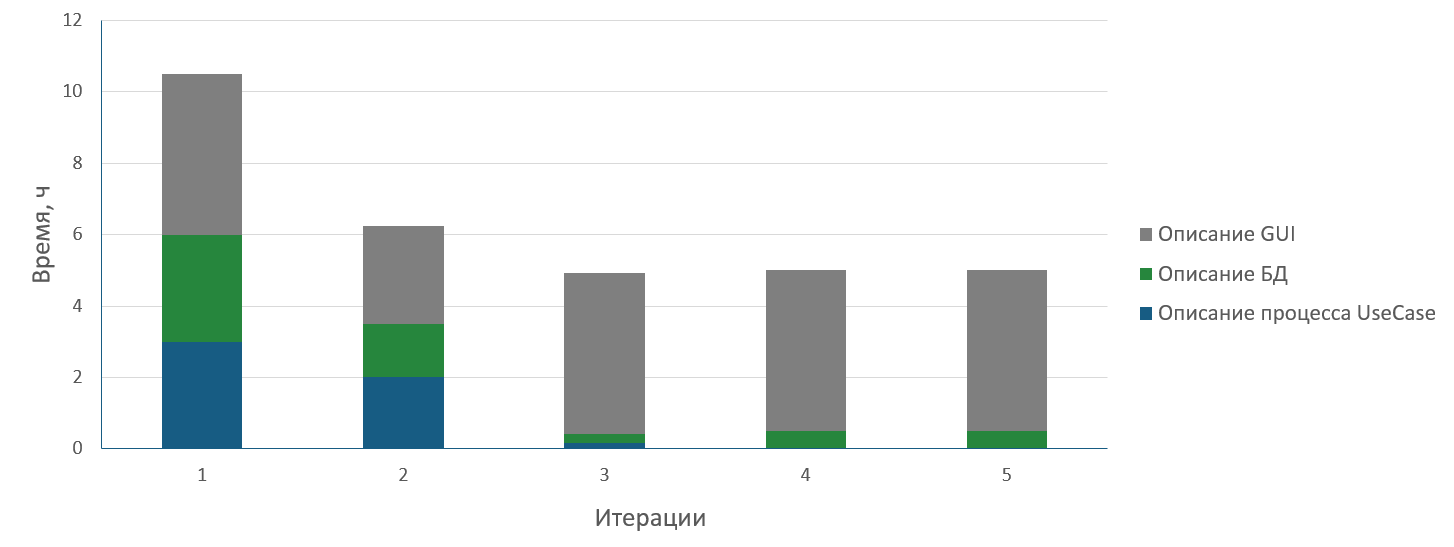
We did not set a goal to reduce labor costs for the development of artifacts - it was important for us that this time did not increase critically and the method got accustomed to the company. It was all the more gratifying to see that resource costs began to decline, and people shared the values of our changes.
For us, the challenge remains to ensure the movement of analysts within the company across divisions that work with customers from different subject areas. We will share the successes of this part, when we collect enough illustrative examples, on the basis of which we can say with confidence that the implementation track began to bring the first significant results.
In the following articles we will also describe how we test the methodology: what parameters we look at in order to understand whether the chosen method is suitable for our work - and we will share our experience in implementing work “in a new way” in existing projects.
Useful literature
- K. Wigers. Development of software requirements . 2004.
- A. Levenchuk. System engineering thinking .
- Jacobson, I. Spence, K. Bittner. Use-Case 2.0: The Guide to Succeeding with Use Cases .
- An Introduction to the ArchiMate 2 Modeling Language .
- ArchiMate 3.0 Specification .
- M. Tsepkov. The system model is the architecture for Agile development (presentation from a speech on Agile Days, 4–5 March 2011).
- M. Tsepkov. Domain Driven Design: a model instead of a requirement (presentation from a speech at LAF, June 25–26, 2011).
- M. Tsepkov. How to choose design and work with requirements for a project (presentation from a speech on Analyst Days, April 21–22, 2017).
- P. Music. Practice of using Enterprise Architect and T4 templates for developing a system on Microsoft SQL Serve r (presentation from a presentation on Desktop UI & Business Applications, April 11, 2015).
')
Source: https://habr.com/ru/post/332018/
All Articles