“Iceberg instead of Oscar!” Or as I tried to learn the basics of DataScience on kaggle
In my last article on the development of data science (or Data Science abroad) from absolute zero (even lower than -273 degrees Kelvin), I promised that I would prepare a material on how I mastered kaggle (I will write with a small letter, as they have on the logo).
For those who, just like me, are just beginning to get acquainted with this issue, I will explain that, as I understood, kaggle is a website dedicated to competitions and, to some extent, training in Data Science, where everyone can do it for free and using any available tools. forecast for a particular task.
If it is interesting to you that as a result from all it came out from me I ask under kat.
')
UPD : With a fresh mind, I added some small explanations about the “data” tab and about retraining the model.

According to a good tradition, I’ll start the article with a description of my skills so that a novice reader can understand that I have practically no knowledge and also become inspired.
So, my knowledge of what Data Science is and what it is eaten with is based on courses from the Cognitive class (SS) and on the self-tutorial Data Science from Scratch (by reference my opinion on these resources).
So that it would not be necessary for you to spend your time, I briefly summarize:
Therefore, despite knowledge of some concepts in the field of Data Science, having opened the first and probably the most popular task about Titanic, I was essentially “alone in an open field,” and there were some ratings, “notebooks” with solutions and people who obviously know something ...
I suspect that my article about kaggle is not the first one and, if you wish, you can find different information about what it is and how to start working with it , but I would still like to share my experience of entering this wonderful world.
So, as I said at the very beginning, kaggle is a portal dedicated to data science competitions. Registration on the portal is completely free, the presented tools seem to be too (if there is something paid please write in the comments I will update the article).
Competitions on the portal are divided into different categories, some give money for prizes, some tasks are just for fun, of course there are tasks oriented to beginners (as I understand it, ratings are regularly cleaned), well, there are some semi-closed competitions, apparently somehow related to other portals.
As I understand it, the portal is designed so that users can compete in forecasting and boast to their colleagues and employers high places in the leaderboards, but companies can probably solve some of their research tasks or even find employees (there is such a section on the website ).
The portal is presented in English, so if you don’t own it at all, it will be hard for you (“thanks to CEP!”).
I remember when I was registering, I really wanted to sleep, so I didn’t understand anything and spat, but I must pay tribute to the project team, in the morning I received a letter with a greeting and a proposal to begin acquaintance with the Titanic: Machine Learning from Disaster course, and I was convinced they refuse.
As it seemed to me, the task of determining the number of survivors on Titanic seems to be the most beaten and is mentioned, probably, in half of all courses in Data Science.
(By the way, an excellent task for analytics, to find out how often in Data Science courses and books the problem about Titanic is mentioned and how often it will be mentioned in the future if someone owns the data, write in the comments, update the article hot on the heels)
On the “Overview” page of the competition there is a descriptive part and requirements for the analysis results that you upload; if you are on kaggle for the first time, then pages with FAQ and Tutorials will be more useful. It should be noted that the last two tabs on tasks for advanced users may well (and most likely will be) absent.
FAQ: for this competition will tell us the following key things.
Tutorials: For a beginner, a vital tab, if you have come "from the street" and do not understand anything, then you (and me) are just there. Training materials can be divided into 3 types:
Notepads and interactive tutorials are presented for R and Python languages. And in the text articles they even add instructions on how to process data using Excel .
There are other useful pages, for example, “Data” . On this page you can download training and test sample files, as well as see an example of how the file should be uploaded to the portal for evaluation. Among other things, on this contribution there is a description of the data, decoding abbreviations and explanations, so I advise you to look.
It should be noted that when creating a notebook (tab "Kernels"), you can one-click download a set of data from an already existing competition.
Other tabs suggest you explore on your own.
How did I start?
At the beginning of the article I referred to the SS courses (which were more focused on R) and the self-help manual (Python-oriented), because I liked the book more, I chose Python.
There were many notebooks in Python, some were simpler, some on the contrary contained a lot of detailed material, I realized that I was not ready “right off the bat” right away and started from an interactive tutorial.
Good for someone who knows, but for me it is bad, so there was no way without a tutorial. So the link led me to this course: " Kaggle Python Tutorial on Machine Learning ". The course is free (although there is an annoying nuance).
What is the course? If someone came across a codecademy, then everything will be familiar to you. Left description and purpose, on the right is the task code and the Python console. There are almost no difficulties, the tasks are simple, you can send the code as many times as you like until you can, and if you’ve got enough, you can take a hint or get a ready answer (unless, of course, you are not a terrible RPG fan and you don’t feel like experience points)
The course consists of three chapters:
Tutorial is simple and takes about an hour, well, a maximum of two.
I noticed that when completing the course after completing each chapter, I had a pop up window asking me to get a paid account and only then continue the course (I didn’t notice the close button, maybe it does), if it interferes with you, you can delete it using the tool “Viewing the element code” (available in almost any modern browser), you need to delete the Div with a class that will contain the word “modal”, for example, “modal-container”, after the window disappears, you can safely send the results and go to the next chapter.
I can’t say that the course is very informative, but the most minimal (just tiny) ideas about libraries for analyzing data in Python are given when I experimented with my notebook (below), I borrowed many techniques from them.
Having completed the online course, I decided that I would not respect myself if I would send those data sets that he offers, without even trying to dig in notebooks.
By the way, the platform allows you to "fork" your favorite notebook and experiment with it, or simply download the code for yourself in order to pick it up on your computer.
As I said, there are a lot of notebooks, I decided to choose the one that looked simpler to learn (translate, I didn’t want a big piece of text in English at two in the morning a little less than at all). So, I decided to borrow the code from " Machine Learning from Start to Finish with Scikit-Learn ", the author does not promise high prediction accuracy, but the main thing is not victory, but participation.
Honestly, I’ll use at least one solution in its original form, my hand didn’t rise, and I tried to dig at least a little code and try to write a couple of lines with my own hands, so I had a terrible monster from the code of the interactive tutorial and this notebook
So, I decided to edit the code on my computer (well, not just the way I put Anaconda in the last article). I will not spread my code entirely, it’s very shameful if someone wants to put Jupyter in his notebook, then each section of code is inserted into my own cell (but it’s better not, it will issue warnings) Something is a bad role model).
First of all, I stole a fragment of the data announcement
Then he borrowed the code for building a pair of diagrams, which the author had turned out to be quite visual. One showed the link between the survival rates of men and women from different points of departure:
the second graph showed the same connection, but already relative, to the classes in which the passengers lived.
Graphics are in the original notepad , so I will not upload pictures.
Then I decided that I was no worse and also tried to invent my own diagram.
I decided to check whether the status of the attendant and the class of stay somehow influence the probability of survival of a child under 18 years of age.
Since this sampling for pampering and in the calculations is not involved, I made a copy of the data and converted the data into the format I needed.
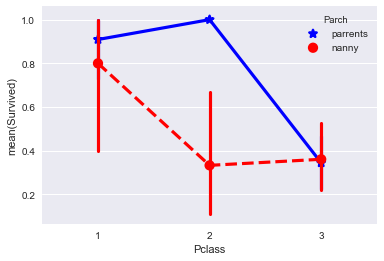
The result was something. This diagram either tells us that children in the 2nd passenger class who had a parent instead of a nanny survived much more often, or doesn’t say anything except that I made a mistake because in five days it’s not realistic to master data analysis = )
Let's go to the settlement part. Looking ahead, I will say that I uploaded my decision on kaggle 2 times to check the changes.
So, I realized that the code version from the interactive tutorial is not very convenient and in order not to produce a bunch of identical code, I decided to borrow from the author of the notebook, the option with writing functions:
Functions convert the data to digital format so that they can be “fed to the tree” later.
Then I applied these functions for the model being taught (data_train) and for the test model (data_test).
assigned target to tree
further action divided
Option for the first model. I am not fully aware of what is happening here, apparently you can understand which tree he created and which parameters contribute more to the forecast.
Now we will create a prediction for the test data set for the first model and save it in csv:
Pick up from the .csv folder, go back to kaggle, click “Submit Predictions” and get 0.689 confidence. I can not say that it is good, but it’s the FIRST PREDICTION! After this, you can go to work in popular TV shows about psychics.
For the reasons I’ll talk about in the final part, I didn’t worry much about the quality of the model and didn’t use techniques to improve it from the online Data Camp course (and they are there).
However, to make the article clearer, let's look at one small improvement.
Above, I suggested a code with a comment: “# B2. the cell for the second model comes before the code that comes after (the first model did not apply) ”two lines of code after the comment can be inserted immediately (there will be no harm, but there will be no benefit either).
Why do we need these lines? I decided to test how the presence of a family (sisters, brothers, parents, etc.) will affect survival (the idea is largely taken from an interactive tutorial). So by combining the fields "satellites" and "relatives" (my free translation), I received the field "family"
Replace the features = data_train [["Pclass", "Sex", "Age", "Fare"]]. Values and test_features = data_test [["Pclass", "Sex", "Age", "Fare", "Family" "]]. Values at:
They added our family influence parameter, but otherwise everything will remain unchanged.
As I understand it, the print (d_tree.feature_importances_) command shows us the degree of contribution of each of the parameters to the final result of the model.
We get the following:
1. [0.08882627 0.30933519 0.23498429 0.29841084 0.06844342].
2. 0.982042648709 - It seems that this is the accuracy of the fit model
In line 1, the positions in the array correspond to “Pclass”, “Sex”, “Age”, “Fare”, “Family”. So, we see that our point about the family does not make much weather, but for curiosity we still fill in the updated result on kaggle.
And we find that our model, just a little, has increased the prediction accuracy, now it is 0.72727 . and this result is already in the region of 6800 place in the rating =)
You may have a question, how could the prediction accuracy in line 2 be as much as 0.98 or more? Why did you end up with 0.72 on the test sample? Apparently, the reason lies in the fact that the model is “retrained”, that is, too much sharpened, on predicting a sample from the data_train data set and when testing the data_test set does not show adequate flexibility. This problem should be solved by setting the parameters of our "tree", this is stated in the interactive course mentioned earlier, I did not do this in the framework of this article. We are simple people, 0.72 is enough for us, so let's move on to the final part.
I never would have thought, but looking for dependencies in the data and trying to make predictions, it turns out to be a fascinating and quite exciting gamble! Despite the fact that it is difficult to start from scratch, and as I understand it, the almost complete lack of skills in the field of mate. analysis, statistics and the application of the theory of probability, more than once backfire on me, in general, at the initial stage, the process delays.
As you can see from the example of three articles, I showed that from absolute zero, you can be completely interested in the subject, and if you are a Python fan, you can completely skip the Cognitive Class version without much damage to understanding general concepts (although it’s free and you can basically two to spend on it, see the tools).
Nevertheless, in the process of preparing materials for these three articles, I realized that in order not to be painfully painful, it is necessary to move to a higher level of education.
Therefore, I think it makes sense to register for the course “Specialization Machine Learning and Data Analysis posted on Coursera” , at least it is in Russian, so you don’t have to puzzle over the translation of incomprehensible terms.
This is how casual curiosity threatens to grow into something more serious, in a couple of months, when I finish the course I will share with the respected readers my impression of it.
All good! Successfully strain your brains!
For those who, just like me, are just beginning to get acquainted with this issue, I will explain that, as I understood, kaggle is a website dedicated to competitions and, to some extent, training in Data Science, where everyone can do it for free and using any available tools. forecast for a particular task.
If it is interesting to you that as a result from all it came out from me I ask under kat.
')
UPD : With a fresh mind, I added some small explanations about the “data” tab and about retraining the model.
Part 1. "My sail turns white so lonely ..." - a little about skills
According to a good tradition, I’ll start the article with a description of my skills so that a novice reader can understand that I have practically no knowledge and also become inspired.
So, my knowledge of what Data Science is and what it is eaten with is based on courses from the Cognitive class (SS) and on the self-tutorial Data Science from Scratch (by reference my opinion on these resources).
So that it would not be necessary for you to spend your time, I briefly summarize:
- Cognitive class - told me about what Data Science is and briefly demonstrated a certain set of applied practices and tools, but after passing the course I did not learn anything worthwhile on my own.
- The tutorial gave me a cursory tour of the world of data science, showed the basic techniques and gave references to basic knowledge, but due to the fact that in the book all the functions for analysis were written from scratch, then use real libraries, (for example, pandas ) I never learned, well, and the short course of Python presented in the book was enough just enough to not “goggle” at the sight of the learning code from the kaggle tutorials (about which later).
Therefore, despite knowledge of some concepts in the field of Data Science, having opened the first and probably the most popular task about Titanic, I was essentially “alone in an open field,” and there were some ratings, “notebooks” with solutions and people who obviously know something ...
Part 2. "... Against the background of steel ships" - a little about the kaggle and the competition about the Titanic
I suspect that my article about kaggle is not the first one and, if you wish, you can find different information about what it is and how to start working with it , but I would still like to share my experience of entering this wonderful world.
So, as I said at the very beginning, kaggle is a portal dedicated to data science competitions. Registration on the portal is completely free, the presented tools seem to be too (if there is something paid please write in the comments I will update the article).
Competitions on the portal are divided into different categories, some give money for prizes, some tasks are just for fun, of course there are tasks oriented to beginners (as I understand it, ratings are regularly cleaned), well, there are some semi-closed competitions, apparently somehow related to other portals.
As I understand it, the portal is designed so that users can compete in forecasting and boast to their colleagues and employers high places in the leaderboards, but companies can probably solve some of their research tasks or even find employees (there is such a section on the website ).
The portal is presented in English, so if you don’t own it at all, it will be hard for you (“thanks to CEP!”).
I remember when I was registering, I really wanted to sleep, so I didn’t understand anything and spat, but I must pay tribute to the project team, in the morning I received a letter with a greeting and a proposal to begin acquaintance with the Titanic: Machine Learning from Disaster course, and I was convinced they refuse.
As it seemed to me, the task of determining the number of survivors on Titanic seems to be the most beaten and is mentioned, probably, in half of all courses in Data Science.
(By the way, an excellent task for analytics, to find out how often in Data Science courses and books the problem about Titanic is mentioned and how often it will be mentioned in the future if someone owns the data, write in the comments, update the article hot on the heels)
On the “Overview” page of the competition there is a descriptive part and requirements for the analysis results that you upload; if you are on kaggle for the first time, then pages with FAQ and Tutorials will be more useful. It should be noted that the last two tabs on tasks for advanced users may well (and most likely will be) absent.
FAQ: for this competition will tell us the following key things.
- What is the public rating table, which is obtained on the basis of the test sample assessment you have uploaded and is only the tip of the iceberg * ba-dum-tss * .

- The second part of the ratings is hidden from the user and will manifest itself only after summing up. And as I understand it, the hidden 50% are key to determining the winner and it looks like a similar approach, but with a different percentage ratio is typical for many other competitions.
- In this academic competition, the rating is cleaned every two months, which means that all your downloads older than two months will lose their status (as I understand it), so the task about Titanic is not “for resume”, but for developing skills.
- Kaggle will let us know that, if you wish, you don’t have to put kaggle in the cloud for analysis tools on your working machine.
Tutorials: For a beginner, a vital tab, if you have come "from the street" and do not understand anything, then you (and me) are just there. Training materials can be divided into 3 types:
- Well-documented notepads (of other users), in which the options for a ready-made solution are described in steps and the logic that guided the author of the study is described.
- Links to interactive tutorials from DataCamp
- Just an article.
Notepads and interactive tutorials are presented for R and Python languages. And in the text articles they even add instructions on how to process data using Excel .
There are other useful pages, for example, “Data” . On this page you can download training and test sample files, as well as see an example of how the file should be uploaded to the portal for evaluation. Among other things, on this contribution there is a description of the data, decoding abbreviations and explanations, so I advise you to look.
It should be noted that when creating a notebook (tab "Kernels"), you can one-click download a set of data from an already existing competition.
Other tabs suggest you explore on your own.
How did I start?
At the beginning of the article I referred to the SS courses (which were more focused on R) and the self-help manual (Python-oriented), because I liked the book more, I chose Python.
There were many notebooks in Python, some were simpler, some on the contrary contained a lot of detailed material, I realized that I was not ready “right off the bat” right away and started from an interactive tutorial.
Part 3. “Good for someone who knows ...” - An interactive tutorial for solving a problem in Python
Good for someone who knows, but for me it is bad, so there was no way without a tutorial. So the link led me to this course: " Kaggle Python Tutorial on Machine Learning ". The course is free (although there is an annoying nuance).
What is the course? If someone came across a codecademy, then everything will be familiar to you. Left description and purpose, on the right is the task code and the Python console. There are almost no difficulties, the tasks are simple, you can send the code as many times as you like until you can, and if you’ve got enough, you can take a hint or get a ready answer (unless, of course, you are not a terrible RPG fan and you don’t feel like experience points)
The course consists of three chapters:
- The most basic basics of syntax and principles of analysis;
- Getting a rough model based on a decision tree (Decision Trees). In principle, after this chapter you will have a ready-made solution that you can download and upload to kaggle;
- In chapter three, you will use Random Forest to improve your predictions. This model can also be poured onto the kaggle;
Tutorial is simple and takes about an hour, well, a maximum of two.
I noticed that when completing the course after completing each chapter, I had a pop up window asking me to get a paid account and only then continue the course (I didn’t notice the close button, maybe it does), if it interferes with you, you can delete it using the tool “Viewing the element code” (available in almost any modern browser), you need to delete the Div with a class that will contain the word “modal”, for example, “modal-container”, after the window disappears, you can safely send the results and go to the next chapter.
I can’t say that the course is very informative, but the most minimal (just tiny) ideas about libraries for analyzing data in Python are given when I experimented with my notebook (below), I borrowed many techniques from them.
Part 4. "... How dangerous in the ocean" - a man with a "notepad" in Python
Having completed the online course, I decided that I would not respect myself if I would send those data sets that he offers, without even trying to dig in notebooks.
By the way, the platform allows you to "fork" your favorite notebook and experiment with it, or simply download the code for yourself in order to pick it up on your computer.
As I said, there are a lot of notebooks, I decided to choose the one that looked simpler to learn (translate, I didn’t want a big piece of text in English at two in the morning a little less than at all). So, I decided to borrow the code from " Machine Learning from Start to Finish with Scikit-Learn ", the author does not promise high prediction accuracy, but the main thing is not victory, but participation.
Honestly, I’ll use at least one solution in its original form, my hand didn’t rise, and I tried to dig at least a little code and try to write a couple of lines with my own hands, so I had a terrible monster from the code of the interactive tutorial and this notebook
So, I decided to edit the code on my computer (well, not just the way I put Anaconda in the last article). I will not spread my code entirely, it’s very shameful if someone wants to put Jupyter in his notebook, then each section of code is inserted into my own cell (but it’s better not, it will issue warnings) Something is a bad role model).
First of all, I stole a fragment of the data announcement
import numpy as np import pandas as pd import matplotlib.pyplot as plt import seaborn as sns from sklearn import tree %matplotlib inline data_train = pd.read_csv('data/train.csv') data_test = pd.read_csv('data/test.csv') data_train.sample(5) Then he borrowed the code for building a pair of diagrams, which the author had turned out to be quite visual. One showed the link between the survival rates of men and women from different points of departure:
sns.barplot(x="Embarked", y="Survived", hue="Sex", data=data_train); the second graph showed the same connection, but already relative, to the classes in which the passengers lived.
sns.pointplot(x="Pclass", y="Survived", hue="Sex", data=data_train, palette={"male": "blue", "female": "red"}, markers=["*", "o"], linestyles=["-", "--"]); Graphics are in the original notepad , so I will not upload pictures.
Then I decided that I was no worse and also tried to invent my own diagram.
I decided to check whether the status of the attendant and the class of stay somehow influence the probability of survival of a child under 18 years of age.
Since this sampling for pampering and in the calculations is not involved, I made a copy of the data and converted the data into the format I needed.
data_train2=data_train.copy() data_train2=data_train2[data_train2["Age"] <= 18] data_train2.Parch = data_train2.Parch.fillna("nanny") data_train2["Parch"][data_train2["Parch"] != 0] = 'parrents' data_train2["Parch"][data_train2["Parch"] != 'parrents'] = 'nanny' The result was something. This diagram either tells us that children in the 2nd passenger class who had a parent instead of a nanny survived much more often, or doesn’t say anything except that I made a mistake because in five days it’s not realistic to master data analysis = )
Let's go to the settlement part. Looking ahead, I will say that I uploaded my decision on kaggle 2 times to check the changes.
So, I realized that the code version from the interactive tutorial is not very convenient and in order not to produce a bunch of identical code, I decided to borrow from the author of the notebook, the option with writing functions:
def simplify_Age (df): df.Age = data_train.Age.fillna(0) def simplify_Sex (df): df["Sex"][df["Sex"] == 'male'] = 0 df["Sex"][df["Sex"] == 'female'] = 1 def simplify_Embarked (df): df.Embarked = df.Embarked.fillna(0) df["Embarked"][df["Embarked"] == "S"] = 1 df["Embarked"][df["Embarked"] == "C"] = 2 df["Embarked"][df["Embarked"] == "Q"] = 3 def simplify_Fares(df): df.Fare = df.Fare.fillna(0) Functions convert the data to digital format so that they can be “fed to the tree” later.
Then I applied these functions for the model being taught (data_train) and for the test model (data_test).
simplify_Age(data_train) simplify_Sex(data_train) simplify_Embarked(data_train) simplify_Fares(data_train) simplify_Age(data_test) simplify_Sex(data_test) simplify_Embarked(data_test) simplify_Fares(data_test) assigned target to tree
target = data_train["Survived"].values further action divided
# 2. , ( ) data_train["Family"]=data_train["Parch"]+data_train["SibSp"] data_test["Family"]=data_test["Parch"]+data_test["SibSp"] Option for the first model. I am not fully aware of what is happening here, apparently you can understand which tree he created and which parameters contribute more to the forecast.
# features . features = data_train[["Pclass", "Sex", "Age", "Fare"]].values d_tree = tree.DecisionTreeClassifier() d_tree = d_tree.fit(features, target) print(d_tree.feature_importances_) print(d_tree.score(features, target)) Now we will create a prediction for the test data set for the first model and save it in csv:
# test_features = data_test[["Pclass", "Sex", "Age", "Fare"]].values prediction = d_tree.predict(test_features) submission = pd.DataFrame({ "PassengerId": data_test["PassengerId"], "Survived": prediction }) print(submission) submission.to_csv(path_or_buf='data/prediction.csv', sep=',', index=False) Pick up from the .csv folder, go back to kaggle, click “Submit Predictions” and get 0.689 confidence. I can not say that it is good, but it’s the FIRST PREDICTION! After this, you can go to work in popular TV shows about psychics.
For the reasons I’ll talk about in the final part, I didn’t worry much about the quality of the model and didn’t use techniques to improve it from the online Data Camp course (and they are there).
However, to make the article clearer, let's look at one small improvement.
Above, I suggested a code with a comment: “# B2. the cell for the second model comes before the code that comes after (the first model did not apply) ”two lines of code after the comment can be inserted immediately (there will be no harm, but there will be no benefit either).
Why do we need these lines? I decided to test how the presence of a family (sisters, brothers, parents, etc.) will affect survival (the idea is largely taken from an interactive tutorial). So by combining the fields "satellites" and "relatives" (my free translation), I received the field "family"
Replace the features = data_train [["Pclass", "Sex", "Age", "Fare"]]. Values and test_features = data_test [["Pclass", "Sex", "Age", "Fare", "Family" "]]. Values at:
features = data_train[["Pclass", "Sex", "Age", "Fare","Family"]].values test_features = data_test[["Pclass", "Sex", "Age", "Fare","Family"]].values They added our family influence parameter, but otherwise everything will remain unchanged.
As I understand it, the print (d_tree.feature_importances_) command shows us the degree of contribution of each of the parameters to the final result of the model.
We get the following:
1. [0.08882627 0.30933519 0.23498429 0.29841084 0.06844342].
2. 0.982042648709 - It seems that this is the accuracy of the fit model
In line 1, the positions in the array correspond to “Pclass”, “Sex”, “Age”, “Fare”, “Family”. So, we see that our point about the family does not make much weather, but for curiosity we still fill in the updated result on kaggle.
And we find that our model, just a little, has increased the prediction accuracy, now it is 0.72727 . and this result is already in the region of 6800 place in the rating =)
You may have a question, how could the prediction accuracy in line 2 be as much as 0.98 or more? Why did you end up with 0.72 on the test sample? Apparently, the reason lies in the fact that the model is “retrained”, that is, too much sharpened, on predicting a sample from the data_train data set and when testing the data_test set does not show adequate flexibility. This problem should be solved by setting the parameters of our "tree", this is stated in the interactive course mentioned earlier, I did not do this in the framework of this article. We are simple people, 0.72 is enough for us, so let's move on to the final part.
Part 5. “Iceberg oncoming ships” - Conclusion
I never would have thought, but looking for dependencies in the data and trying to make predictions, it turns out to be a fascinating and quite exciting gamble! Despite the fact that it is difficult to start from scratch, and as I understand it, the almost complete lack of skills in the field of mate. analysis, statistics and the application of the theory of probability, more than once backfire on me, in general, at the initial stage, the process delays.
As you can see from the example of three articles, I showed that from absolute zero, you can be completely interested in the subject, and if you are a Python fan, you can completely skip the Cognitive Class version without much damage to understanding general concepts (although it’s free and you can basically two to spend on it, see the tools).
Nevertheless, in the process of preparing materials for these three articles, I realized that in order not to be painfully painful, it is necessary to move to a higher level of education.
Therefore, I think it makes sense to register for the course “Specialization Machine Learning and Data Analysis posted on Coursera” , at least it is in Russian, so you don’t have to puzzle over the translation of incomprehensible terms.
This is how casual curiosity threatens to grow into something more serious, in a couple of months, when I finish the course I will share with the respected readers my impression of it.
All good! Successfully strain your brains!
Source: https://habr.com/ru/post/331992/
All Articles