Using Pinba in Badoo: what you don't know yet

Hi, Habr! My name is Denis, I am a PHP developer at Badoo, and now I’ll tell you how we use Pinba ourselves. It is assumed that you already know what kind of tool it is, and you have experience in using it. If not, then for reference I recommend the article of my colleague, Maxim Matyukhin.
In general, there are enough materials on Habré about using Pinba in various companies, including the post of Oleg Efimov in our blog. But they all relate to other companies, not Badoo, which is a bit illogical: they themselves invented a tool, posted it in open source and do not share their experiences. Yes, we often mention Pinba in various publications and in reports at IT conferences, but usually it looks something like this: "But we got these wonderful graphs from data from Pinba" or "We used Pinba for measurement", and that's it. .
Communication with colleagues from other companies showed two things: firstly, quite a lot of people use Pinba, and secondly, some of them do not know or do not use all the features of this tool, and some do not fully understand its purpose. Therefore, I will try to tell you about those nuances that are not clearly indicated in the documentation, about the new features and the most interesting cases of using Pinba in Badoo. Go!
Small introduction
The documentation states that “Pinba is a statistics server that uses MySQL as an interface ...” Pay attention to the concept of “interface”, which is not used in the meaning of the data warehouse, but in the meaning of the interface. In the first versions of Pinba, the author of which was still Andrei Nigmatulin, there was no MySQL interface, and a separate protocol was necessary to obtain data. Which, of course, uncomfortable.
Later Anton Dovgal tony2001 added this functionality, which greatly facilitated the process of data acquisition. It became possible not to write any scripts, all MySQL clients need is to join the database and receive all the information using simple SQL queries. But at the same time inside Pinba stores data in its internal format, and the MySQL engine is used only for display. What does it mean? So this is what actually no real tables exist. "No spoons." You can even safely delete one of the so-called “raw” data tables, for example, requests - and after that all your reports will still work.
After all, the data itself will not disappear anywhere. You simply cannot access this table in SQL queries. That is why the main reason for using exactly the reports (and not the "raw" tables) is that with complex queries (several JOINs, etc.), Pinba must filter and group all the data on the fly.
I understand that, knowing SQL, you can easily get all the samples from the “raw” data tables, but this is the way to the dark side of the force. This method is extremely resource intensive. Of course, all queries will work, and often, when something is urgently needed, you can get into the table of requests or tags. But I really do not recommend doing it without need only because it is easier and faster. All the power of Pinba is in the reports.
It is quite simple to create reports, but even here there are some subtleties. As I have already said, no tables exist, and when you create a report, that is, execute a CREATE TABLE query, you only inform the service which aggregations you will need. And until the first request is made to this “table”, no aggregations will be collected. Here there is one important nuance: if you started collecting some data, and then they are no longer needed, then it is better to delete the “table” with the report. Pinba does not monitor whether you stopped using the report or not: once you requested data, it will always be collected.
Another point to consider when creating reports: for each type of report has its own set of fields. When displayed in MySQL, Pinba focuses on the order of the fields, and not on their names, so you can’t just take and swap fields or leave out some of the fields:
CREATE TABLE `tag_report_perf` ( `script_name` varchar(128) NOT NULL DEFAULT '', `tag_value` varchar(64) DEFAULT NULL, `req_count` int(11) DEFAULT NULL, `req_per_sec` float DEFAULT NULL, `hit_count` int(11) DEFAULT NULL, `hit_per_sec` float DEFAULT NULL, `timer_value` float DEFAULT NULL, `timer_median` float DEFAULT NULL, `ru_utime_value` float DEFAULT NULL, `ru_stime_value` float DEFAULT NULL, `index_value` varchar(256) DEFAULT NULL, `p75` float DEFAULT NULL, `p95` float DEFAULT NULL, `p99` float DEFAULT NULL, `p100` float DEFAULT NULL, KEY `script_name` (`script_name`) ) ENGINE=PINBA DEFAULT CHARSET=latin1 COMMENT='tag_report:perf::75,95,99,100' In this example, we create a report of type tag_report ; this means that the first field will always contain the name of the script, the value of the perf tag will follow, then the full set of all fields and at the end we need the percentages. This is the case when you do not need to fantasize, but simply take the structure of the table from the documentation and copy it. Naturally, the field with the name of the tags can and even should be called more clearly than tag1_value, tag2_value , and the order of the tags and percentiles in the table should match their order in the description.
Request Tag Aggregations
As you know, Pinba has several types of reports, and relatively recently (a year and a half ago) we added more reports on request tags. Prior to this, by request tags (do not confuse with timers tags, these are different things) it was only possible to filter, but there were no aggregations.
Why did we need such functionality? One of the main types of content in Badoo is photography. More than 350 million users use our service, most of whom have photos. In order to upload photos, we have two types of machines: the so-called photokegs — machines with “fast” disks, on which only the actively requested images lie, and the main “clusters” - machines, where all the photos are stored.
Read more about the photo storage system told on the last HighLoad ++ Artem Denisov. If we give up caching and allow all traffic to the “slow” photo storage, then at best the photo upload time will increase, at worst - we won't be able to give content from some machines at all, and requests will fall off due to a timeout. Now we have about 98% trickrate.
It would seem that everything is very good, but a drop in the cunning rate, say, to 96% immediately increases the load on the photo storage cluster by two times. Therefore, it is very important for us to follow the trick rate and to avoid significant falls. And we decided to do this with Pinba. Since PHP is not used on machines with photo caches (all content is delivered via a web server), we use the Pinba plugin for nginx .
But here's a bad luck - inside nginx we cannot use timers and aggregation of timer tags, but we can actively tag the request itself. And we really wanted to make a breakdown by the size of the images, by the type of application and by several other parameters. A query can have multiple tags, and we need to aggregate all of them. For this purpose the following types of reports were created:
rtag_info- aggregation by one tag,rtagN_info- multiple tag aggregation,rtag_report- aggregation by one tag and host,rtagN_report- aggregation by several tags and host.
Here are examples of reports:
CREATE TABLE `photoscache_report_hitrate` ( `hostname` varchar(64) NOT NULL DEFAULT '', `tag1_value` varchar(64) DEFAULT NULL, `tag2_value` varchar(64) DEFAULT NULL, `tag3_value` varchar(64) DEFAULT NULL, `req_count` int(11) DEFAULT NULL, `req_per_sec` float DEFAULT NULL, `req_time_total` float DEFAULT NULL, `req_time_percent` float DEFAULT NULL, `req_time_per_sec` float DEFAULT NULL, `ru_utime_total` float DEFAULT NULL, `ru_utime_percent` float DEFAULT NULL, `ru_utime_per_sec` float DEFAULT NULL, `ru_stime_total` float DEFAULT NULL, `ru_stime_percent` float DEFAULT NULL, `ru_stime_per_sec` float DEFAULT NULL, `traffic_total` float DEFAULT NULL, `traffic_percent` float DEFAULT NULL, `traffic_per_sec` float DEFAULT NULL, `memory_footprint_total` float DEFAULT NULL, `memory_footprint_percent` float DEFAULT NULL, `req_time_median` float DEFAULT NULL, `index_value` varchar(256) DEFAULT NULL, KEY `hostname` (`hostname`) ) ENGINE=PINBA DEFAULT CHARSET=latin1 COMMENT='rtagN_report:served_by,build,img_size' CREATE TABLE `photoscache_top_size` ( `geo` varchar(64) DEFAULT NULL, `req_count` int(11) DEFAULT NULL, `req_per_sec` float DEFAULT NULL, `req_time_total` float DEFAULT NULL, `req_time_percent` float DEFAULT NULL, `req_time_per_sec` float DEFAULT NULL, `ru_utime_total` float DEFAULT NULL, `ru_utime_percent` float DEFAULT NULL, `ru_utime_per_sec` float DEFAULT NULL, `ru_stime_total` float DEFAULT NULL, `ru_stime_percent` float DEFAULT NULL, `ru_stime_per_sec` float DEFAULT NULL, `traffic_total` float DEFAULT NULL, `traffic_percent` float DEFAULT NULL, `traffic_per_sec` float DEFAULT NULL, `memory_footprint_total` float DEFAULT NULL, `memory_footprint_percent` float DEFAULT NULL, `req_time_median` float DEFAULT NULL, `index_value` varchar(256) DEFAULT NULL, `p95` float DEFAULT NULL, `p99` float DEFAULT NULL ) ENGINE=PINBA DEFAULT CHARSET=latin1 COMMENT='rtag_info:geo:tag.img_size=top:95,99' (yes in the last report we aggregate by geo tag and filter by img_size tag).
In the nginx configuration files, install the necessary tags:
location ~ '.....' { ... pinba_tag fit_size '500x500'; pinba_tag is_fit 1; pinba_tag img_size '920'; … - and in the end we can get these charts:
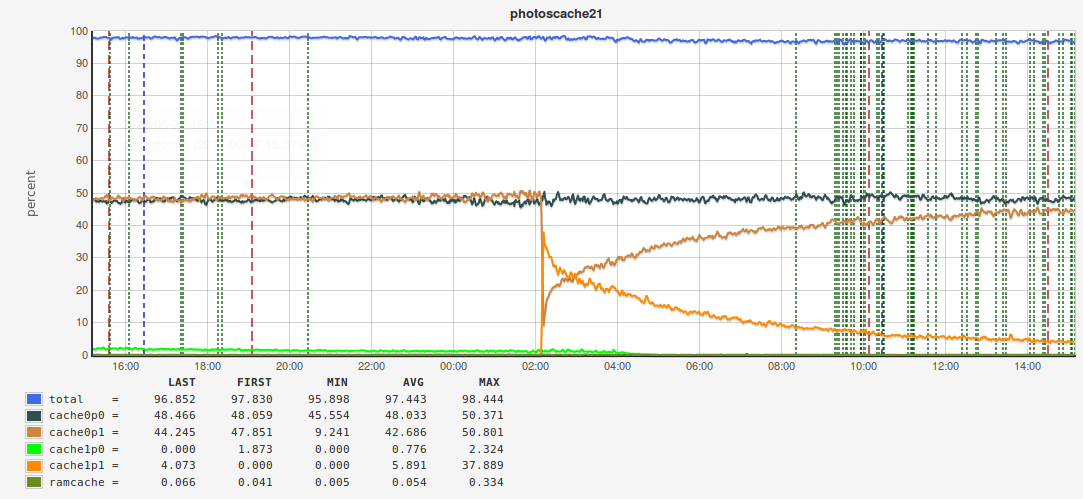
We smoothly moved to examples of use. I will not focus on rather trivial examples - I’ll just list some basic things that we monitor with Pinba:
- the number and time of requests for PHP clusters;
- memory consumption by PHP scripts;
- request time to all external services (C, Go, Memcached, MySQL daemons, etc.);
- using the nginx plugin, monitor the number of requests per second and the time of each request to nginx, broken down by response status;
- other.
Queue Monitoring
In almost every more or less serious project, sooner or later the task of processing the queue of events arises. Certain user actions on the site initiate the dispatch of an event, to which several handlers can be subscribed, and each of them has its own queue. We have this process divided into three parts:
- transport - events from all hosts are collected and sent to the machine where the script cloner runs, which clones the events into a queue for each subscriber;
- queue: the event is in the queue (we use both MySQL and other brokers for queues, for example, Darner);
- processing: the event reached the subscriber and begins to be processed.
At some point, we wanted to measure how much time passes from the moment an event is generated until it is processed. The problem is that this is not just one PHP script, but several different scripts (in general, not even PHP): in one event it rushes, in the other - the event is sent to the queue to the processor, finally, the script processor itself that gets the event from the queue. How to be? In fact, everything is very simple. At the time of generating the event, we fix the time and write it into these events, and then at each stage we remember the difference between the time of sending and the current time. As a result, at the very end, when the event is processed, we have all the necessary timer values that we send to Pinba. As a result, we can make this report:
CREATE TABLE `tag_info_measure_cpq_consumer` ( `type` varchar(64) DEFAULT NULL, `consumer` varchar(64) DEFAULT NULL, `timer` varchar(64) DEFAULT NULL, .... ) ENGINE=PINBA DEFAULT CHARSET=latin1 COMMENT='tagN_info:type,consumer,timer' where timer is the name of the timer for a certain stage of event processing, consumer - the name of the subscriber, type - in our case, this is the type of event dispatch (within one site or inter site) (we have two sites with the same infrastructure - in Europe and in the USA, and events can depart from site to site).
With the help of this report, we got these charts:

In this example, the event updates the user’s coordinate data. As you can see, the whole process takes less than five seconds. This means that when you came to your favorite bar, opened the Badoo application and tried to find users nearby, they will really show you who is now in this place, and not where you were half an hour ago (of course, if your mobile device sends your location data).
This principle (to collect all the timers, and then send them to Pinba) is used in Jinba. Jinba is our project to measure client-side performance, which is based on Pinba; stands for javascript is not a bottleneck anymore. More information about Jinba can be found in the report of Pavel Dovbush and on the project website .
We collect all the timers on the client and then send them to the PHP script in one request, which already sends everything to Pinba. In addition to standard report types, we actively use histograms in Jinba. I will not talk in detail about them - let me just say that, thanks to the functionality of the histograms, we have the opportunity to indicate percentiles in the reports.
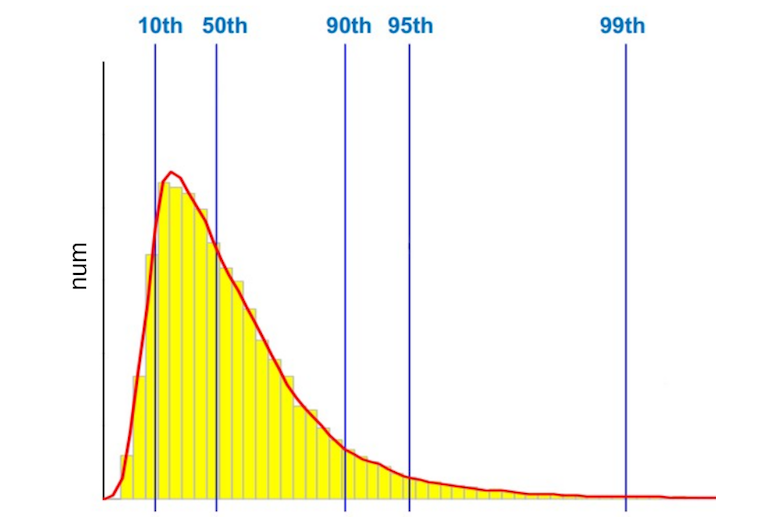
By default, Pinba divides the entire time interval into which the requests fell into 512 segments, and in the histogram we save the number of queries that fell into one or another segment. I have already said that we measure the time of the PHP scripts, the response time of nginx, the time of accessing external services, etc. But what time do we measure? For example, per second there were 1000 requests for a script, respectively, we have 1000 different values. Which of them need to be displayed on the chart? The majority will say: “Average arithmetic”, - someone will say that you need to look at how many slowest queries are executed. Leave this question outside of this post. For those who do not know what percentile is, let me give you the simplest example: the 50th percentile (or median) is a value where 50% of queries are executed in a time that does not exceed this value.
We always measure the arithmetic mean and the highest percentiles: the 95th, 99th, and even the 100th (the highest query execution time). Why are senior percentile so important to us? Here is an example of a graph with the answers of one of our external services:
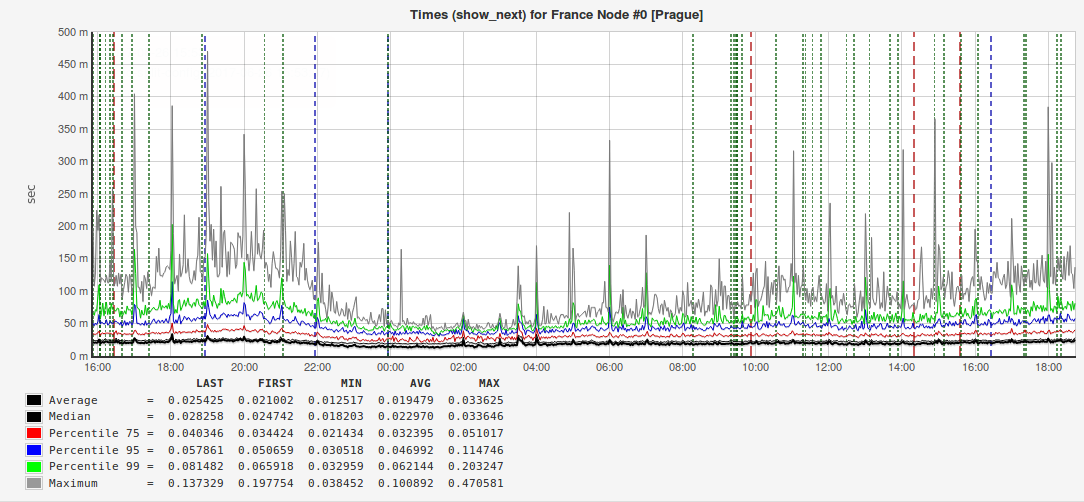
It can be seen from the figure that both the arithmetic mean and the median (50th percentile) are approximately two times smaller than the 95th percentile. That is, when you make a report for management or speak at a conference, it will be advantageous to show exactly this request time, but if you want to make users happier, then it will be more correct to pay attention to 5% of slow requests. There are cases when the value of the 95th percentile is almost an order of magnitude higher than the average, which means that somewhere there is a problem that needs to be found and fixed.
MySQL is not a bottleneck anymore
Since we are monitoring requests to all external services, naturally, we cannot ignore database requests. We use MySQL in Badoo. When we had the task of monitoring it, we first decided to use Slowlog + Zabbix. But it turned out to be very inconvenient. Slowlog can be very large, and it is often difficult to find the cause of the problem in it, especially when it needs to be done quickly. Therefore, we began to consider commercial solutions.
At first glance, everything was fine, but it was embarrassing that the trial version worked only on a limited number of servers (an order of magnitude smaller than ours on the same site), and there was a risk that a solution could make money on the whole cluster.
Simultaneously with the testing of a commercial solution, our DBA (by the way, we have only two of them: main and backup, or master and slave) made their own development. They used performance_schema , scripts in Python, sent all this to Elastic, and used Kibana for reports. And, oddly enough, everything worked, but to make monitoring of our entire MySQL cluster would require an Elasticsearch cluster of comparable power.
Unfortunately, even in Badoo, you can’t get a hundred extra machines for a cluster on the click of your fingers. And here we remembered Pinba. But the following caveat arose: how to save information about a SQL query in Pinba? Moreover, you need to save information not about a specific query, but about a “pattern” of a query, that is, if you have 1000 queries of the form Select * from table where field = field_value , and the field_value field is different in each of them, then you need to Pinba save pattern data Select * from table where field = #placeholder# . To do this, we refactored all the code and everywhere, where in SQL the field values were substituted directly in the code, we put the placeholders. But still, the request template may be too large, so we take a hash for each template and it is its value that goes to Pinba. Accordingly, in a separate table we store the “hash - template text” bundles. Pinba created this report:
CREATE TABLE `minba_query_details` ( `tag_value` varchar(64) DEFAULT NULL, ... `p95` float DEFAULT NULL, `p99` float DEFAULT NULL ) ENGINE=PINBA DEFAULT CHARSET=latin1 COMMENT='tag_info:query::95,99' In the PHP code, we create an array of tags for each request:
$tags = [ 'query' => $query_hash, 'dest_host' => 'dbs1.mlan', 'src_host' => 'www1.mlan', 'dest_cluster' => 'dbs.mlan', 'sql_op' => 'select', 'script_name' => 'demoScript.php', ]; Naturally, there should be one place in the code where the query to the database is executed, a certain wrapper class; mysqli_query course, you cannot directly call the mysql_query or mysqli_query methods.
In the place where the request is executed, we count the time of the request and send the data to Pinba.
$config = ['host' => 'pinbamysql.mlan', 'pinba_port' => 30002]; $PinbaClient = new \PinbaClient($config); $timer_value = /*Execute query and get execution time */ $PinbaClient→addTimer($tags, $timer_value); /* Some logic */ $PinbaClient->send(); Note the use of the \PinbaClient class. If you compiled PHP with Pinba support, then you will have this class out of the box (if you use non-PHP, then other languages have their own analogues of this class). It is clear that there will be a lot of queries to the database, and writing to the same Pinba server where the script statistics are collected will fail. Hamster will burst. In the settings of php.ini you can specify only one Pinba host, where data will be sent upon completion of the script. And then the \PinbaClient class comes to \PinbaClient . It allows you to specify an arbitrary host with Pinba and send timer values there. By the way, we also use a separate Pinba server to monitor the queues. Since the data in Pinba stores a limited amount of time, the table with a bunch of “hash - SQL template” stores only actual hashes.
There are really a lot of requests, so we decided to send to Pinba every second. This is about one hundred and fifty thousand requests per second. And it works. At any moment we can see which requests on which hosts slow down, which requests have appeared, which requests are being executed very much. And these reports are available to every employee.
Another non-trivial case for using Pinba is the monitoring of the memkey cache. At each site we have a cluster of machines with Memcached, and it was necessary to understand whether we effectively use memkes. The problem is that we have a lot of different keys, and the amount of data for each of them varies from a few bytes to hundreds of kilobytes. Memkesh breaks all the memory provided to him into pages, which are then distributed among the weak (slabs). A weak is a fixed amount of memory allocated for one key. For example, the third is weakly 152 bytes in size, and the fourth is 192 bytes. This means that all keys with data from 152 to 192 bytes will be in the fourth weaker. Under each weakly allocated a certain number of pages, each divided into pieces (chunks), equal to the size of the weak. Accordingly, a situation may arise when some weaknesses are allocated more pages than necessary, and the trickrate on these keys is quite high, and on the other keys, the trickrate can be very low, while the memke has enough free memory. To avoid this, you need to redistribute the pages between the weak. Accordingly, we need to know the trick of each key at a given time, and for this we also use Pinba.
In this case, we acted similarly to monitoring requests to MySQL - refactored and brought all keys to “key_family”:%s_%s , that is, we selected the unchangeable part (key family) and separated it with a colon from the parts to be changed, for example, messages_cnt:13589 (the number of messages with the user ID 13589) or personal_messages_cnt:13589_4569 (the number of messages from the user 13589 to the user 4569).
In the place where the data is read by key, we form the following array of tags:
$tags = [ 'key' =>'uc', 'cluster' => 'wwwbma', 'hit' => 1, 'mchost' => 'memcache1.mlan', 'cmd' => 'get', ]; where key is the key family, cluster is a cluster of machines from which the request is sent to the memkey, hit is the data in the cache or not, mchost is the host with the memkey, cmd is the command that is sent to the memkey.
And in Pinba this report was created:
tag_info_key_hit_mchost | CREATE TABLE `tag_info_key_hit_mchost` ( `key` varchar(190) DEFAULT NULL, `hit` tinyint(1) DEFAULT NULL, `mchost` varchar(40) DEFAULT NULL, ... ) ENGINE=PINBA DEFAULT CHARSET=latin1 COMMENT='tagN_info:key,hit,mchost', thanks to which we were able to build these charts:
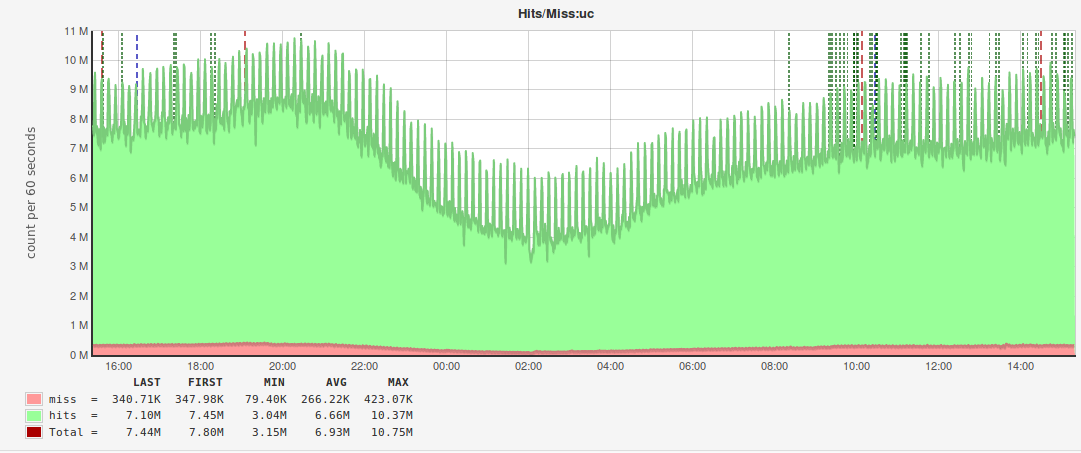
By analogy with monitoring MySQL, a separate Pinba instance is used for these reports.
Sharding
With the increase in the number of users and the development of functionality, we are faced with a situation where Pinba could no longer cope on the most heavily loaded PHP cluster where requests from mobile devices arrive. The solution we found is very simple - to raise several Pinba services and a “round of robin” to send data to an arbitrary one. The difficulty here is one - how to collect data then? When collecting data, we created a “merge” rule for each field type. For example, the number of queries are summed, and for percentile values, the maximum is always taken, etc.
Summary
First, remember that Pinba is not a data warehouse. Pinba is not about storage at all, but about aggregation, so in most cases it is enough to select the desired type of report, specify a set of percentiles - and you will receive the necessary sample in real time.
Secondly, do not unnecessarily use tables with “raw” data, even if everything works for you and nothing slows down.
Third, do not be afraid to experiment. As practice shows, using Pinba can solve a wide range of tasks.
PS , Pinba, , . PHP.
')
Source: https://habr.com/ru/post/331866/
All Articles