Translation of the Appium Essentials book. Chapter 3
Chapter 3. Appium GUI.
This chapter discusses the GUI for the Appium server. By the end of the chapter, we must understand all the possibilities of the application.
Content:
')
And here we have links to
- chapter 1
- and chapter 2
Go!
Appium developers are well designed GUI for the server. Using this GUI, we can easily start the server with all the settings we need [Desired capabilities from Chapter 1]. The GUI allows you to set up the environment before running tests.
This is what Appium GUI looks like. It has the following buttons / icons:

By clicking on Android Settings, we will see various options that we may need before running the tests. All fields are distributed across the Application, Launch Device, Capabilities and Advanced sections:
List of fields in the section with explanations:
Click on the second icon to open general settings. Here, the fields are also divided into categories: Server and Logging:
[Obviously, much is not required here. They were not there. Here you can see the version of Appium]

Appium Inspector allows you to define elements on the page. Also available is the ability to record and replay actions, as in Selenium IDE, but the current version does not work very well on Windows. To open the Inspector, you need to click on the icon, but first you need to run the application on the device:
Using the Inspector, we can look at the layout of the application, but it's still difficult to determine the elements. On Windows, UIAutomator is much more powerful than Appium Inspector in defining elements. In the next chapter, we will learn more about UIAutomator.
Starts / stops the Appium server.
Located in the lower right; removes logs from the console.
For Mac, Appium has a similar Android automation GUI; Many options are the same as on Windows. Let's look at all the settings in the GUI.
It contains the following icons:
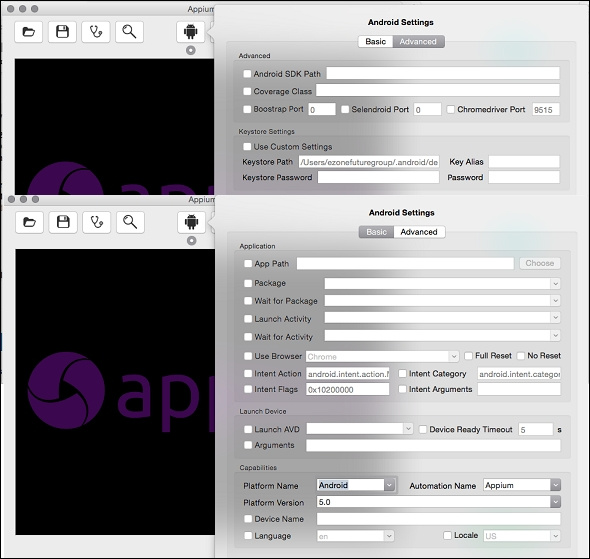
We have already seen the settings for Android on Windows; on Mac OS, the settings are the same, but there are some UI differences, the screenshot below. Android settings are divided into two tabs: Basic and Advanced.
To set up iOS, we need to click on the iOS icon. It contains two tabs: Basic and Advanced. The Basic tab contains the Application and Device Settings sub-sections, and the Advanced tab contains advanced iOS settings.

Advanced
Robot Settings
If you want to use a robot in automation [it’s not very clear which one], you can set the settings in Robot Settings. In the Robot Settings section, Appium asks the host and port to which the robot is connected:
Save / Open configuration
Appium supports the ability to save settings; we will not have to determine the settings again and again when testing. The option allows you to mark a file with a tag, and then it is easy to find it [MacOS tags, apparently].
To save the settings file, you need:
The saved configuration can be easily restored from a file by clicking the Open button.
Appium doctor
Prompts about setting Appium; You can check the setting using Appium doctor. Click on the Doctor icon; the console displays information.
If something is not configured or not installed, an entry will appear. Try to fix the problem before running Appium.
Inspector
The inspector allows us to easily generate an autotest script. It shows all elements of the application, like UIAutomator on Android. Now let's take a closer look at the Inspector. For example, let's take the BMI calculator - an application on iOS. First, you need to click on the Save button and we must set the path to the application.
In the Appium Inspector window, you can see the following fields:
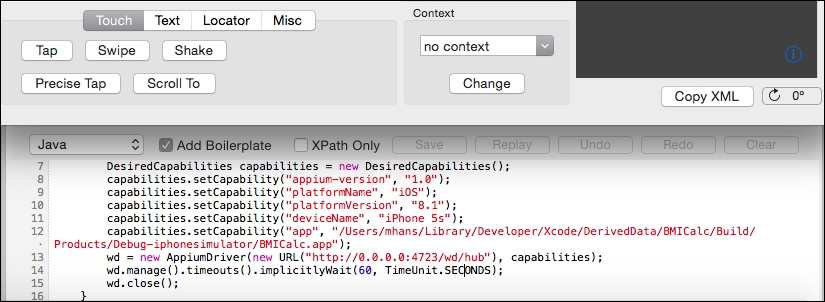
You will find several more tabs, such as Touch, Text, Locator and Misc, which define actions with the application.
Briefly about them:
Record Panel
The panel contains test scripts generated by the recorder based on the actions performed. Also contains recorder-specific options:
In the next chapter, we will look at how to identify items on the mobile app
This chapter discusses the GUI for the Appium server. By the end of the chapter, we must understand all the possibilities of the application.
Content:
')
- Appium GUI for Windows
- Appium GUI for Mac
And here we have links to
- chapter 1
- and chapter 2
Go!
Appium GUI for Windows
Appium developers are well designed GUI for the server. Using this GUI, we can easily start the server with all the settings we need [Desired capabilities from Chapter 1]. The GUI allows you to set up the environment before running tests.
This is what Appium GUI looks like. It has the following buttons / icons:
- Android settings
- General settings
- Developer Settings
- Info
- Inspector
- Run / Stop
- Clear [logs]
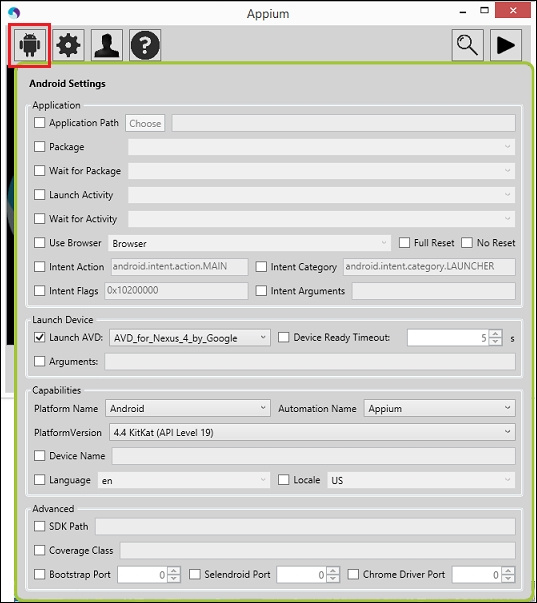
Android settings
By clicking on Android Settings, we will see various options that we may need before running the tests. All fields are distributed across the Application, Launch Device, Capabilities and Advanced sections:
Application
List of fields in the section with explanations:
| Field | Description |
| This is the path to the .apk file you want to test. | |
| Specifies the package to run. For example, com.android.calculator2. | |
| This feature waits for the launch of the package specified in the Package field. | |
| You can specify the activation you want to run in the application. For example, MainActivity. | |
| Allows you to select a browser from the list to launch. | |
| Deleting the application at the end of the session | |
| Prevents device reset. | |
| Used to start activating | |
| Intent category | |
| Sets the start flags of the activation. [You can read about flags here .] | |
| Here you can set additional arguments at the start of the activation |
Launch Device
| Field | Description |
| This is the name of the AVD to run. | |
| Timeout (in seconds) waiting for device readiness | |
| Emulator startup arguments |
Capabilities
| Field | Description |
| Specifies the name of the platform on which the application will run. | |
| Automation tool name (can choose from the list) | |
| This indicates the version of Android on which the application will be tested. | |
| The name of the device. | |
| The language that will be set on the Android device. | |
| Locale to be set on Android. |
Advanced
| Field | Description |
| The path to the Android SDK. | |
| This is where the tool class is defined [more later]. | |
| The port on which the Appium will hang. | |
| Selendroid port. | |
| ChromeDriver port [if needed]. |
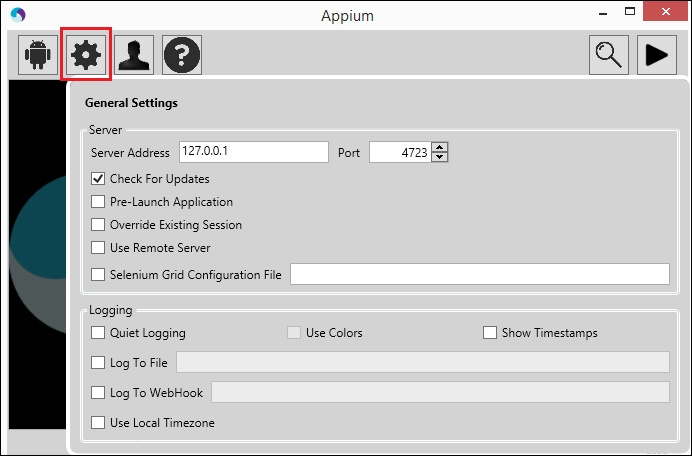
General Settings
Click on the second icon to open general settings. Here, the fields are also divided into categories: Server and Logging:
Server
| Field | Description |
| The IP address where the Appium server is running. | |
| The port on which the Appium server will transmit commands. By default: 4723. | |
| If selected, Appium will automatically check for updates. | |
| Allows you to run the application on the device before it starts listening to commands from WebDriver. | |
| If active, current sessions will be recreated, if any. | |
| If the Appium server is running on a different machine, you can use this option to enable the Appium Inspector. | |
| You can set the path to the config file for Selenium Grid. |
Logging
| Field | Description |
| Sets the logging level. | |
| The output to the console will be accompanied by a date-time recording. | |
| The output log will be saved in the specified file (for example, C: \\ appium \\ abc.log). | |
| The log will be sent via HTTP listener. | |
| If you select this option, the local time zone will be used, otherwise the node-server time zone will be used. |
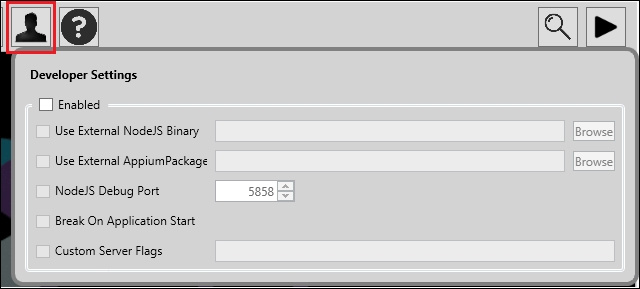
Developer settings
| Field | Description |
| Developer settings will be available if the check box is selected. | |
| If you have a different version of Node.js, different from the one installed with Appium, you can use it. Need to set the path. | |
| Here you can set the Appium package, if you have your own [after all, open source]. | |
| The port on which the debugger will be launched Node.js. | |
| As soon as the application on the device starts up, the Node.js debugger will stop. | |
| Here you can transfer flags to the server for launch (for example, --device-name Nexus 5). [I understand this is about these flags] |
About
[Obviously, much is not required here. They were not there. Here you can see the version of Appium]
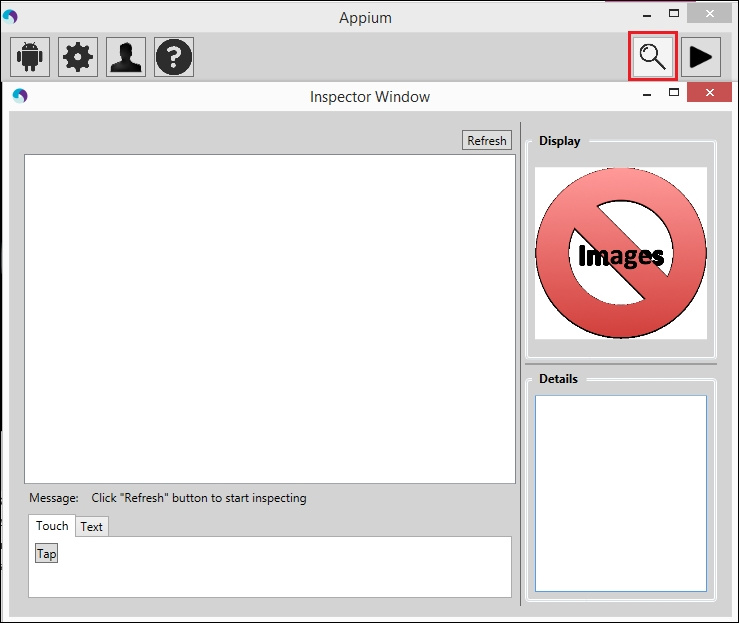
Inspector
Appium Inspector allows you to define elements on the page. Also available is the ability to record and replay actions, as in Selenium IDE, but the current version does not work very well on Windows. To open the Inspector, you need to click on the icon, but first you need to run the application on the device:
Using the Inspector, we can look at the layout of the application, but it's still difficult to determine the elements. On Windows, UIAutomator is much more powerful than Appium Inspector in defining elements. In the next chapter, we will learn more about UIAutomator.
The Launch / Stop button
Starts / stops the Appium server.
The clear button
Located in the lower right; removes logs from the console.
The Appium GUI for Mac
For Mac, Appium has a similar Android automation GUI; Many options are the same as on Windows. Let's look at all the settings in the GUI.
It contains the following icons:
- Android Settings
- iOS Settings
- General Settings
- Developer Settings
- Robot Settings
- Save configuration
- Open configuration
- Inspector
- Appium doctor
- Launch / Stop
- Delete
Android Settings
We have already seen the settings for Android on Windows; on Mac OS, the settings are the same, but there are some UI differences, the screenshot below. Android settings are divided into two tabs: Basic and Advanced.
iOS Settings
To set up iOS, we need to click on the iOS icon. It contains two tabs: Basic and Advanced. The Basic tab contains the Application and Device Settings sub-sections, and the Advanced tab contains advanced iOS settings.
Application
| Field | Description |
| This is the path to the iOS application (.app, .zip, or .ipa) that we want to test. | |
| Sets the ID of the bundle. | |
| If you are testing a mobile web application, you can select this option to launch Safari. Make sure that the BundleID and App Path are not selected. |
Device Settings
| Field | Description |
| You can choose an iPhone or iPad simulator. | |
| Used to select the platform version. | |
| Indicates the screen orientation on the simulator. | |
| Set the language on the simulator. | |
| The format of the calendar on the simulator. | |
| Locale simulator. | |
| If the UDID checkbox is selected, Appium will launch the app on the connected iOS device; you need to make sure that the bundleID is installed, and the App Path is not selected. | |
| Deletes the entire folder of the simulator. | |
| Indicates that. that the simulator should not be restarted between sessions. | |
| Logs of the simulator will be recorded in the console. |
Advanced
| Field | Description |
| If selected, Appium will give preference to the native tool library. | |
| We can determine the number of attempts to launch tools before reporting crash or timeout. | |
| In milliseconds, determines how many tools must wait for a launch. | |
| The template file to be used by the tools. | |
| Path to Xcode. |
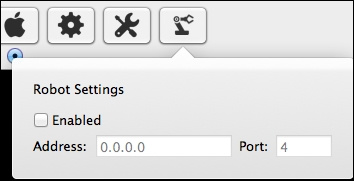
Robot Settings
If you want to use a robot in automation [it’s not very clear which one], you can set the settings in Robot Settings. In the Robot Settings section, Appium asks the host and port to which the robot is connected:
Save / Open configuration
Appium supports the ability to save settings; we will not have to determine the settings again and again when testing. The option allows you to mark a file with a tag, and then it is easy to find it [MacOS tags, apparently].
To save the settings file, you need:
- Click on the Save button.
- Set file name
- Click on the Tags textbox; a list of tags appears. We can choose more than one.
- Choose a location to save the file.
The saved configuration can be easily restored from a file by clicking the Open button.
Appium doctor
Prompts about setting Appium; You can check the setting using Appium doctor. Click on the Doctor icon; the console displays information.
If something is not configured or not installed, an entry will appear. Try to fix the problem before running Appium.
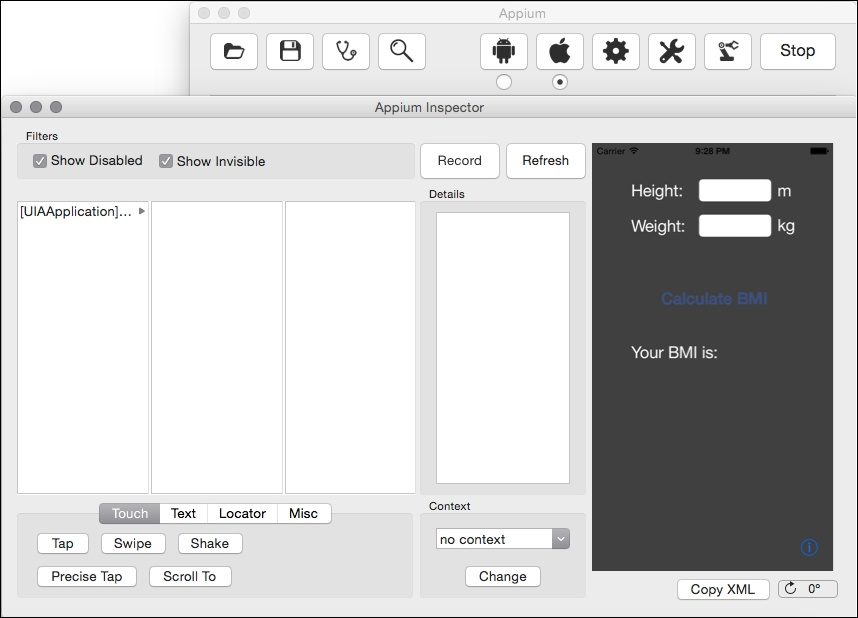
Inspector
The inspector allows us to easily generate an autotest script. It shows all elements of the application, like UIAutomator on Android. Now let's take a closer look at the Inspector. For example, let's take the BMI calculator - an application on iOS. First, you need to click on the Save button and we must set the path to the application.
In the Appium Inspector window, you can see the following fields:
- Show inactive - shows inactive items.
- Show invisible - shows hidden items
- Recording - will open the recording panel and you will be able to perform the actions provided by the Appium Inspector
- Refresh - updates the DOM in 3 columns in accordance with the viewer
- Screenshot - this area displays the current screenshot of the application. You can click on an element on the screen to select it in the DOM.
- Details - details about the selected item.
You will find several more tabs, such as Touch, Text, Locator and Misc, which define actions with the application.
Briefly about them:
| Field | Description |
| Contains buttons to simulate actions: tap, swipe, scroll and shake [shake the device]. | |
| Here, working with text: entering text and executing JavaScript. | |
| Useful option from Appium. Using it, we can verify that our locator returns an element. | |
| Buttons to handle different alerts. |
Record Panel
The panel contains test scripts generated by the recorder based on the actions performed. Also contains recorder-specific options:
| Field | Description |
| You can select the PL, where you want to get a test script (Java is selected in the screenshot). | |
| If selected, the script will contain the code responsible for raising the Selenium instance. If not, only the recorded steps themselves. | |
| Plays the recorded script. | |
| Buttons to handle different alerts. |
In the next chapter, we will look at how to identify items on the mobile app
Source: https://habr.com/ru/post/331714/
All Articles