GUI on Grafana for mgstat - system monitoring utilities on InterSystems Caché, Ensemble or HealthShare
Good day! This article is a continuation of the article " Friends of Prometheus with Caché ". We will consider the option of visualization of the results of the work of the ^ mgstat utility . This utility provides Caché performance statistics, namely, the number of global and routine calls, local and ECP , the length of the write daemon queue, the number of blocks written to disk and read from disk, the amount of ECP traffic, and so on. ^ Mgstat can be launched either separately (interactively or by a job ), or when another performance evaluation utility ^ pButtons is running .
The presentation of the material I would like to break into two parts: in the first graphically show the statistics collected ^ mgstat, and in the second - to consider exactly how these statistics are collected. In short, $ zu functions are used . However, to the majority of parameters collected there is an object interface through the classes of the SYS.Stats package. And not all parameters that can be collected are shown in ^ mgstat. In the future, we will try to display all of them on the Grafana boards. At the same time, we show only what ^ gstat itself provides us. In addition, try to taste Docker-containers.
The first part describes how to install Prometheus and Grafana from tarballs. We will show how you can start the same monitoring server using Docker features. Demonstration host machine:
Two more virtual machines (192.168.42.131 and 192.168.42.132) will be used in the VMWare Workstation Pro 12.0 environment, both with Caché on board. We will monitor them. Versions:
On the host machine, install Docker and run it:
Download the latest Prometheus image:
If we look at the Docker file , we will see that the image reads the config from its /etc/prometheus/prometheus.yml file, and stores the collected metrics in the / prometheus directory:
When launching Prometheus in the Docker container, we specify the configuration file and the database for metrics to be taken from the host machine. This will allow us to “survive” the restart of the container. Create directories for Prometheus on the host machine:
Create a Prometheus configuration file:
Now you can run the container with Prometheus:
Check that it starts up normally:
First, download the last image:
Then we run it, indicating that the Grafana database (by default, this is SQLite) will be stored on the host machine. We also link to the container with Prometheus, so that you can refer to the container with Prometheus from the container with Grafana:
Both containers are running one by one. A more convenient way to launch multiple containers at once seems to be using Docker-compose . We will install it, stop the current both containers, configure their launch via Docker-compose and launch it again.
After launching Grafana for the first time, two things need to be done: change the admin password to the web interface (by default, the login / password is admin / admin) and add Prometheus as a data source. This can be done either from the web interface, or by directly editing the Grafana SQLite database (it defaults to the file /opt/grafana/db/grafana.db), or by REST requests .
^ mgstat writes output to a file and online to a terminal. We do not need output to the file. Therefore, with the help of Studio, we will create and compile in the USER area the program ^ mymgstat.int, with a reduced code ^ mgstat.
In order to be able to call the program ^ mymgstat via REST, we are doing a wrapper class for it in the USER area.
Now that we have a class that provides metrics, we can create a RESTfull web application. As in the first article, we will assign a resource to this web application and create a user who can use this resource and on whose behalf Prometheus will collect metrics. Let's give the user more rights to certain databases. Compared to the first article, the right to write to the CACHESYS database has been added (to avoid the error <UNDEFINED> loop + 1 ^ mymgstat * gmethod ") and the ability to use the% Admin_Manage resource has been added (to avoid the <PROTECT> gather + 10 ^ error mymgstat * GetProperty % SYSTEM.ECP "). We will do these steps on two virtual servers, 192.168.42.131 and 192.168.42.132. Naturally, we will preload our code, the program ^ mymgstat and the class my.Mgstat into the USER area on that and on another server (the code is on github ).
Prometheus is listening to port 9090 here. First we check the status of Targets:

Then we look at any of the metrics:

We now show one metric, for example, isc_cache_mgstat_global_refs, in the form of a graph. We will need to add a panel and insert a graph into it. Go to Grafana ( http: // localhost: 3000 , login / pass - admin / TopSecret) and add the panel:

Add a chart:

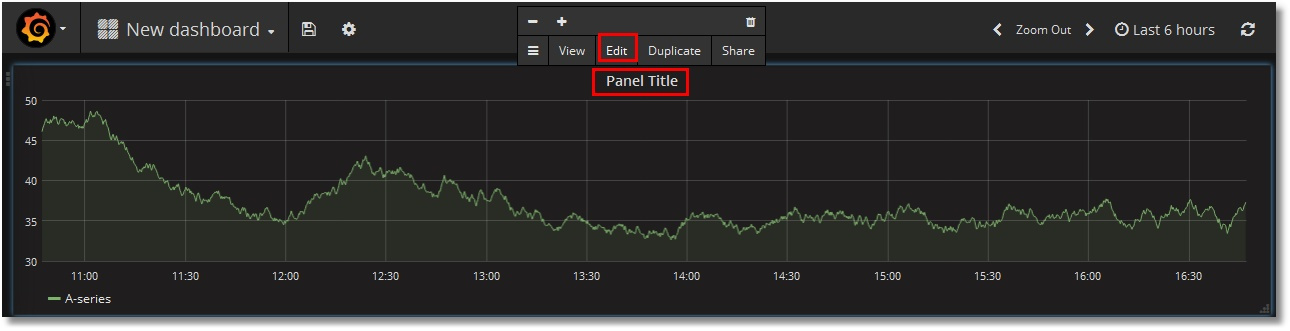
Edit it by clicking “Panel title”, then “Edit”:
Specify Prometheus as the data source and select our isc_cache_mgstat_global_refs metric. Resolution choose 1/1:

Give the name of the schedule:

Add a legend:

Click on the top button “Save” and give the name of the dashboard:

We get something like this:

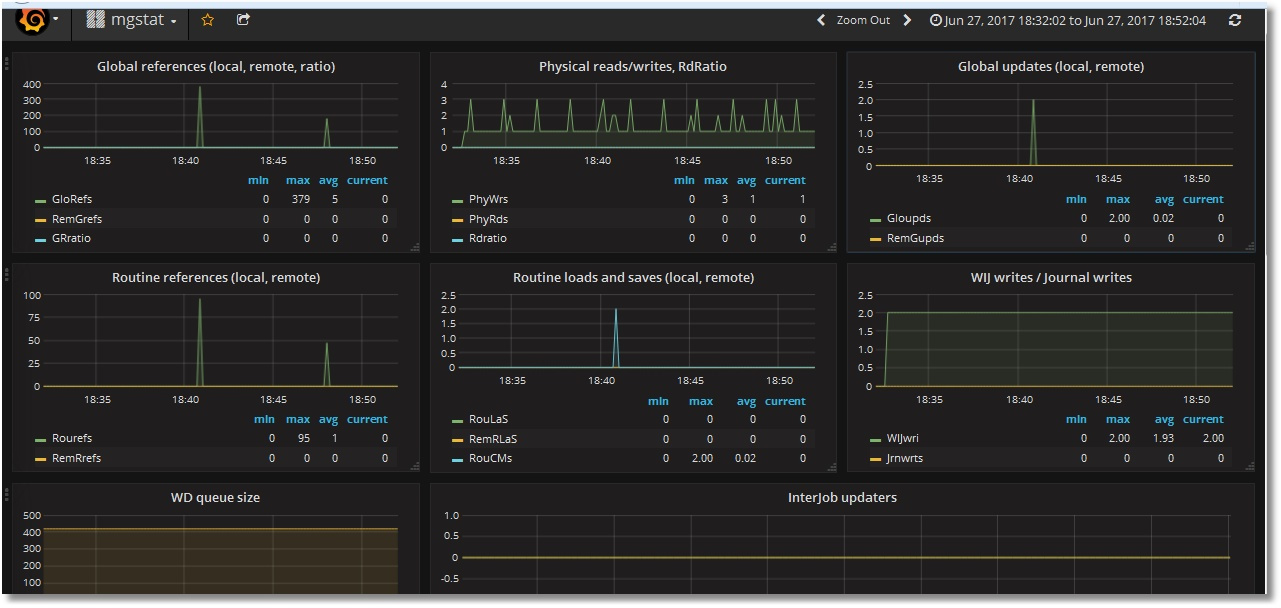
Similarly, let's throw in the rest of the metrics. Among them will be two text metrics - Singlestat . We will get such a dashboard (upper and lower parts are shown):


Immediately interfere with two nuances:
- scrolls in the legend (with an increase in the number of servers will have to scroll longer);
- lack of data in Singlestat-panels (which, naturally, assume a single value). We have two servers, here are two values.
Let's try to defeat these comments by introducing an instance template . To do this, we need to create a variable that stores the value of the instance, and slightly modify the requests to Prometheus, according to the existing rules . That is, instead of the query "isc_cache_mgstat_global_refs" we should write "isc_cache_mgstat_global_refs {instance =" [[instance]] "}" , after creating the instance variable.
Create a variable:


In the request to Prometheus we specify to select the values of the instance tags from each metric. In the lower part, we observe that the values of our two instances are defined. Click the "Add" button:

In the upper part of the dashboard, a variable appeared with options for the values:

Now we add the use of this variable to the queries for each panel on the dashboard, that is, turn requests of the type "isc_cache_mgstat_global_refs" to "isc_cache_mgstat_global_refs {instance =" [[instance]] "} . We get this dashboard (near the legends, the names of the instances are left on purpose, for verification):

Singlestat panels are already running:

Download this dashboard template at github . The procedure for importing it to Grafana is described in the first part .
Finally, we will make the server 192.168.42.132 an ECP client for 192.168.42.131 and create globals to generate ECP traffic. We see that monitoring the ECP client works:

We can replace the display of the results of the work of the ^ mgstat utility in Excel with the online display in the form of quite nice graphs. The downside is that for this you need to use an alternative version ^ mgstat. In principle, the source utility code may vary, which is not taken into account. However, we get the convenience of observing what is happening in Caché.
Thanks for attention!
To be continued ...
A demo stand (for one instance) is available for viewing here . Login without login / password.
The presentation of the material I would like to break into two parts: in the first graphically show the statistics collected ^ mgstat, and in the second - to consider exactly how these statistics are collected. In short, $ zu functions are used . However, to the majority of parameters collected there is an object interface through the classes of the SYS.Stats package. And not all parameters that can be collected are shown in ^ mgstat. In the future, we will try to display all of them on the Grafana boards. At the same time, we show only what ^ gstat itself provides us. In addition, try to taste Docker-containers.
We put Docker
The first part describes how to install Prometheus and Grafana from tarballs. We will show how you can start the same monitoring server using Docker features. Demonstration host machine:
# uname -r
4.8.16-200.fc24.x86_64
# cat / etc / fedora-release
Fedora release 24 (Twenty Four)
Two more virtual machines (192.168.42.131 and 192.168.42.132) will be used in the VMWare Workstation Pro 12.0 environment, both with Caché on board. We will monitor them. Versions:
# uname -r
3.10.0-327.el7.x86_64
# cat / etc / redhat-release
Red Hat Enterprise Linux Server release 7.2 (Maipo)
...
USER> write $ zversion
Cache for UNIX (Red Hat Enterprise Linux for x86-64) 2016.2 (Build 721U) Wed Aug 17 2016 20:19:48 EDT
On the host machine, install Docker and run it:
# dnf install -y docker
# systemctl start docker
# systemctl status docker
● docker.service - Docker Application Container Engine
Loaded: loaded (/usr/lib/systemd/system/docker.service; disabled; vendor preset: disabled)
Active: active (running) since Wed 2017-06-21 15:08:28 EEST; 3 days ago
...
Launch Prometheus in the Docker container
Download the latest Prometheus image:
# docker pull docker.io/prom/prometheus
If we look at the Docker file , we will see that the image reads the config from its /etc/prometheus/prometheus.yml file, and stores the collected metrics in the / prometheus directory:
...
Cmd ["-config.file = / etc / prometheus / prometheus.yml", \
"-storage.local.path = / prometheus", \
...
When launching Prometheus in the Docker container, we specify the configuration file and the database for metrics to be taken from the host machine. This will allow us to “survive” the restart of the container. Create directories for Prometheus on the host machine:
# mkdir -p / opt / prometheus / data / opt / prometheus / etc
Create a Prometheus configuration file:
# cat /opt/prometheus/etc/prometheus.yml
global:
scrape_interval: 10s
')
scrape_configs:
- job_name: 'isc_cache'
metrics_path: '/ mgstat / 5' # Tail 5 (sec) it's a diff time for ^ mgstat. Should be less than scrape interval.
static_configs:
- targets: ['192.168.42.131 Low7772''''2'2.168.42.132 -177772']
basic_auth:
username: 'PromUser'
password: 'Secret'
Now you can run the container with Prometheus:
# docker run -d --name prometheus \
--hostname prometheus -p 9090: 9090 \
-v /opt/prometheus/etc/prometheus.yml:/etc/prometheus/prometheus.yml \
-v / opt / prometheus / data /: / prometheus \
docker.io/prom/prometheus
Check that it starts up normally:
# docker ps --format "{{.ID}}: {{.Command}} {{.Status}} {{.Names}}"
d3a1db5dec1a: "/ bin / prometheus -con" Up 5 minutes prometheus
We start Grafana in the Docker-container
First, download the last image:
# docker pull docker.io/grafana/grafana
Then we run it, indicating that the Grafana database (by default, this is SQLite) will be stored on the host machine. We also link to the container with Prometheus, so that you can refer to the container with Prometheus from the container with Grafana:
# mkdir -p / opt / grafana / db
# docker run -d --name grafana \
--hostname grafana -p 3000: 3000 \
--link prometheus \
-v / opt / grafana / db: / var / lib / grafana \
docker.io/grafana/grafana
# docker ps --format "{{.ID}}: {{.Command}} {{.Status}} {{.Names}}"
fe6941ce3d15: "/run.sh" Up 3 seconds grafana
d3a1db5dec1a: "/ bin / prometheus -con" Up 14 minutes prometheus
We use Docker-compose
Both containers are running one by one. A more convenient way to launch multiple containers at once seems to be using Docker-compose . We will install it, stop the current both containers, configure their launch via Docker-compose and launch it again.
The same in cli:
# dnf install -y docker-compose
# docker stop $ (docker ps -a -q)
# docker rm $ (docker ps -a -q)
# mkdir / opt / docker-compose
# cat /opt/docker-compose/docker-compose.yml
version: '2'
services:
prometheus:
image: docker.io/prom/prometheus
container_name: prometheus
hostname: prometheus
ports:
- 9090: 9090
volumes:
- /opt/prometheus/etc/prometheus.yml:/etc/prometheus/prometheus.yml
- / opt / prometheus / data /: / prometheus
grafana:
image: docker.io/grafana/grafana
container_name: grafana
hostname: grafana
ports:
- 3000: 3000
volumes:
- / opt / grafana / db: / var / lib / grafana
# docker-compose -f /opt/docker-compose/docker-compose.yml up -d
# # You can turn off and remove both containers with the command:
# # docker-compose -f /opt/docker-compose/docker-compose.yml down
# docker ps --format "{{.ID}}: {{.Command}} {{.Status}} {{.Names}}"
620e3cb4a5c3: "/run.sh" Up 11 seconds grafana
e63416e6c247: "/ bin / prometheus -con" Up 12 seconds prometheus
Post-installation procedures
After launching Grafana for the first time, two things need to be done: change the admin password to the web interface (by default, the login / password is admin / admin) and add Prometheus as a data source. This can be done either from the web interface, or by directly editing the Grafana SQLite database (it defaults to the file /opt/grafana/db/grafana.db), or by REST requests .
We show the third option:
# curl -XPUT " admin : admin @ localhost: 3000 / api / user / password" \
-H "Content-Type: application / json" \
-d '{"oldPassword": "admin", "newPassword": "TopSecret", "confirmNew": "TopSecret"}'
If the password has been changed successfully, the answer will come:
{"message": "User password changed"}
Answer type:
curl: (56) Recv failure: Connection reset by peer
means that the Grafana server has not yet fully started and you need to wait a little more, and then repeat the previous command. You can wait, for example, like this:
# until curl -sf admin : admin @ localhost: 3000> / dev / null; do sleep 1; echo "Grafana is not started yet"; done; echo "Grafana is started"
After successfully changing the password, add the Prometheus data source:
# curl -XPOST " admin : TopSecret @ localhost: 3000 / api / datasources" \
-H "Content-Type: application / json" \
-d '{"name": "Prometheus", "type": "prometheus", "url": "http: // prometheus: 9090", "access": "proxy"}'
If the data source was added successfully, the answer will come:
{"id": 1, "message": "Datasource added", "name": "Prometheus"}
-H "Content-Type: application / json" \
-d '{"oldPassword": "admin", "newPassword": "TopSecret", "confirmNew": "TopSecret"}'
If the password has been changed successfully, the answer will come:
{"message": "User password changed"}
Answer type:
curl: (56) Recv failure: Connection reset by peer
means that the Grafana server has not yet fully started and you need to wait a little more, and then repeat the previous command. You can wait, for example, like this:
# until curl -sf admin : admin @ localhost: 3000> / dev / null; do sleep 1; echo "Grafana is not started yet"; done; echo "Grafana is started"
After successfully changing the password, add the Prometheus data source:
# curl -XPOST " admin : TopSecret @ localhost: 3000 / api / datasources" \
-H "Content-Type: application / json" \
-d '{"name": "Prometheus", "type": "prometheus", "url": "http: // prometheus: 9090", "access": "proxy"}'
If the data source was added successfully, the answer will come:
{"id": 1, "message": "Datasource added", "name": "Prometheus"}
Create an analog ^ mgstat
^ mgstat writes output to a file and online to a terminal. We do not need output to the file. Therefore, with the help of Studio, we will create and compile in the USER area the program ^ mymgstat.int, with a reduced code ^ mgstat.
Program ^ mymgstat:
mgstat(dly) /* Edited version of ^mgstat for Prometheus monitoring Changes: - Variables cnt, reqname and pagesz are deleted as well as all code connected to them; - Output procedure was overwritten; - Unused procedures were deleted. */ ; ; n dly d init d loop q init s prefix="isc_cache_mgstat_" s $zt="initerr" ; for class errors mainly??? the vers exist in 4.1 d GetVersionInfo(.Majver,.Minver,.OS) i Majver<5 w "Sorry, this won't work on this version of Cache",! q // not supported on pre-5.0 systems. s (odly,dly)=$g(dly,2) i dly>10 s dly=10 ; set common memory offsets s jrnbase=$ZU(40,2,94),maxval4=4294967295 s wdwchk=$ZU(40,2,146),wdphaseoff=$ZU(40,2,145) s wdcycle=$ZU(79,1),stilen=$zu(40,0,1),szctrs=1 s (globufs,glostr)=$v($ZU(40,2,135),-2,stilen)/512 fi=1:1:5 { s tmp=$v($ZU(40,2,135)+(i*stilen),-2,stilen)*(2**(1+i))/1024,globufs=globufs+tmp,glostr=glostr_"^"_tmp } s globufs=globufs_"MB:"_glostr if Majver>2008||((Majver=2008)&&(Minver>1)) { s roustr=$tr($system.Util.RoutineBuffers(),",","^"),roubufs=0 fi=1:1:$l(roustr,"^") { s roubufs=roubufs+$p(roustr,"^",i) } s roubufs=roubufs_"MB:"_roustr } else { i (Majver=5)&&(Minver<1) { s rbufsiz=32,rbstr=",routinebuffersize=assumed 32K" } else { s rbufsiz=$v($zu(40,2,164),-2,4)+240\1024,rbstr=",routinebuffersize="_rbufsiz_"K" } s roubufs=$fn($V($zu(40,2,26),-2,stilen)*rbufsiz/1024,"",0)_"MB"_rbstr } s ncpus=$system.Util.NumberOfCPUs() if Majver>2000 { // really > 5.2 s sznames="Global,ObjClass,Per-BDB",sztag="Gbl,Obj,BDB",szstr=$$GetSzctr(sznames) // seize statistics if Majver>2008 { if Majver>2009 { s szctrs=$zu(69,74) ;0 for off, 1 for on - new in 2010.x - chg for API in 2011 } s $zt="initcpuerr" s ncpus=ncpus_":"_$$GetArchChipsCores() ;Arch^Chips^Cores initcpuerr ; kn s $zt="" } } else { s szstr="4,2,14",sztag="Gbl,Rou,Obj" // 5.2 and lower - glo,rou,obj } i szstr="" { s nszctrs=0 } else { s nszctrs=szctrs*$l(szstr,",") } s numsz=nszctrs*3 // Sz, Nsz, Asz for each one. ; decide on offsets where they move between versions... i (Majver=5)&&(Minver<1) { ;5.0 specific - no zu190!!! - oldstyle gather() and wd info s getwdq="getwdinf50()",maxvalglo=maxval4,glocnt=11,gmethod=0,roubase=$zu(40,2,1) s bdb0off=$ZU(40,2,128),bdbbase=$V($ZU(40,2,21),-2,"P"),bdbsiz=$ZU(40,29,0),wdqsizoff=$ZU(40,29,2),off=$V(bdb0off,-2,4),vwlocn=bdbbase+wdqsizoff s ppgstats=0 } else { s getwdq="getwdinfzu()",numbuff=$zu(190,2),ijulock=1,glocnt=$l($zu(190,6,1),","),gmethod=1 s ppgstats=glocnt'<20 i $zu(40,0,76)=4 { s maxvalglo=maxval4 } else { s maxvalglo=18446744073709551610 } ; wij only appears in >= 5.1... but handled by glocnt ; routine cache misses appears in >= 2007.1 but handled by glocnt i glocnt>14 s glocnt=14 } s ecpconncol=glocnt+numsz+2,alen=ecpconncol+5,maxeccon=$system.ECP.MaxClientConnections() i 'maxeccon s alen=ecpconncol-1 q initerr ; handle init errs q loop d gather(.oldval,gmethod) h dly d gather(.newval,gmethod) d diffandfix() d output gather(array,usezu) i usezu { s zustats1=$zu(190,6,1) ; glostat For i=1:1:glocnt S array(i)=$P(zustats1,",",i) } else { ; old (5.0) glostat, gloref,glorefclient,logrd,phyrd,phywr,gloset,glosetclient,roulines for i=1:1:glocnt s array(i)=$v((i-1)*4+roubase,-2,4) ;;;incomplete!!???10/22 } d @getwdq,getwdp() si=glocnt,array($i(i))=$v(jrnbase,-2,4) ; jrnwrites for jsz=1:1:nszctrs { sj=$p(szstr,",",jsz),szstat=$zu(162,3,j),array($i(i))=$p(szstat,","),array($i(i))=$p(szstat,",",2),array($i(i))=$p(szstat,",",3) } i maxeccon s estats=$p($system.ECP.GetProperty("ClientStats"),",",1,21),array($i(i))=+$system.ECP.NumClientConnections(),array($i(i))=$p(estats,",",2),array($i(i))=$p(estats,",",6),array($i(i))=$p(estats,",",7),array($i(i))=$p(estats,",",19),array($i(i))=$p(estats,",",20) i ppgstats s array($i(i))=$p(zustats1,",",20),array($i(i))=$p(zustats1,",",21) q diffandfix() ; note - this does not work if someone zeroed the counters manually fi=1:1:glocnt { i newval(i)<oldval(i) { s dispval(i)=(maxvalglo-oldval(i)+newval(i))\dly i dispval(i)>1000000000 s dispval(i)=newval(i)\dly } else { s dispval(i)=(newval(i)-oldval(i))\dly } s oldval(i)=newval(i) } s rdratio=$s(dispval(8)=0:0,1:$num(dispval(7)/dispval(8),2)) s grratio=$s(dispval(6)=0:0,1:$num(dispval(5)/dispval(6),2)) i maxeccon s dispval(ecpconncol)=newval(ecpconncol) fi=glocnt+1:1:ecpconncol-1,ecpconncol+1:1:alen+$s(ppgstats:2,1:0) { i newval(i)<oldval(i) { s dispval(i)=(maxval4-oldval(i)+newval(i))\dly i dispval(i)>1000000000 s dispval(i)=newval(i)\dly } else { s dispval(i)=(newval(i)-oldval(i))\dly } s oldval(i)=newval(i) } if nszctrs>0 { fi=glocnt+2:3:glocnt+numsz-1 { i 'dispval(i) { s (dispval(i+1),dispval(i+2))="0" } else { s dispval(i+1)=$num(dispval(i+1)/dispval(i)*100,2) s dispval(i+2)=$num(dispval(i+2)/dispval(i)*100,2) } } } q output s nl=$c(10) w prefix_"global_refs "_dispval(5)_nl w prefix_"remote_global_refs "_dispval(6)_nl w prefix_"global_remote_ratio "_grratio_nl w prefix_"physical_reads "_dispval(8)_nl w prefix_"read_ratio "_rdratio_nl w prefix_"global_updates "_dispval(10)_nl w prefix_"remote_global_updates "_dispval(11)_nl w prefix_"routine_refs "_dispval(1)_nl w prefix_"remote_routine_refs "_dispval(2)_nl w prefix_"routine_loads_and_saves "_dispval(3)_nl w prefix_"remote_routine_loads_and_saves "_dispval(4)_nl w prefix_"physical_writes "_dispval(9)_nl w prefix_"write_daemon_queue_size "_wdqsz_nl w prefix_"write_daemon_temp_queue "_twdq_nl w prefix_"write_daemon_phase "_wdphase_nl i glocnt>12 w prefix_"wij_writes "_dispval(13)_nl i glocnt>13 w prefix_"routine_cache_misses "_dispval(14)_nl w prefix_"journal_writes "_dispval(glocnt+1)_nl s icnt=1 fi=1:1:numsz { ; global/rou/obj nseize/aseize are nodisp-100+ ; and start at dispval(glocnt+2) and go up... s rsc=$p(sztag,",",i) w prefix_rsc_"seizes "_dispval(i+glocnt+1)_nl s icnt=icnt+1 } s ecpnames=$lb("act_ecp","add_blocks","purge_buffers_local","purge_server_remote","bytes_sent","bytes_received") s icnt=0,ecnt=1 fi=glocnt+numsz+2:1:alen { ; ECP are nodisp 19-24 and start at glocnt+numsz+1 and go up... w prefix_$lg(ecpnames,ecnt)_" "_dispval(i)_nl s icnt=icnt+1 s ecnt=ecnt+1 } i $d(ijulock) { w prefix_"write_daemon_pass "_wdpass_nl w prefix_"iju_count "_ijucnt_nl w prefix_"iju_lock "_ijulock_nl } s ppgnames=$lb("process_private_global_refs","process_private_global_updates") i ppgstats { ; PPG are nodisp 28,29 and start at alen+1 fi=0,1 w prefix_$lg(ppgnames,i+1)_" "_dispval(alen+i+1)_nl } w nl q getwdinfzu() s twdq=0 fb=1:1:numbuff { s twdq=twdq+$p($zu(190,2,b),",",10) } s wdinf=$zu(190,13),wdpass=$p(wdinf,","),wdqsz=$p(wdinf,",",2),twdq=twdq-wdqsz i twdq<0 s twdq=0 s misc=$zu(190,4),ijulock=$p(misc,",",4),ijucnt=$p(misc,",",5) q getwdinf50() s wdqsz=0,last=maxval4 fi=0:1:5 dq:off=maxval4 . s off=$V(bdb0off+(i*4),-2,4) . q:(off=last)!(off=maxval4) . s wdqsz=wdqsz+$V(vwlocn+off,-3,4) . s last=off Q getwdp() s wdphase=0 q:'$V(wdwchk,-2,4) q:'wdphaseoff s wdphase=$V(wdphaseoff,-2,4) Q GetArchChipsCores() private { ;Returns <Arch>^<# Chips>^<# Cores> if $D(^oddDEF("%SYSTEM.CPU")) { sn=##class(%SYSTEM.CPU).%New() s Arch=n.Arch s nChips=n.nChips s nCores=n.nCores } else { ; These are all here in case we want more later Set Arch=$zu(204,1) Set Model=$zu(204,2) Set Vendor=$zu(204,3) Set nThreads=$zu(204,4) Set nCores=$zu(204,5) Set nChips=$zu(204,6) Set nThreadsPerCore=$zu(204,7) Set nCoresPerChip=$zu(204,8) Set MTSupported=$zu(204,9) Set MTEnabled=$zu(204,10) Set MHz=$zu(204,11) } quit Arch_"^"_nChips_"^"_nCores } GetVersionInfo(majver,minver,os) PRIVATE { if $D(^oddDEF("%SYSTEM.CPU")) { s majver=$System.Version.GetMajor() s minver=$System.Version.GetMinor() s os=$System.Version.GetCompBuildOS() } else { s zv=$ZV s majver=$p($p($p(zv,") ",2)," ",1),".",1) s minver=$p($p($p(zv,") ",2)," ",1),".",2) If zv["Windows" { Set os="Windows" } elseif zv["UNIX" { Set os="UNIX" } elseif zv["VMS" { Set os="VMS" } else { Set os="N/A" } } } GetSzctr(Longnames) private { s allsznames=$zu(162,0)_",",zuctr="" fi=1:1:$l(Longnames,",") { s ctr=$p(Longnames,",",i) continue:(ctr="")||(ctr="Unused") s nctr=$l($e(allsznames,1,$find(allsznames,ctr)),",")-1 continue:nctr=0 i zuctr="" { s zuctr=nctr } else { s zuctr=zuctr_","_nctr } } quit zuctr } In order to be able to call the program ^ mymgstat via REST, we are doing a wrapper class for it in the USER area.
Its implementation
Class my.Mgstat Extends %CSP.REST { XData UrlMap [ XMLNamespace = "http://www.intersystems.com/urlmap" ] { <Routes> <Route Url="/:delay" Method="GET" Call="getMgstat"/> </Routes> } ClassMethod getMgstat(delay As %Integer = 2) As %Status { // By default, we use 2 second interval for averaging do ^mymgstat(delay) quit $$$OK } } Create a resource, user, and web application
Now that we have a class that provides metrics, we can create a RESTfull web application. As in the first article, we will assign a resource to this web application and create a user who can use this resource and on whose behalf Prometheus will collect metrics. Let's give the user more rights to certain databases. Compared to the first article, the right to write to the CACHESYS database has been added (to avoid the error <UNDEFINED> loop + 1 ^ mymgstat * gmethod ") and the ability to use the% Admin_Manage resource has been added (to avoid the <PROTECT> gather + 10 ^ error mymgstat * GetProperty % SYSTEM.ECP "). We will do these steps on two virtual servers, 192.168.42.131 and 192.168.42.132. Naturally, we will preload our code, the program ^ mymgstat and the class my.Mgstat into the USER area on that and on another server (the code is on github ).
That is, on each virtual server we will do the following steps:
# cd / tmp
# wget https://github.com/myardyas/prometheus/raw/master/mgstat/cos/mymgstat.xml
# wget https://github.com/myardyas/prometheus/raw/master/mgstat/cos/Mgstat.xml
#
# # If the servers do not have access to the Internet, copy the program and class locally, and then use scp .
#
# csession <instance_name> -U user
USER> do $ system.OBJ.Load ("/ tmp / mymgstat.xml * / tmp / Mgstat.xml", "ck")
USER> zn "% sys"
% SYS> write ## class (Security.Resources) .Create ("PromResource", "Resource for Metrics web page", "")
one
% SYS> write ## class (Security.Roles) .Create ("PromRole", "Role for PromResource", "PromResource: U,% Admin_Manage: U,% DB_USER: RW,% DB_CACHESYS: RW")
one
% SYS> write ## class (Security.Users) .Create ("PromUser", "PromRole", "Secret")
one
% SYS> set properties ("NameSpace") = "USER"
% SYS> set properties ("Description") = "RESTfull web-interface for ^ mymgstat"
% SYS> set properties ("AutheEnabled") = 32 ; See description
% SYS> set properties ("Resource") = "PromResource"
% SYS> set properties ("DispatchClass") = "my.Mgstat"
% SYS> write ## class (Security.Applications) .Create ("/ mgstat",. Properties)
one
Checking the availability of metrics with curl
# curl --user PromUser: Secret -XGET http://192.168.42.131.77772/mgstat/5
isc_cache_mgstat_global_refs 347
isc_cache_mgstat_remote_global_refs 0
isc_cache_mgstat_global_remote_ratio 0
...
# curl --user PromUser: Secret -XGET http://192.168.42.132Cl7777/mgstat/5
isc_cache_mgstat_global_refs 130
isc_cache_mgstat_remote_global_refs 0
isc_cache_mgstat_global_remote_ratio 0
...
Checking the availability of metrics from Prometheus
Prometheus is listening to port 9090 here. First we check the status of Targets:
Then we look at any of the metrics:
We display one metric
We now show one metric, for example, isc_cache_mgstat_global_refs, in the form of a graph. We will need to add a panel and insert a graph into it. Go to Grafana ( http: // localhost: 3000 , login / pass - admin / TopSecret) and add the panel:
Add a chart:
Edit it by clicking “Panel title”, then “Edit”:
Specify Prometheus as the data source and select our isc_cache_mgstat_global_refs metric. Resolution choose 1/1:
Give the name of the schedule:
Add a legend:
Click on the top button “Save” and give the name of the dashboard:
We get something like this:
Display all metrics
Similarly, let's throw in the rest of the metrics. Among them will be two text metrics - Singlestat . We will get such a dashboard (upper and lower parts are shown):
Immediately interfere with two nuances:
- scrolls in the legend (with an increase in the number of servers will have to scroll longer);
- lack of data in Singlestat-panels (which, naturally, assume a single value). We have two servers, here are two values.
We add the use of the template
Let's try to defeat these comments by introducing an instance template . To do this, we need to create a variable that stores the value of the instance, and slightly modify the requests to Prometheus, according to the existing rules . That is, instead of the query "isc_cache_mgstat_global_refs" we should write "isc_cache_mgstat_global_refs {instance =" [[instance]] "}" , after creating the instance variable.
Create a variable:
In the request to Prometheus we specify to select the values of the instance tags from each metric. In the lower part, we observe that the values of our two instances are defined. Click the "Add" button:
In the upper part of the dashboard, a variable appeared with options for the values:
Now we add the use of this variable to the queries for each panel on the dashboard, that is, turn requests of the type "isc_cache_mgstat_global_refs" to "isc_cache_mgstat_global_refs {instance =" [[instance]] "} . We get this dashboard (near the legends, the names of the instances are left on purpose, for verification):
Singlestat panels are already running:
Download this dashboard template at github . The procedure for importing it to Grafana is described in the first part .
Finally, we will make the server 192.168.42.132 an ECP client for 192.168.42.131 and create globals to generate ECP traffic. We see that monitoring the ECP client works:
Results
We can replace the display of the results of the work of the ^ mgstat utility in Excel with the online display in the form of quite nice graphs. The downside is that for this you need to use an alternative version ^ mgstat. In principle, the source utility code may vary, which is not taken into account. However, we get the convenience of observing what is happening in Caché.
Thanks for attention!
To be continued ...
PS
A demo stand (for one instance) is available for viewing here . Login without login / password.
Source: https://habr.com/ru/post/331594/
All Articles