How we gathered 1,500 stars on Github, combining time-tested technology and a new interface

We recently released an open source tool with GraphQL Voyager . Surprisingly, he got on the first page of Hacker News and GitHub news, and in the first few days received 1000+ stars. He now has more than 1600 stars . *
People liked the sleek interface, interactive features and animation. We used TypeScript, React, Redux, webpack, and even PostCSS, but this is NOT another article about it . Let's look under the hood ...
Our backstory
It all started a few months ago. My friend and I (we call ourselves APIs.guru ) were looking for an idea for a project around GraphQL (a query language for APIs developed by Facebook). After some research, we came across an interesting tool - GraphQL Visualizer .
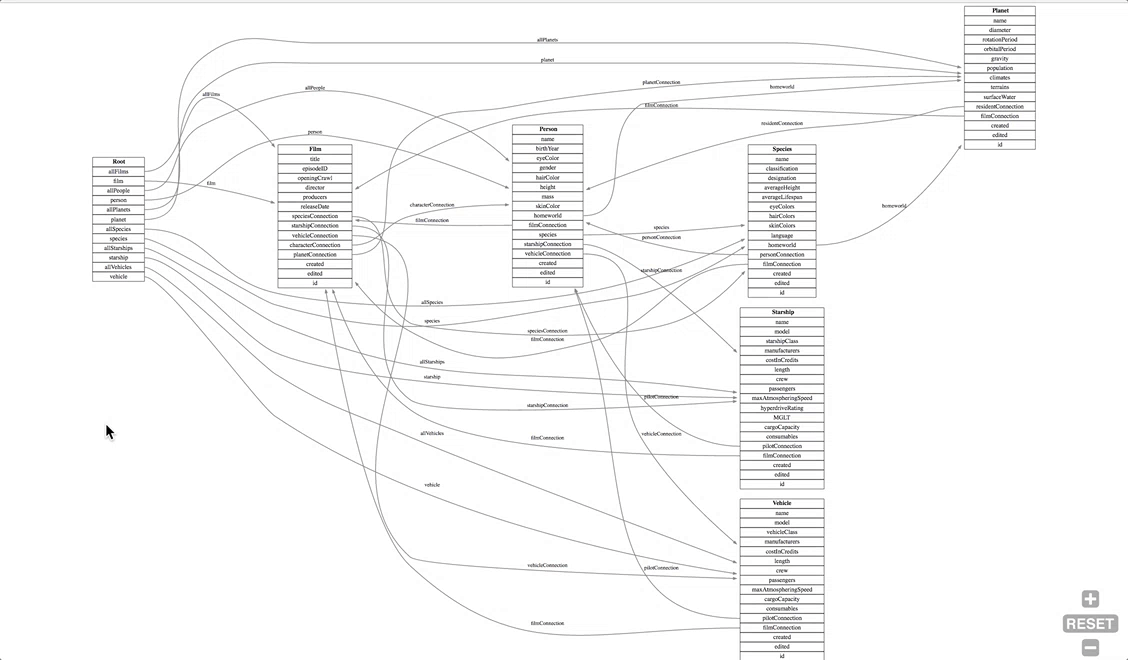
Here is what we got on exiting GraphQL Visualizer:
We wanted to add to it:
- Colors (black and white looked too boring)
- Scalable
- Interactive features like vertex and edge selection
But, looking at the source code, we discovered the fatal flaw of this thing: it used Graphviz , a tool developed decades ago, written in ordinary C and compiled into unreadable JavaScript using Emscripten .
It looks even worse than what usually gets out of Uglify.js:

How can we use something from the year 2000? We are hipsters, after all! ReactJS, D3, webpack, TypeScript, PostCSS - this is what we work with! Not with tools written in old-fashioned C 😜.
After a little digging, we found the best library for solving this problem - Cytoscape.js . It is written in excellent JavaScript and even allows you to apply CSS-like selectors directly to the graph itself. Excellent result!
But after a week of intense programming, it seemed not so good to us.
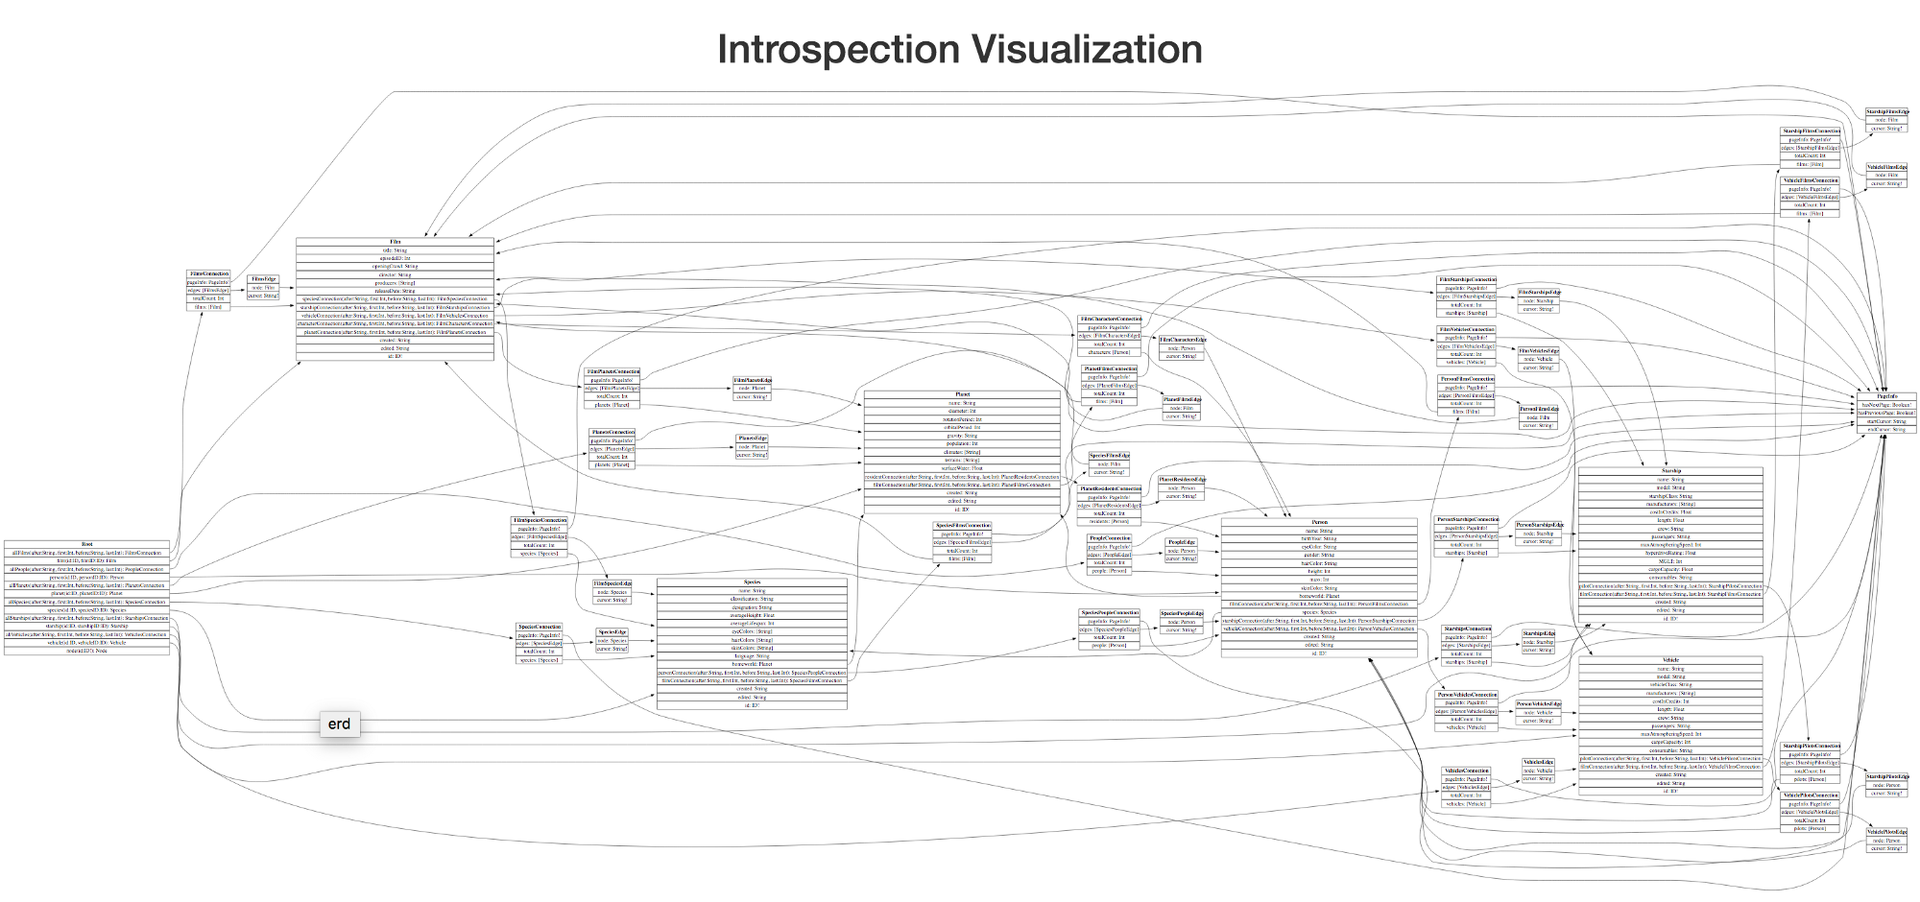
Judge for yourself, this is what graph visualization looks like using Cytoscape.js:
And we did not even show all the details on this chart! What a mess!
Although the code was much cleaner, the end result was much worse than the original tool. Totally non-usable.
It turned out that in cytoscape.js it is impossible to make sure that the edges do not intersect with the vertices of the graph. We tried all the options. We googled. We asked questions on StackOverflow. We even disturbed several familiar SVG gurus. Unsuccessfully :(
From despair, I even tried to hack cytoscape.js, in order to achieve a readable result. Having studied this question a little more, I had to give up: apparently, visualization of graphs is indeed rocket science (even for a master of applied mathematics).
We were defeated ...
And then it dawned on us. But what if we take the result of Graphviz (it’s just SVG) and comb it with CSS and JS?
And it worked ✨
Much better! And the code is written in less than a day.
Add a little color, a logo, load the animation, some more useful features, and here’s the end result, what we need:
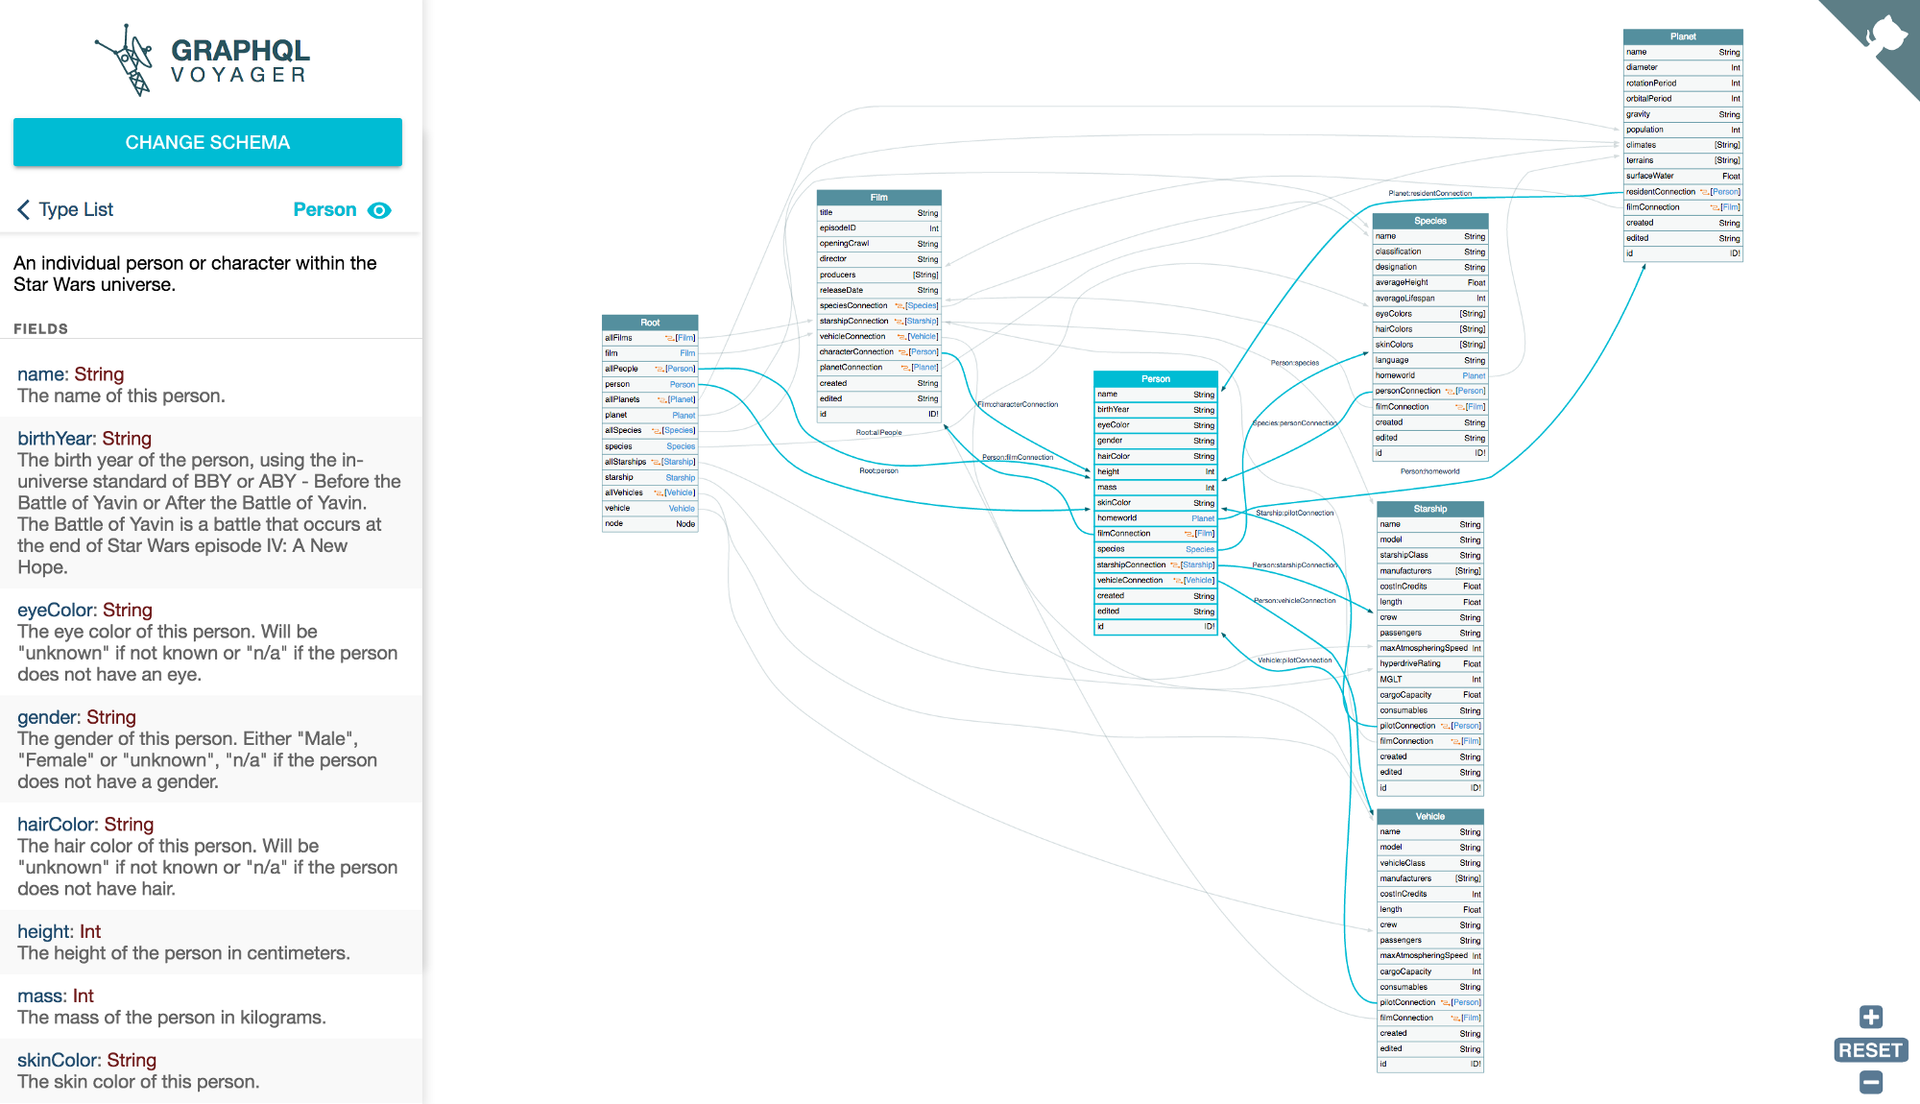
Yes, we wrote a few hundred lines of ugly manipulations with the DOM. Yes, we packed all this mess NOT in the form of a clean Re component of React / Redux. And yes, the Graphviz code is so big that we selected it into a separate 2 MB file. But it works, and all do not care. As confirmed by 1600 stars on GitHub.
Update : since the introduction of the time article, our development has been adopted by companies in this area (for example, Graphcool, Neo4j), and it was shown at GraphQL Europe, so not only 1600 stars confirm this :)
Lessons learned
" If I saw farther than others, it was because I stood on the shoulders of giants ." - Isaac Newton
Do not judge the code by its age. Especially if it was written by such technological giants as AT & T Labs (where the Unix OS and C and C ++ languages were born).
Unfortunately, we were victims of cognitive distortion: the old code is a bad code. But the truth may be the opposite. The old code is tested in a battle by thousands of users in hundreds of different projects. Most of the critical bugs were fixed, the documentation was completed, there are many questions and answers to StackOverflow and Quora.
We live in 2017, and the user interface from the 2000s is definitely not acceptable. But the graphics and mathematics behind them do not change much.
This idea is applicable in many other areas. So we have to give a chance to the old code, especially because it can always be wrapped in a modern interface.
That is why we see great potential in the Web Assembly . This format allows you to combine time-tested algorithms with modern user interfaces. We really want to see the amazing things that people will do on it.
"Um ... you promised to tell me how to get a lot of stars"
Oops ... Okay. And true. I wanted to make the title memorable enough.
Below is a list of the most important tips and tricks we use for our open source project:
- Try to use the name of your technology in the project name (for example, graphql-something, react-something, etc.). Then your project will have a higher rank in the GitHub search results for these technologies.
- Your README file should attract attention. We put a gif in the cap of our README, so that people can immediately understand what is involved in our project. If this is a console application, add a gif with the console (here's a great example ).
- More whistles and fakes: add icons, add a beautiful logo, add emoji 🔥 🙌
- Collect the demo version, if possible, and add it to the link in the line with the repository description:

- I repeat, make a demo ! And don't forget to add the link from it back to GitHub (we use GitHub Corners ).
- Before posting your project in HackerNews / Reddit / etc, get the initial number of stars (5-10) by posting it on less popular resources or sharing it with your friends. People are less likely to press the "star" on projects with a zero number of stars.
- Try to get 30-40 stars on the first day. Then, you will most likely be overwritten by GitHub trending for your programming language, and this is another source of traffic.
- Do something useful .
There are a few more articles on how to promote open source projects: here , here and here .
That's all, guys. If you've ever wrapped the old code in a new shiny interface, tell your story in the comments below.
* Translator's note: a week after the original publication, the project already has 2000+ stars.
** The title picture, as in the original post, was taken from www.k3projektwheels.com.
')
Source: https://habr.com/ru/post/331514/
All Articles