Oracle I / O Life: Tracing logical and physical I / O using SystemTap
We invite all specialists to take part in the section dedicated to commercial databases at PG Day'17 Russia! Alexander Khalukhin from Deutsche Bank is preparing an intensive master class on diagnosing the performance of the Oracle Database . Full list of speeches, see the program on the site !
And we continue to publish translations of articles from database specialists from CERN. Today’s material is the second part of a series of articles on tracing and debugging Oracle DB performance using SystemTap.
')
This article focuses on tracking logical and physical reads in Oracle using SystemTap. Here you will find a few examples illustrating the basic mechanisms used by Oracle to perform physical and logical I / O operations, and learn how to create SystemTap scripts for later diagnosis and troubleshooting of Oracle I / O.
Introduction
Performing input / output from and to media, i.e. Physical I / O is one of the most important tasks underlying all database engines. When accessing data stored in an in-memory database cache, we can talk about logical I / O. Physical I / O is performed by the database using OS kernel system calls. The type of system calls used depends on the parameters of the database, OS and type of storage. Logical I / O is performed by database processes using Oracle core functions. Oracle provides the measurement of physical I / O call times using the wait event interface, and logical I / O time is generally counted as CPU time. The I / O tracing performed by Oracle processes and supplemented by the details provided by the Oracle wait event interface is a powerful method for exploring the internal Oracle I / O device. With a few real-life examples, we’ll find out which mechanisms Oracle uses to access the repository, how I / O operations correlate to the wait event interface, and find out the time limit for the most common I / O wait events.
Creating a trace tool
Operations research that Oracle and OS perform when performing an I / O operation requires special tools. SystemTap is a dynamic trace tool designed specifically for Linux that allows you to monitor both OS and Oracle functions (Linux kernel functions, system calls, and Oracle database engine functions). The following is a description of a systemtap script that can be used to track the logical and physical I / O of Oracle: it consists of probes that can join interesting function calls and read function parameters, memory, and processor registers .
Systemtap requires relatively recent kernel versions to be able to profile userspace: utrace or uprobe_events functionality must be available. For example, RHEL / OL 6.5 and higher is suitable, but not RHEL 5. In addition, the debuginfo kernel package must be installed for the trace system calls.
You can read more about this and how to create a test environment in this article . The script that we use in this post to trace the logical and physical I / O of Oracle, as well as the interface of wait events, looks like this: trace_oracle_logicalio_wait_events_physicalio_12102.stp (for Oracle 12.1.0.2). An option for version 11.2.0.4 is also available: trace_oracle_logicalio_wait_events_physicalio_11204.stp . Before turning to the Oracle I / O study examples, I would like to look at three main parts of the script: tracking physical I / O, logical I / O, and wait events.
Physical I / O tracking
Ultimately, Oracle makes system calls to perform I / O operations. The type of calls depends on the parameters of the database, the type of OS and the type of storage. In this article, you can find examples for Oracle on Linux , using ASM storage on block devices. Please note that direct NFS, local storage and ASM with asmlib were not included in the article and may be considered in future studies. System calls can be traced including using the strace (1) utility on Linux. However, in this article you will see how probes SystemTap can be created to collect information about system calls of interest: pread, pwrite, io_submit, and io_getevents . The following SystemTap probes can be useful for the “underlying” block I / O layer: ioblock.request, ioblock_trace.request and ioblock.end (note that these are not system calls, but trace points for function calls inside the Linux kernel).
Note added in August 2015: Systemtap probes for kernel.trace ('block_rq_issue') and kernel.trace ('block_rq_complete') can also be used to examine the block I / O interface with the added advantage: they do not require a kernel debuginfo. Examples of such probes can be found on the downloads page or on GitHub .
Logical I / O Tracking
This is the history and details of logical I / O operations when Oracle reads a block of data from memory (buffer cache). Logical I / O operations include a subset of physical I / O operations: if Oracle does not find the data in memory ( buffer cache ), it performs a physical read. You can find several examples of this mechanism in action later in this article.
The Oracle toolkit provides extensive information about logical readings in several V $ views, such as V $ SYSSTAT , V $ SESSTAT, V $ SYSMETRIC. Also data on logical readings are available from sql * plus with the “set autotrace on” parameter and with tkprof reports on event traces 10046 . Logical readings are of two main types: consistent and current. Oracle will use consistent reads when reading data with a given system change number SCN, current reads are used when performing DML operations on a block. Consistent reads can be traced to Oracle using events 10200 and 10201 . More information can be found in the Julian Dyke presentation on logical I / O.
In this article, we will show how to track logical I / O by connecting the SystemTap probes to the Oracle kernel feature set. The role of the kcbgtcr and kcbgcur functions for the consistent and current reads tracing has already been discussed by Alexander Anokhin in his excellent articles on Dtrace LIO . Most recently, I researched this topic and found it useful to also trace the functions kcbzib, kcbzgb, kcbzvb .
A summary of what I found out about these functions is given in the table below. Note: the expressions% rdi,% rsi,% r8 indicate the values of the corresponding processor registers . Using SystemTap, the register value can be read using the register function, for example: register ('rdi'). CPU registers are used to retrieve function call arguments . Systemtap does not provide function call arguments when there are no debug symbols for the executable file. In particular, the calling conventions for x86-64, as described at www.x86-64.org/documentation/abi.pdf , indicate that the integer parameters for the function call are available in the following registers (in order):% rdi,% rsi ,% rdx,% rcx,% r8 and% r9.
Note : at the time of this writing, only uprobes for kernels of version 3.10 and above support returned probes for userspace functions. Therefore, this functionality is not available in RHEL or OL 6.x, but is available in RHEL 7.x cores.
Tracking wait events
The wait-event interface is probably one of the best features in Oracle performance tuning, as it provides a quantitative method for identifying performance problems and bottlenecks. Cary Millsap has published an inspiring work on this topic.
For our purposes, it is enough to indicate that wait events are control points (instrumentation points) in which the selected actions of the Oracle core are measured. In particular, Oracle will mark the initial and final calls for most physical I / O operations, thus allowing you to understand well how much time is spent in the physical I / O process (some limitations of this mechanism are discussed later in this post). There are restrictions on using the wait event interface to study I / O latency , in particular, in the examples section you can find interesting problems related to measuring the duration of asynchronous I / O events.
Tracing wait events is usually activated in Oracle using event 10046 or by calling DBMS_MONITOR.SESSION_TRACE_ENABLE. In this article, we get the details of the wait event by attaching the probes SystemTap to the corresponding functions of the Oracle kernel, namely kskthbwt and kskthewt , to collect information at the beginning and at the end of each wait event, respectively. Enabling the tracing of wait events using event 10046 at level 8 and other methods is a way to retrieve information about the time of a wait event (as well as other details about SQL processing), rather than a way to include wait information. This, in turn, is done using the TIMED_STATISTICS database parameter, and in modern Oracle databases it should be set to TRUE. The key part of the information that the Oracle kernel kskthbwt and kskthewt functions give us is a pointer to the X $ KSUSE utility table (or rather, the “underlying” memory structure in the SGA), which is the “underlying” table for V $ SESSION and, therefore, it allows you to match wait events with a wealth of useful information about a session executing SQL Pointer dereferencing in the register r13 to the base value X $ KSUSE and calculating the offset for the fields of interest requires additional work, described in detail in the previous article (see also the script: ksuse_find_offsets.sql ).
Running script
Below you will find several trace examples for common Oracle I / O access patterns. Traces were obtained by the command stap -v trace_oracle_logicalio_wait_events_physicalio_12102.stp -x _pid_ , where _pid_ is the process identifier of the monitored session. The result is sent to sed -f eventsname.sed , where the translation of the event number into its associated name is provided. The eventsname.sed file is created by running the eventsname.sql script. It is important to restart the script to generate event names before testing, as wait event numbers may change without warning, for example, after migrating to newer versions or after installing a patch. The system used to collect traces in the following examples is Oracle 12.1.0.2, running on OEL 7.0 with UEK3 under Virtualbox.
Example 1: single-block random reads
This example is categorized as single block random reads. This way of accessing data is very important for many OLTP workloads , since it is used to access a table through an index key. In Figure 1 below, you can see a fragment of the trace file for the select query type col_list from table tab where indexed_col = val .

Fig. 1: Oracle Single-block random read and sequential read wait event from db file
Key points :
Example 2: Sequential I / O Buffer Cache with Synchronous I / O
In this example, we are talking about multi-block reads in the cache. This is the access method that is used, for example, when Oracle performs a full table scan . There are several ways in which Oracle can access the repository to perform a full table scan, in this example you see a case where Oracle uses synchronous I / O (i.e., pread) to perform OS read operations, examples 3 and 4 encompass sequential reads with asynchronous I / O. In Figure 2 below, you can see the workload tracking snippet of the select type of the col_list form table tab , Oracle performs a full scan of the tab table.
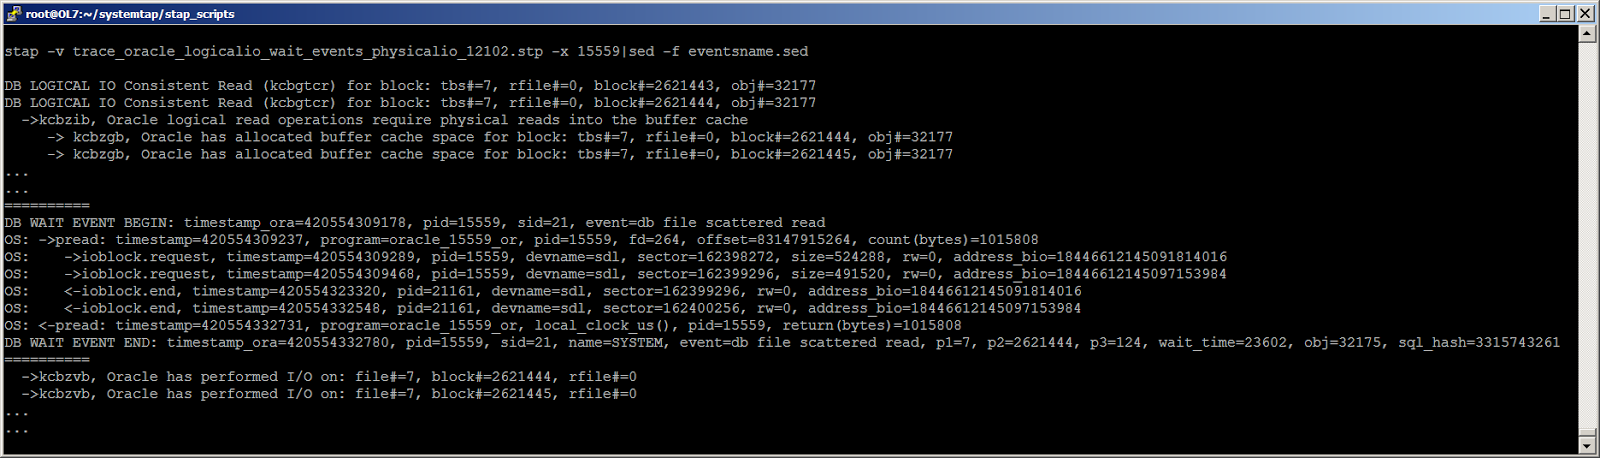
Fig. 2: Oracle Sequential I / O when reading is performed using pread OS calls
Key points of the trace in Figure 2:
Example 3: Sequential I / O to the buffer cache with calls to the asynchronous I / O functions of the OS
In Figure 3, you can see the SQL trace fragment select col_list from table tab , where Oracle performs a full scan of the tab table. This is the same query that was used in Example 2, the difference is that the trace in Figure 3 was made at a later stage of the query when the Oracle process switched from using synchronous I / O using pread calls to using the asynchronous I / O interface. . Asynchronous I / O is implemented in Linux by calling io_submit and io_getevents to send I / O requests and get results. Despite the fact that in this example, Oracle uses an asynchronous interface to perform read operations, the end result is very similar to the result presented in example 2 (that is, using synchronous I / O). The same Oracle wait event, “db file scattered read,” reads are also performed in the buffer cache, and the I / O results are collected using blocking calls, which actually makes the process synchronous. A more “aggressive use” of the interface for asynchronous I / O occurs in Oracle when performing direct reads, which are discussed in Example 4 below.

Fig. 3: Oracle performing sequential I / O reads to buffer cache using asynchronous I / O calls
Key points :
Example 4: full scans using direct reads and asynchronous I / O
In this section, you will find two examples of Oracle I / O in the case of direct reads in block storage configured with ASM . It uses the same query that performs the full table scan as examples 2 and 3. In this example, unlike examples 2 and 3, Oracle uses the serial direct read to access the data. Serial direct read is a function that appeared in 11gR2 to optimize full segment scan operations and bypass the buffer cache layer , similar to what happens with parallel queries. Oracle chooses when to use serial direct reads instead of cached reads based on several parameters. In the first approximation, direct reads are preferable when the table is “large” compared to the size of the buffer cache, but the actual mechanism is more complicated and could potentially change depending on the version of Oracle. You can find out more about this topic in the article by Tanel Poder .
To run these tests, I had to force the use of serial direct reads before launching the request, this was done using alter session set "_serial_direct_read" = always; .
Note that the request alter session set "_serial_direct_read" = never; can be used to disable serial direct reads and force Oracle to use cached reads (that is, the type of I / O that you saw in examples 2 and 3 above). The default value for the “_serial_direct_read” parameter is “auto”.
For research in this example, we can use a slightly different SystemTap probe than the previous ones. - - , probe userspace io_getevents_0_4 libaio (libaio — Linux, -). , serial direct reads -, libaio , (Frits Hoogland) . SystemTap, . 4a 4, : trace_oracle_wait_events_asyncio_libaio_12102.stp ( 11.2.0.4 trace_oracle_wait_events_asyncio_libaio_11204.stp ).

Fig. 4a: Oracle I/O full table scan serial direct read -. , full scan
4a:
serial direct reads Oracle , , . 4a. direct reads Oracle . , Oracle direct reads , . - -. I/O slots. , Oracle 10353 : « (slots) — -, -».
, -, direct reads, . , Oracle io_getevents timeout=0, - . . 4b. full scan, 4, , adaptive serial direct reads Oracle I/O, « » .
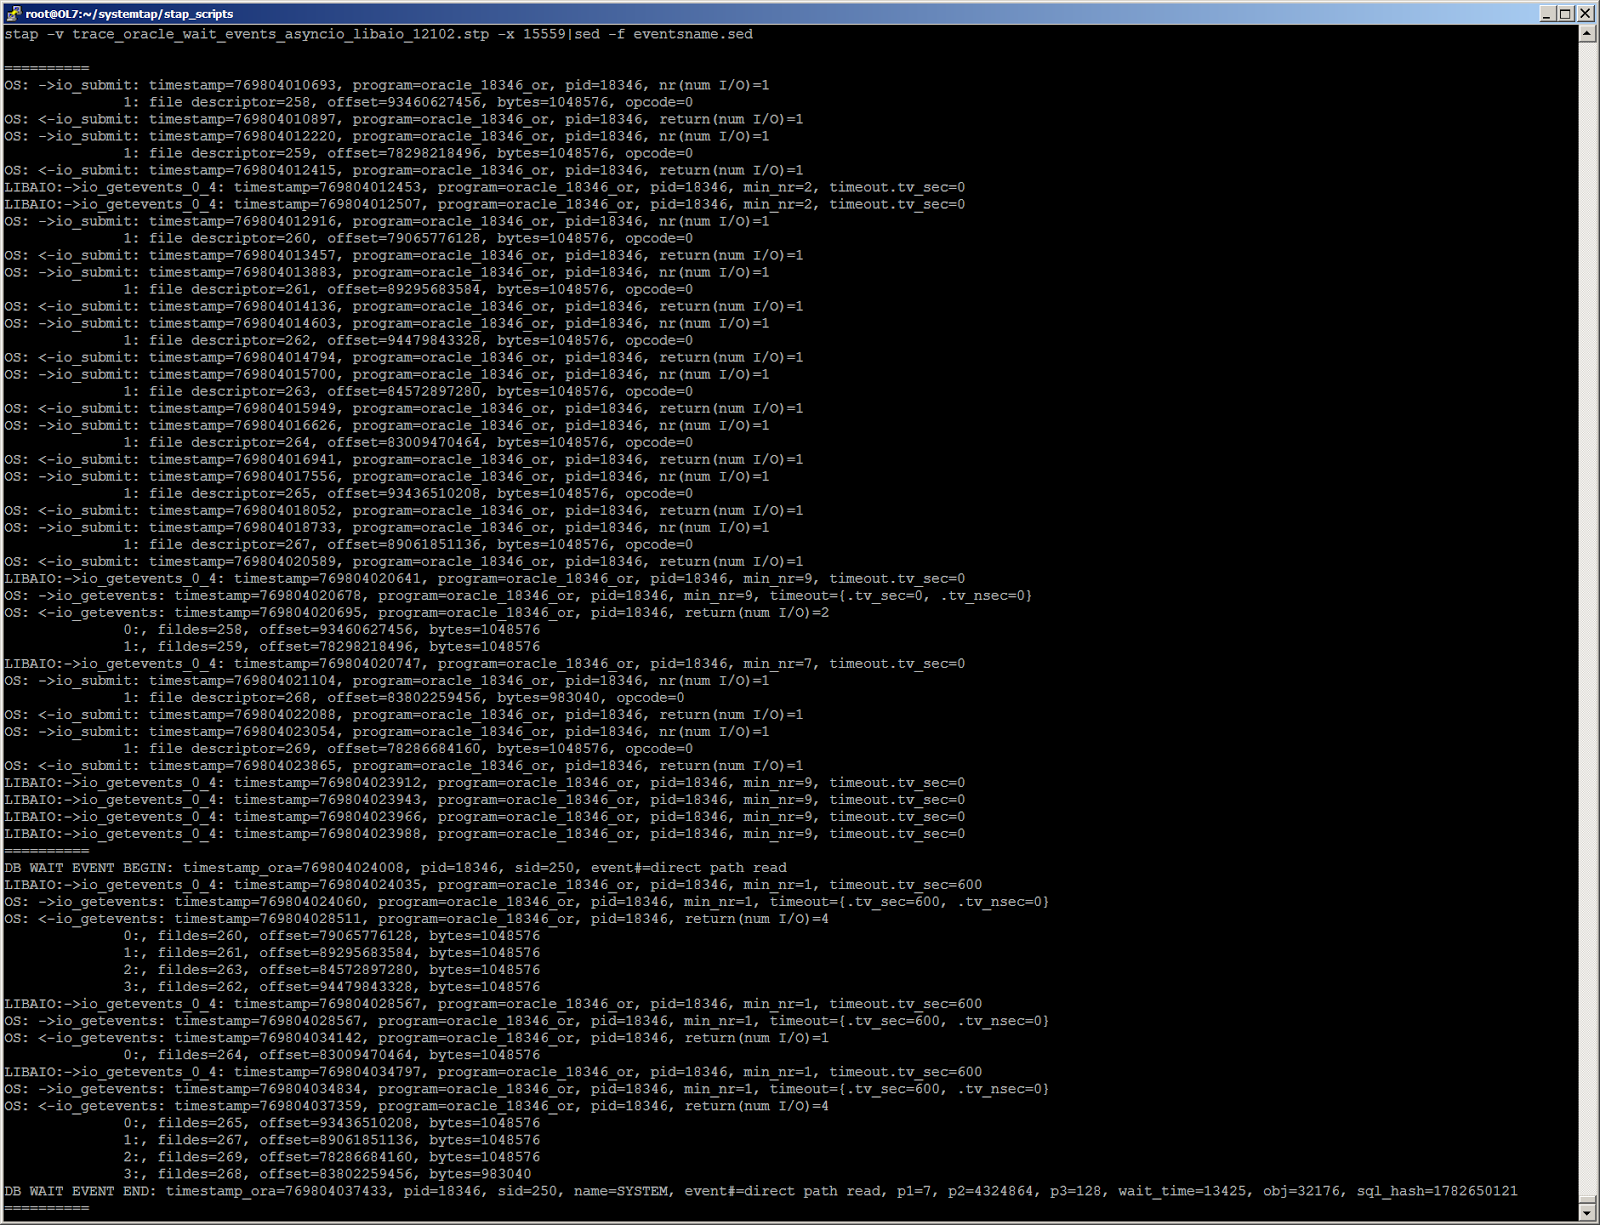
Fig. 4b. Oracle I/O full table scan serial direct read -. , , -
4:
5: - random reads
Oracle single-block reads , / -. random I/O -, Oracle - io_submit, , 1, pread OS. . 5 SLOB (Kevin Closson) 12c. 3 , Oracle «TABLE ACCESS BY INDEX ROWID BATCHED» .

Fig. 5: SLOB, (batch access)
6 Oracle I/O SLOB. , - random I/O. , . 6, 126 io_submit, io_getevents, . — «db file parallel read», — 126 . db file parallel read - single block random reads .
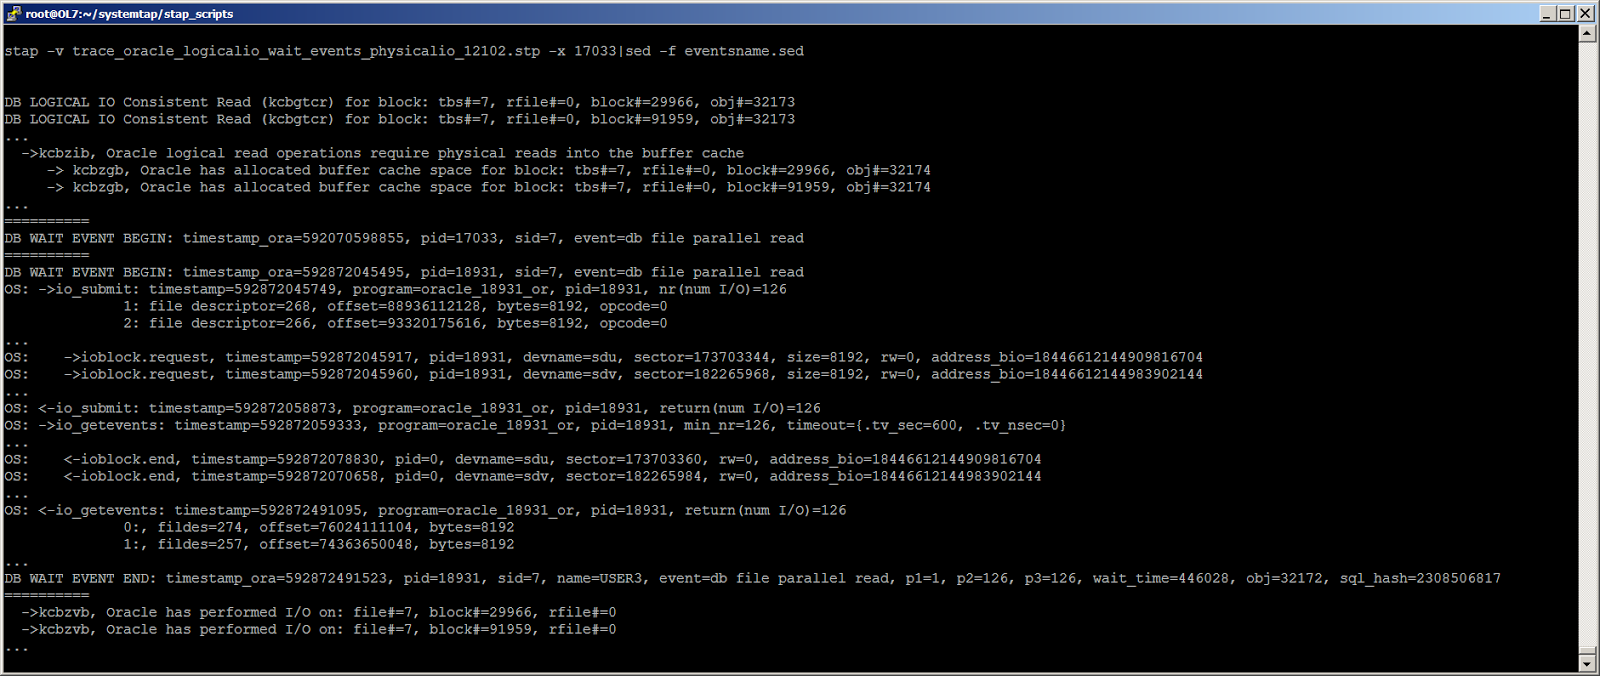
Fig. 6: Oracle, - -, batched reads. ( 126 , block#) "..."
6: DML
7 Oracle logical I/O , . - ( ). , current read, DML. , ( 7 tbs#=11), rollback segments ( 7 tbs#=2). , .
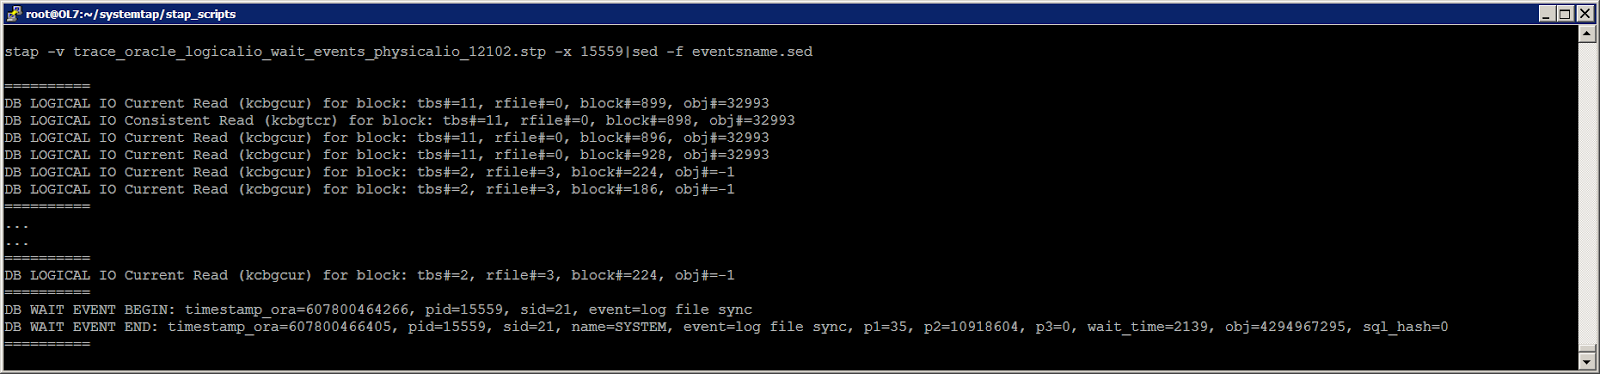
Fig. 7: Oracle logical I/O, commit
7: log writer
8 log writer commit. commit, 6 (. . 7 ). — «log file parallel write», Oracle -. , «log file parallel write» , . , 8, , log writer , 1 redo- , ASM- normal: log writer 2 - — - — .

Fig. 8: log writer commit
Conclusion
, , SystemTap Oracle I/O, Oracle I/O Oracle Linux. , , .
Oracle Oracle I/O OS , Oracle. Oracle - - . random reads, «db file sequential read». , , -, : -. , , - Oracle direct reads .
: for original ideas that inspired this work. Special thanks to Fritz Hugland, who generously shared with me his deep expertise on this issue.
Download scripts : The scripts discussed in this article can be found on the webpage with downloads or on GitHub .
And we continue to publish translations of articles from database specialists from CERN. Today’s material is the second part of a series of articles on tracing and debugging Oracle DB performance using SystemTap.
')
This article focuses on tracking logical and physical reads in Oracle using SystemTap. Here you will find a few examples illustrating the basic mechanisms used by Oracle to perform physical and logical I / O operations, and learn how to create SystemTap scripts for later diagnosis and troubleshooting of Oracle I / O.
Introduction
Performing input / output from and to media, i.e. Physical I / O is one of the most important tasks underlying all database engines. When accessing data stored in an in-memory database cache, we can talk about logical I / O. Physical I / O is performed by the database using OS kernel system calls. The type of system calls used depends on the parameters of the database, OS and type of storage. Logical I / O is performed by database processes using Oracle core functions. Oracle provides the measurement of physical I / O call times using the wait event interface, and logical I / O time is generally counted as CPU time. The I / O tracing performed by Oracle processes and supplemented by the details provided by the Oracle wait event interface is a powerful method for exploring the internal Oracle I / O device. With a few real-life examples, we’ll find out which mechanisms Oracle uses to access the repository, how I / O operations correlate to the wait event interface, and find out the time limit for the most common I / O wait events.
Creating a trace tool
Operations research that Oracle and OS perform when performing an I / O operation requires special tools. SystemTap is a dynamic trace tool designed specifically for Linux that allows you to monitor both OS and Oracle functions (Linux kernel functions, system calls, and Oracle database engine functions). The following is a description of a systemtap script that can be used to track the logical and physical I / O of Oracle: it consists of probes that can join interesting function calls and read function parameters, memory, and processor registers .
Systemtap requires relatively recent kernel versions to be able to profile userspace: utrace or uprobe_events functionality must be available. For example, RHEL / OL 6.5 and higher is suitable, but not RHEL 5. In addition, the debuginfo kernel package must be installed for the trace system calls.
You can read more about this and how to create a test environment in this article . The script that we use in this post to trace the logical and physical I / O of Oracle, as well as the interface of wait events, looks like this: trace_oracle_logicalio_wait_events_physicalio_12102.stp (for Oracle 12.1.0.2). An option for version 11.2.0.4 is also available: trace_oracle_logicalio_wait_events_physicalio_11204.stp . Before turning to the Oracle I / O study examples, I would like to look at three main parts of the script: tracking physical I / O, logical I / O, and wait events.
Physical I / O tracking
Ultimately, Oracle makes system calls to perform I / O operations. The type of calls depends on the parameters of the database, the type of OS and the type of storage. In this article, you can find examples for Oracle on Linux , using ASM storage on block devices. Please note that direct NFS, local storage and ASM with asmlib were not included in the article and may be considered in future studies. System calls can be traced including using the strace (1) utility on Linux. However, in this article you will see how probes SystemTap can be created to collect information about system calls of interest: pread, pwrite, io_submit, and io_getevents . The following SystemTap probes can be useful for the “underlying” block I / O layer: ioblock.request, ioblock_trace.request and ioblock.end (note that these are not system calls, but trace points for function calls inside the Linux kernel).
| Probe name | Function | Selected parameters |
| syscall.pread / pwrite | Synchronous I / O: read / write from / to the file descriptor | fd (file descriptor number), offset, number. Return value: read / written byte |
| syscall.io_submit | Asynchronous I / O: sending blocks for processing | nr (number of I / O operations). For each operation: file descriptor, offset, bytes, operation code (0 for reading, 1 for writing) Return value: the number of I / O operations performed |
| syscall.io_getevents | Asynchronous I / O: reading events from a run queue | min_nr (minimum number of I / O operations for reading), timeout waiting for an event. Return value: the number of collected I / O operations, For each operation: file descriptor, offset, bytes. |
| ioblock.request, ioblock_trace.request | I / O requests sent to the block device interface level | devname, sector, size, rw, address of block_io structure |
| ioblock.end | Returning from the kernel level of the block device interface | devname, sector, rw, address of block_io structure |
Note added in August 2015: Systemtap probes for kernel.trace ('block_rq_issue') and kernel.trace ('block_rq_complete') can also be used to examine the block I / O interface with the added advantage: they do not require a kernel debuginfo. Examples of such probes can be found on the downloads page or on GitHub .
Logical I / O Tracking
This is the history and details of logical I / O operations when Oracle reads a block of data from memory (buffer cache). Logical I / O operations include a subset of physical I / O operations: if Oracle does not find the data in memory ( buffer cache ), it performs a physical read. You can find several examples of this mechanism in action later in this article.
The Oracle toolkit provides extensive information about logical readings in several V $ views, such as V $ SYSSTAT , V $ SESSTAT, V $ SYSMETRIC. Also data on logical readings are available from sql * plus with the “set autotrace on” parameter and with tkprof reports on event traces 10046 . Logical readings are of two main types: consistent and current. Oracle will use consistent reads when reading data with a given system change number SCN, current reads are used when performing DML operations on a block. Consistent reads can be traced to Oracle using events 10200 and 10201 . More information can be found in the Julian Dyke presentation on logical I / O.
In this article, we will show how to track logical I / O by connecting the SystemTap probes to the Oracle kernel feature set. The role of the kcbgtcr and kcbgcur functions for the consistent and current reads tracing has already been discussed by Alexander Anokhin in his excellent articles on Dtrace LIO . Most recently, I researched this topic and found it useful to also trace the functions kcbzib, kcbzgb, kcbzvb .
A summary of what I found out about these functions is given in the table below. Note: the expressions% rdi,% rsi,% r8 indicate the values of the corresponding processor registers . Using SystemTap, the register value can be read using the register function, for example: register ('rdi'). CPU registers are used to retrieve function call arguments . Systemtap does not provide function call arguments when there are no debug symbols for the executable file. In particular, the calling conventions for x86-64, as described at www.x86-64.org/documentation/abi.pdf , indicate that the integer parameters for the function call are available in the following registers (in order):% rdi,% rsi ,% rdx,% rcx,% r8 and% r9.
| Function name | Task to be performed | Selected parameters |
| kcbgtcr | Kernel Cache Buffers Get Consistent Read Used for consistent reads | tbs # = user_int32 (% rdi) rel file n # = user_int32 (% rdi + 4) >> 22 & 0x003FFFFF block # = user_int32 (% rdi + 4) & 0x003FFFFF data_object_id # = user_int32 (% rdi + 8) object_id # = user_int32 (% rdi + 12) Note: for bigfile tablespaces: block # = user_int32 (% rdi + 4) |
| kcbgcur | Kernel Cache Buffers Current Used for current reads | tbs # = user_int32 (% rdi) rel file n # = user_int32 (% rdi + 4) >> 22 & 0x003FFFFF block # = user_int32 (% rdi + 4) & 0x003FFFFF data_object_id # = user_int32 (% rdi + 8) object_id # = user_int32 (% rdi + 12) Note: for bigfile tablespaces: block # = user_int32 (% rdi + 4) |
| kcbzib | kcbZIB stands for: Z (kcbz.o is a module for auxiliary functions of physical input-output), IB: Input Buffer Oracle will perform the physical read (s) in the buffer cache | |
| kcbzgb | The suffix GB in kcbZGB stands for: Get (space for) Buffer Oracle allocates space in the buffer cache for a given block (usually before I / O operations). | tbs n # =% rsi rel file n # =% rdx >> 22 & 0x003FFFFF block # =% rdx & 0x003FFFFF data_object_id # =% r8 object_id # =% r9 Note: for bigfile tablespaces: block # =% rdx |
| kcbzvb | Called after Oracle read a given block This is part of the call chain for checking blocks managed by the db_block_checking parameter. Alleged decryption: Kernel cache buffer verify block. Thank you @FritsHoogland for this clarification. This function is used for both reads in the buffer cache and direct reads. | tbs n # =% rsi rel file n # =% rdx >> 22 & 0x003FFFFF, block # =% rdx & 0x003FFFFF data_object_id = user_int32 (% rdi + 24) Note: for bigfile tablespaces: block # =% rdx |
Note : at the time of this writing, only uprobes for kernels of version 3.10 and above support returned probes for userspace functions. Therefore, this functionality is not available in RHEL or OL 6.x, but is available in RHEL 7.x cores.
Tracking wait events
The wait-event interface is probably one of the best features in Oracle performance tuning, as it provides a quantitative method for identifying performance problems and bottlenecks. Cary Millsap has published an inspiring work on this topic.
For our purposes, it is enough to indicate that wait events are control points (instrumentation points) in which the selected actions of the Oracle core are measured. In particular, Oracle will mark the initial and final calls for most physical I / O operations, thus allowing you to understand well how much time is spent in the physical I / O process (some limitations of this mechanism are discussed later in this post). There are restrictions on using the wait event interface to study I / O latency , in particular, in the examples section you can find interesting problems related to measuring the duration of asynchronous I / O events.
Tracing wait events is usually activated in Oracle using event 10046 or by calling DBMS_MONITOR.SESSION_TRACE_ENABLE. In this article, we get the details of the wait event by attaching the probes SystemTap to the corresponding functions of the Oracle kernel, namely kskthbwt and kskthewt , to collect information at the beginning and at the end of each wait event, respectively. Enabling the tracing of wait events using event 10046 at level 8 and other methods is a way to retrieve information about the time of a wait event (as well as other details about SQL processing), rather than a way to include wait information. This, in turn, is done using the TIMED_STATISTICS database parameter, and in modern Oracle databases it should be set to TRUE. The key part of the information that the Oracle kernel kskthbwt and kskthewt functions give us is a pointer to the X $ KSUSE utility table (or rather, the “underlying” memory structure in the SGA), which is the “underlying” table for V $ SESSION and, therefore, it allows you to match wait events with a wealth of useful information about a session executing SQL Pointer dereferencing in the register r13 to the base value X $ KSUSE and calculating the offset for the fields of interest requires additional work, described in detail in the previous article (see also the script: ksuse_find_offsets.sql ).
| Function name | Task to be performed | Selected parameters |
| kskthbwt | Kernel service Kompile thread begin wait. This function is called at the beginning of the Oracle wait event. kslwtbctx is a call to its parent function and marks the start of a wait event. | Useful information for profiling function: register r13 -> points to a segmented X $ KSUSE array (V $ SESSION) in the SGA register rsi -> timestamp start waiting (in microseconds) register rdx -> number of wait events |
| kskthewt | Kernel service Kompile thread end wait. This function is called at the end of the Oracle wait event. kslwtectx is a parent function call that marks the end of a wait event. The “ewt” suffix most likely means “end wait”. | Useful information for profiling function: register r13 -> points to a segmented X $ KSUSE array (V $ SESSION) in the SGA register rdi -> wait timestamp (in microseconds) register rsi -> number of wait events |
Running script
Below you will find several trace examples for common Oracle I / O access patterns. Traces were obtained by the command stap -v trace_oracle_logicalio_wait_events_physicalio_12102.stp -x _pid_ , where _pid_ is the process identifier of the monitored session. The result is sent to sed -f eventsname.sed , where the translation of the event number into its associated name is provided. The eventsname.sed file is created by running the eventsname.sql script. It is important to restart the script to generate event names before testing, as wait event numbers may change without warning, for example, after migrating to newer versions or after installing a patch. The system used to collect traces in the following examples is Oracle 12.1.0.2, running on OEL 7.0 with UEK3 under Virtualbox.
Example 1: single-block random reads
This example is categorized as single block random reads. This way of accessing data is very important for many OLTP workloads , since it is used to access a table through an index key. In Figure 1 below, you can see a fragment of the trace file for the select query type col_list from table tab where indexed_col = val .
Fig. 1: Oracle Single-block random read and sequential read wait event from db file
Key points :
- Oracle performs a logical read of one of the blocks needed to retrieve data for SQL in this example:
- the logical read call contains additional information, which shows that Oracle wants to read block # = 2505675 from tbs # = 7, belonging to obj # = 32174 (which is a table segment in this example);
- the block was not found in the cache, so a new block is allocated in the buffer cache and a physical read is initiated;
- The database marks the start of the wait event for 'db file sequential read';
- the physical read request for the block becomes a pread call to the OS:
- IO request is sent to the kernel through a system call; any function that occurs after the system call is a kernel function (for example, ioblock.request) until the system call is completed and, thus, it does not again end up in userland (in this case, the Oracle executable file).
- This read function call is passed to the block I / O interface for reading 8192 bytes (1 database block) from the block device (/ dev / sdl in the example in Figure 1);
- the block interface and then the OS call return the read data to the Oracle kernel;
- The Oracle wait interface marks the end of the wait and calculates the elapsed time:
- wait event - “db file sequential read”, parameters: p1 — file number, p2 — block number, p3 — number of blocks read (1 block);
- from the timestamp values in the trace, you can see that the wait time for a sequential read db file depends on the time taken to complete the pread call at a low cost (note that the overhead could be more significant if we had a high load CPU on the database server, for example, due to workload from other Oracle sessions).
- We can conclude that in this example, the measured wait time for the sequential read of the db file corresponds to the delay associated with the physical reading .
Example 2: Sequential I / O Buffer Cache with Synchronous I / O
In this example, we are talking about multi-block reads in the cache. This is the access method that is used, for example, when Oracle performs a full table scan . There are several ways in which Oracle can access the repository to perform a full table scan, in this example you see a case where Oracle uses synchronous I / O (i.e., pread) to perform OS read operations, examples 3 and 4 encompass sequential reads with asynchronous I / O. In Figure 2 below, you can see the workload tracking snippet of the select type of the col_list form table tab , Oracle performs a full scan of the tab table.
Fig. 2: Oracle Sequential I / O when reading is performed using pread OS calls
Key points of the trace in Figure 2:
- Oracle performs a sequential read for tbs # = 7 block # = 2621443 and finds it in the cache.
- Oracle performs consistent read for the next block, does not find it in the cache, so it prepares to read the list of blocks from the repository in one physical read . This list consists of 124 blocks (it was shortened in this example for simplicity).
- The database marks the start of the wait event “db file scattered read” .
- Physical read requests become a single pread call to the OS to get 1015808 bytes (124 blocks).
- This query moves down the I / O chain to block I / O interfaces, which divide it by 2 reads from the “underlying” block device, since the system used for tests has a maximum I / O size of 524288 bytes.
- According to the Fritz Hoogland study, the submitted I / O request is placed on the I / O scattered / gather list, where it is broken down to the I / O sizes declared by the block device.
- The I / Os are performed by the block I / O interface.
- Callback pread.
- The wait event interface marks the wait time.
- The wait event is db file scattered read, and the parameters are: p1 is the file number, p2 is the block number, p3 is the number of blocks.
- From the timestamp values in the trace, it can be seen that the duration of waiting for the scattered read db file is mainly due to the time it takes to complete the pread call , at low cost.
- From the trace of the Oracle kernel kcbzvb function calls, we get additional confirmation of blocks that have been read.
- It can be concluded that in this example, the db scattered read timeout corresponds to an I / O delay .
Example 3: Sequential I / O to the buffer cache with calls to the asynchronous I / O functions of the OS
In Figure 3, you can see the SQL trace fragment select col_list from table tab , where Oracle performs a full scan of the tab table. This is the same query that was used in Example 2, the difference is that the trace in Figure 3 was made at a later stage of the query when the Oracle process switched from using synchronous I / O using pread calls to using the asynchronous I / O interface. . Asynchronous I / O is implemented in Linux by calling io_submit and io_getevents to send I / O requests and get results. Despite the fact that in this example, Oracle uses an asynchronous interface to perform read operations, the end result is very similar to the result presented in example 2 (that is, using synchronous I / O). The same Oracle wait event, “db file scattered read,” reads are also performed in the buffer cache, and the I / O results are collected using blocking calls, which actually makes the process synchronous. A more “aggressive use” of the interface for asynchronous I / O occurs in Oracle when performing direct reads, which are discussed in Example 4 below.
Fig. 3: Oracle performing sequential I / O reads to buffer cache using asynchronous I / O calls
Key points :
- Oracle performs a consistent read for tbs # = 7 block # = 2522760, does not find it in the cache, so it prepares to read the list of blocks in the buffer cache. This list consists of 128 blocks and is abbreviated in this example.
- The database marks the start of the wait event for “db file scattered read” .
- Requests for physical reading are transmitted to the OS as a call to io_submit with two requests with a total size of 1 MB (that is 128 blocks): the first request is for reading (opcode 0) of 65536 bytes, the second for the read operation of 983040 bytes (that is, 1 MB - 64 KB).
- These requests are sent to the block I / O interface , which separates the largest request by 2 reads from the “underlying” block device (/ dev / sdi in this example). A 64 KB read is passed to / dev / sdr without any change in size.
- Oracle calls io_getevents to get the results of the asynchronous I / O requests it has just sent, and waits. The timeout.tv_sec field is set to 600, which indicates that this blocking wait (this means that io_getevents expects 600 seconds (tv_sec) and 0 nanoseconds (tv_nsec)) to complete min_nr = 2 IO operations.
- The block device interface returns data up the call chain.
- Calling io_getevents returns two reads.
- The wait event interface marks the end of the wait. The wait event in this case is the scattered read of the db file.
- Parameters of the wait event: p1 is the file number, p2 is the block number, p3 is the number of blocks.
- The duration of a wait event is basically the time spent on io_submit and io_getevents calls, plus a small overhead.
- Notice that while Oracle used an asynchronous interface, it also waited for all I / O operations to complete, so I / O operations are, in fact, synchronous .
- From calls to kcbzvb we get additional confirmation of the read blocks.
- Conclusion: The db scattered read timeout in this example is not an accurate measure of I / O delays , since two reads on two different devices were requested in parallel , and the total time was reflected as if it were one read.
Example 4: full scans using direct reads and asynchronous I / O
In this section, you will find two examples of Oracle I / O in the case of direct reads in block storage configured with ASM . It uses the same query that performs the full table scan as examples 2 and 3. In this example, unlike examples 2 and 3, Oracle uses the serial direct read to access the data. Serial direct read is a function that appeared in 11gR2 to optimize full segment scan operations and bypass the buffer cache layer , similar to what happens with parallel queries. Oracle chooses when to use serial direct reads instead of cached reads based on several parameters. In the first approximation, direct reads are preferable when the table is “large” compared to the size of the buffer cache, but the actual mechanism is more complicated and could potentially change depending on the version of Oracle. You can find out more about this topic in the article by Tanel Poder .
To run these tests, I had to force the use of serial direct reads before launching the request, this was done using alter session set "_serial_direct_read" = always; .
Note that the request alter session set "_serial_direct_read" = never; can be used to disable serial direct reads and force Oracle to use cached reads (that is, the type of I / O that you saw in examples 2 and 3 above). The default value for the “_serial_direct_read” parameter is “auto”.
For research in this example, we can use a slightly different SystemTap probe than the previous ones. - - , probe userspace io_getevents_0_4 libaio (libaio — Linux, -). , serial direct reads -, libaio , (Frits Hoogland) . SystemTap, . 4a 4, : trace_oracle_wait_events_asyncio_libaio_12102.stp ( 11.2.0.4 trace_oracle_wait_events_asyncio_libaio_11204.stp ).
Fig. 4a: Oracle I/O full table scan serial direct read -. , full scan
4a:
- Oracle - 1 . , , readahead, .
- 1 db_file_multiblock_read_count=128, — 8 .
- Oracle - 1 io_submit , io_getevents_0_4 libiao, , . , - . Oracle 1 4 - ( - ).
- io_getevents, -, ( 600 ).
- «direct path read» .
- Oracle - io_getevents .
- - Oracle .
- 2 , 1 .
- - :
- «direct path read» 128 (1 MB), 2 MB.
- «direct path read» - .
- Oracle io_getevents, -.
- Oracle 2 .
serial direct reads Oracle , , . 4a. direct reads Oracle . , Oracle direct reads , . - -. I/O slots. , Oracle 10353 : « (slots) — -, -».
, -, direct reads, . , Oracle io_getevents timeout=0, - . . 4b. full scan, 4, , adaptive serial direct reads Oracle I/O, « » .
Fig. 4b. Oracle I/O full table scan serial direct read -. , , -
4:
- full scan, . 4a. , 4 full scan ( 1 ), adaptive serial direct reads - ( -).
- , io_submit .
- Oracle -: - 4, 4a (.. full scan) 2 .
- - io_getevents Oracle :
- , 1 , io_getevents , .
- , Oracle - io_getevents ( io_getevents_0_4 libaio, - -) 0, , Oracle , - , , .
- , Oracle " direct path read ", 3 io_getevents ( -, 600, ), 9 , 1 .
- - :
- 1 (128 ), 9 .
- 2 instrumentation .
- «db file direct read» - , , , -, 4.
- - :
5: - random reads
Oracle single-block reads , / -. random I/O -, Oracle - io_submit, , 1, pread OS. . 5 SLOB (Kevin Closson) 12c. 3 , Oracle «TABLE ACCESS BY INDEX ROWID BATCHED» .
Fig. 5: SLOB, (batch access)
6 Oracle I/O SLOB. , - random I/O. , . 6, 126 io_submit, io_getevents, . — «db file parallel read», — 126 . db file parallel read - single block random reads .
Fig. 6: Oracle, - -, batched reads. ( 126 , block#) "..."
6: DML
7 Oracle logical I/O , . - ( ). , current read, DML. , ( 7 tbs#=11), rollback segments ( 7 tbs#=2). , .
Fig. 7: Oracle logical I/O, commit
7: log writer
8 log writer commit. commit, 6 (. . 7 ). — «log file parallel write», Oracle -. , «log file parallel write» , . , 8, , log writer , 1 redo- , ASM- normal: log writer 2 - — - — .
Fig. 8: log writer commit
Conclusion
, , SystemTap Oracle I/O, Oracle I/O Oracle Linux. , , .
Oracle Oracle I/O OS , Oracle. Oracle - - . random reads, «db file sequential read». , , -, : -. , , - Oracle direct reads .
: for original ideas that inspired this work. Special thanks to Fritz Hugland, who generously shared with me his deep expertise on this issue.
Download scripts : The scripts discussed in this article can be found on the webpage with downloads or on GitHub .
Source: https://habr.com/ru/post/331324/
All Articles