Overview of server monitoring systems. Replacing munin with ...
I wanted to write an article for a long time, but I did not have enough time. Nowhere (including on Habré) did not find such a simple alternative to munin, as described in this article.
I am a backend developer and very often on my projects there are no dedicated admins (especially at the very beginning of the product’s life), so I’ve been doing basic server administration for a long time (initial installation-setup, backups, replication, monitoring, etc.). I like it very much and all the time I learn something new in this direction.
In most cases, a single server is enough for a project and I, as a senior developer (and just a responsible person), always needed to control its resources in order to understand when we rest on its limitations. For these purposes it was enough munin.
')
It is easy to install and has small requirements. It is written in perl and uses a ring database ( RRDtool ).
It was always enough to monitor server resources, and a free service like uptimerobot.com was used to monitor server availability.
I use this combination to monitor my home projects on a virtual server.
If the project grows from one server, then on the second server it is enough to install munin-node, and on the first one, add one line in the config to collect metrics from the second server. The charts for both servers will be separate, which is not convenient for viewing the overall picture - on which server the free space on the drive ends, and on which RAM it runs. This situation can be corrected by adding to the config a dozen lines for the aggregation of one graph with metrics from both servers. Accordingly, it is advisable to do this only for the most basic metrics. If you make a mistake in the config, you will have to read for a long time in the logs what exactly led to it and not finding the information to try to rectify the situation using the “spear method”.
Needless to say, for more servers this turns into a real hell. Maybe this is due to the fact that munin was developed in 2003 and was not originally designed for this.
I determined for myself the necessary qualities that the new monitoring system should have:
I will list all that I considered.
Almost the same as munin only in php . As a database, you can use rrdtool like munin or mysql . First release: 2001
Almost the same as the previous ones, written in php , as a database - rrdtool . First release: 1998 .
An even simpler system than the previous ones. Written on c , as a database - rrdtool . First release: 2005 .
It consists of three components written in python :
carbon collects their metrics writes them to the database
whisper - own rrdtool -like database
graphite-web - interface
First release: 2008 .
Professional monitoring system used by most admins. There is almost everything, including email notifications (for slack and telegram, you can write a simple bash script). Heavy for the user and for the server. I used to use impressions, as if I had returned from jira to mantis.
The kernel is written in c , the web interface in php . As a database can use: MySQL, PostgreSQL, SQLite, Oracle or IBM DB2 . First release: 2001
A worthy alternative to Zabbix. Written on p . First release: 1999 .
Fork Nagios. As a database, you can use: MySQL, Oracle, and PostgreSQL . First release: 2009 .
All of the above systems are worthy of respect. They are easily installed from packages in most linux distributions and have been used in production on many servers for a long time, they are supported, but very poorly developed and have an outdated interface.
Half of the products use sql-databases, which is not optimal for storing historical data (metrics). On the one hand, these databases are universal, and on the other, they create a greater load on the disks, and the data takes up more space during storage.
For such tasks, modern database of time series such as ClickHouse are more suitable.
New generation monitoring systems use time-series databases, some of them include them as an inseparable part, others are used as a separate component, and the third can work without any database at all.
Generally does not require a database, but can upload metrics to Graphite, OpenTSDB, Prometheus, InfluxDB . Written in c and python . First release: 2016 .
It consists of three components written in go :
prometheus - the kernel, its own built-in database and web interface.
node_exporter - an agent that can be installed on another server and send metrics to the kernel, works only with prometheus.
alertmanager is a notification system.
First release: 2014 .
It consists of four components written on go that can work with third-party products:
telegraf - an agent that can be installed on another server and send metrics, as well as logs to the influxdb , elasticsearch , prometheus or graphite databases , as well as to several queue servers .
influxdb is a database that can receive data from telegraf , netdata, or collectd .
chronograf - web interface for visualization of metrics from database.
kapacitor - notification system.
First release: 2013 .
Separately, I would like to mention such a product as grafana , it is written in go and allows you to visualize data from influxdb, elasticsearch, clickhouse, prometheus, graphite , as well as send notifications by mail, slack and telegram.
First release: 2014 .
On the Internet and on Habré, including, it is full of examples of the use of various components from different products to get what you need exactly.
carbon (agent) -> whisper (bd) -> grafana (interface)
netdata (as an agent) -> null / influxdb / elasticsearch / prometheus / graphite (as a database) -> grafana (interface)
node_exporter (agent) -> prometheus (as a database) -> grafana (interface)
collectd (agent) -> influxdb (db) -> grafana (interface)
zabbix (agent + server) -> mysql -> grafana (interface)
telegraf (agent) -> elasticsearch (bd) -> kibana (interface)
… etc.
Saw a mention even of such a bunch:
... (agent) -> clickhouse (bd) -> grafana (interface)
In most cases, grafana was used as an interface, even if it was in conjunction with a product that already contained its own interface (prometheus, graphite-web).
Therefore (and also because of its versatility, simplicity and convenience) I chose grafana as an interface and started to choose a database: prometheus was dropped because I didn’t want to pull all its functionality along with the interface because of only one database, graphite - database of the previous decade, reworked rrdtool-bd of the previous century, well, actually I settled on the influxdb and as it turned out - not one I made that choice .
Also for myself, I decided to choose telegraf, because it met my needs (a large number of metrics and the ability to write my own plugins in bash), and also works with different databases that may be useful in the future.
The final bundle I got is this:
telegraf (agent) -> influxdb (bd) -> grafana (interface + notifications)
All components do not contain anything extra and are written in go . The only thing I was afraid of was that this bundle would be difficult to install and configure, but as you can see below, it was in vain.
So, a short tig installation guide:
influxdb
Now you can make queries to the database (although the data is not there yet):
telegraf
Telegraf will automatically create a base in the influxdb with the name "telegraf", the login "telegraf" and the password "metricsmetricsmetricsmetrics".
grafana
The interface is available at
Initially, the interface will not do anything, because grafana does not know anything about the data.
1) You need to go to the sources and specify the influxdb (bd: telegraf)
2) You need to create your own dashboards with the necessary metrics (it will take a lot of time) or import already ready, for example:
928 - allows you to see all metrics for the selected host
914 is the same
61 - allows metrics for selected hosts on one graph
Grafana has a great tool for importing third-party dashboards (just enter its number), you can also create your own dashboards and share it with the community.
Here is a list of all dashboards that work with the data from influxdb that were collected using the telegraf collector.
All ports on your servers should be opened only from those ip that you trust or in the products you use should be enabled authorization and passwords are changed by default (I do both).
influxdb
In influxdb, authorization is disabled by default and anyone can do anything. Therefore, if there is no firewall on the server, I highly recommend enabling authorization:
telegraf
grafana
In the settings of the sources, you need to specify for influxdb a new login: “grafana” and password “password_for_grafana” from the item above.
Also in the interface you need to change the default password for the user admin.
Update: added the item to its criteria “free and open source”, forgot to specify it from the very beginning, and now I am advised to a bunch of paid / shareware / trial / closed software. There would be a free deal.
Update2: now a group of enthusiasts creates a table in google docs , comparing different monitoring systems by key parameters (Language, Bytes / point, Clustering). Work boils, the current cut under the cut.
Update3: another comparison of Open-Source TSDB in Google Docs. Slightly more elaborate, but less AnyKey80lvl systems
PS: if I omitted some moments in the description of the setup-installation, then write in the comments and I will update the article. Typos - in PM.
PPS: Of course, no one will hear this (based on previous experience of writing articles), but I still have to try: do not ask questions in PM on Habré, VC, FB, etc., and write comments here.
PPPS: the size of the article and the time spent on it strongly got out of the initial “budget”, I hope that the results of this work will be useful for someone.
I am a backend developer and very often on my projects there are no dedicated admins (especially at the very beginning of the product’s life), so I’ve been doing basic server administration for a long time (initial installation-setup, backups, replication, monitoring, etc.). I like it very much and all the time I learn something new in this direction.
In most cases, a single server is enough for a project and I, as a senior developer (and just a responsible person), always needed to control its resources in order to understand when we rest on its limitations. For these purposes it was enough munin.
')
Interface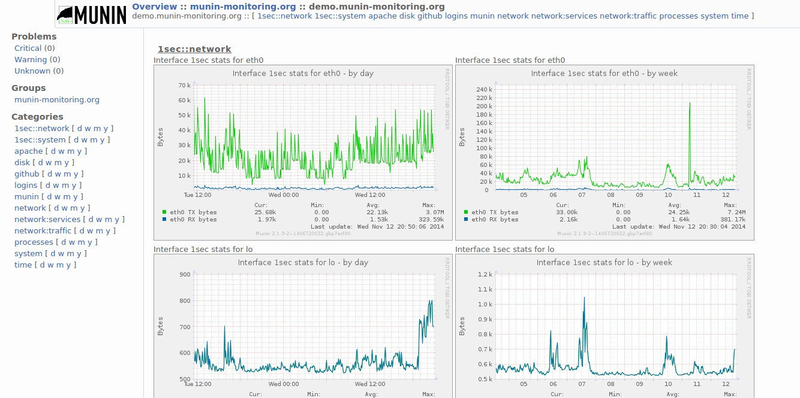
Munin
It is easy to install and has small requirements. It is written in perl and uses a ring database ( RRDtool ).
Installation example
Execute commands:
apt-get install munin munin-node
service munin-node start
Now munin-node will collect the system metrics and write them in the database, and munin will generate html reports from this database every 5 minutes and put them in the / var / cache / munin / www folder
For convenient viewing of these reports you can create a simple config for nginx
Actually that's all. You can already watch any graphs of CPU, memory, hard disk, network and much more for the day / week / month / year. Most often I was interested in the read / write load on the hard disk, because the database was always the bottleneck.
apt-get install munin munin-node
service munin-node start
Now munin-node will collect the system metrics and write them in the database, and munin will generate html reports from this database every 5 minutes and put them in the / var / cache / munin / www folder
For convenient viewing of these reports you can create a simple config for nginx
server { listen 80; server_name munin.myserver.ru; root /var/cache/munin/www; index index.html; } Actually that's all. You can already watch any graphs of CPU, memory, hard disk, network and much more for the day / week / month / year. Most often I was interested in the read / write load on the hard disk, because the database was always the bottleneck.
It was always enough to monitor server resources, and a free service like uptimerobot.com was used to monitor server availability.
I use this combination to monitor my home projects on a virtual server.
If the project grows from one server, then on the second server it is enough to install munin-node, and on the first one, add one line in the config to collect metrics from the second server. The charts for both servers will be separate, which is not convenient for viewing the overall picture - on which server the free space on the drive ends, and on which RAM it runs. This situation can be corrected by adding to the config a dozen lines for the aggregation of one graph with metrics from both servers. Accordingly, it is advisable to do this only for the most basic metrics. If you make a mistake in the config, you will have to read for a long time in the logs what exactly led to it and not finding the information to try to rectify the situation using the “spear method”.
Needless to say, for more servers this turns into a real hell. Maybe this is due to the fact that munin was developed in 2003 and was not originally designed for this.
Alternatives to munin for monitoring multiple servers
I determined for myself the necessary qualities that the new monitoring system should have:
- the number of metrics is not less than that of munin (it has about 30 basic graphs and about 200 more plug-ins in the bundle)
- the ability to write your own plugins on bash (I had two such plugins)
- have small server requirements
- ability to output metrics from different servers on the same graph without editing configs
- notifications by mail, slack and telegram
- Time Series Database is more powerful than RRDtool
- simple installation
- nothing extra
- free and open source
I will list all that I considered.
Cacti
Almost the same as munin only in php . As a database, you can use rrdtool like munin or mysql . First release: 2001
Interface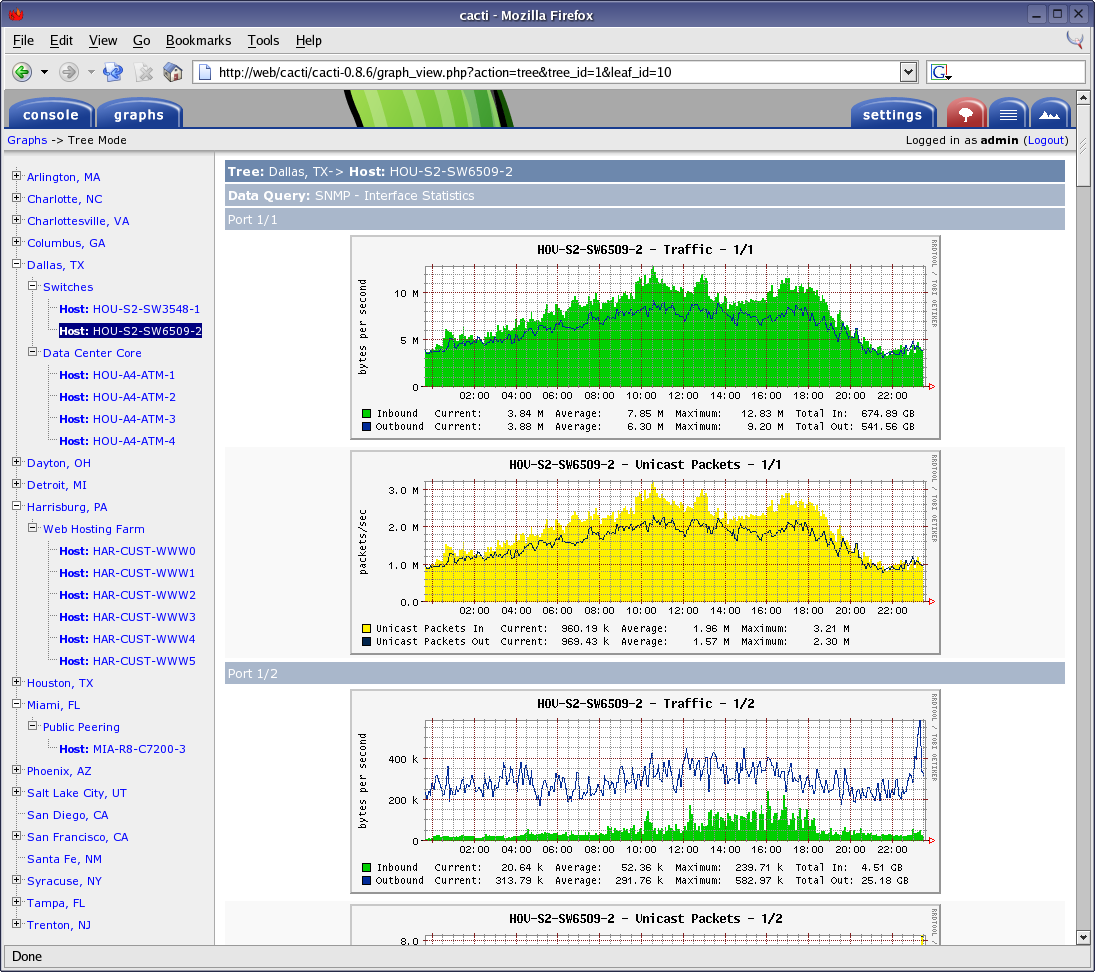
Ganglia
Almost the same as the previous ones, written in php , as a database - rrdtool . First release: 1998 .
Interface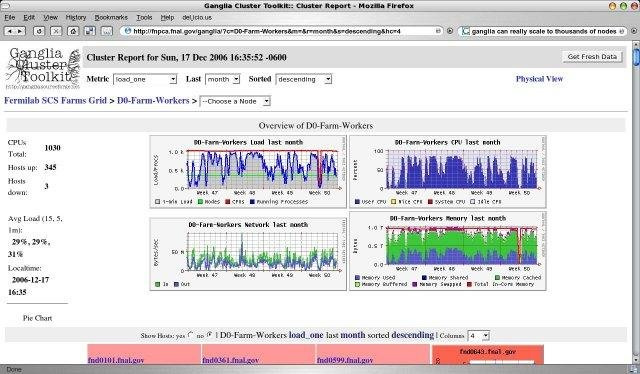
Collectd
An even simpler system than the previous ones. Written on c , as a database - rrdtool . First release: 2005 .
Interface
Graphite
It consists of three components written in python :
carbon collects their metrics writes them to the database
whisper - own rrdtool -like database
graphite-web - interface
First release: 2008 .
Interface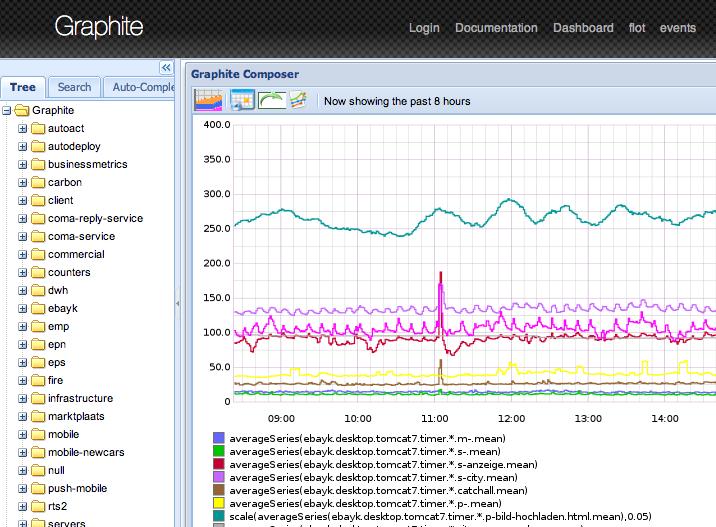
Zabbix
Professional monitoring system used by most admins. There is almost everything, including email notifications (for slack and telegram, you can write a simple bash script). Heavy for the user and for the server. I used to use impressions, as if I had returned from jira to mantis.
The kernel is written in c , the web interface in php . As a database can use: MySQL, PostgreSQL, SQLite, Oracle or IBM DB2 . First release: 2001
Interface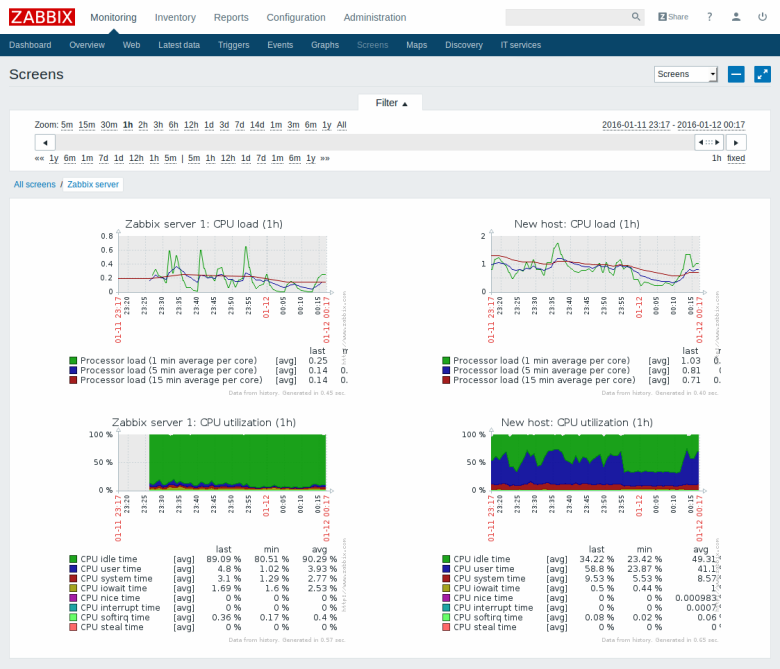
Nagios
A worthy alternative to Zabbix. Written on p . First release: 1999 .
Interface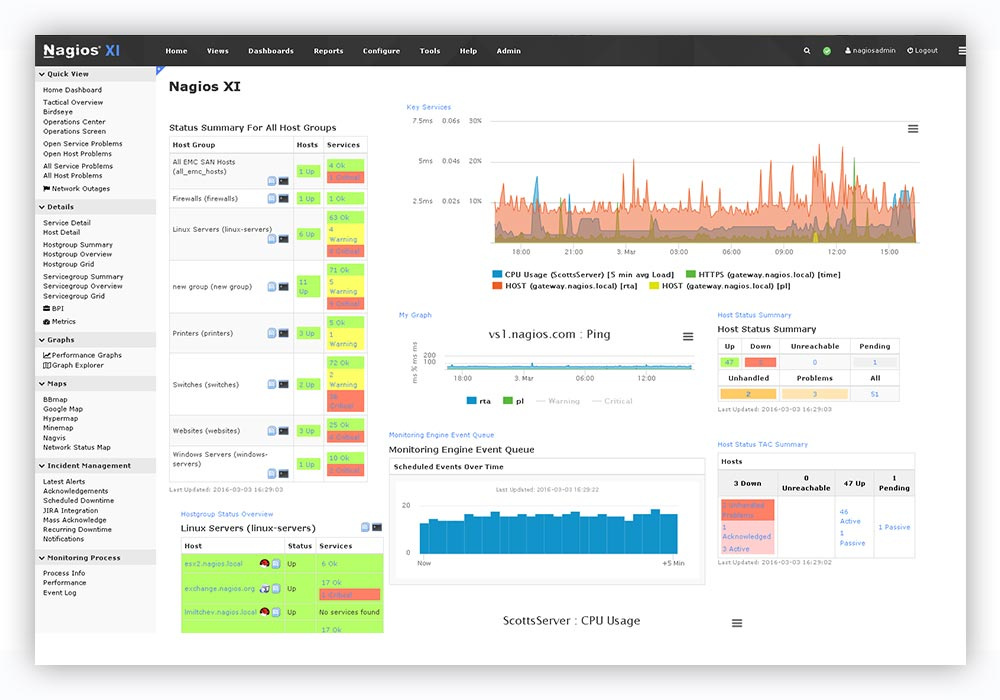
Iscinga
Fork Nagios. As a database, you can use: MySQL, Oracle, and PostgreSQL . First release: 2009 .
Interface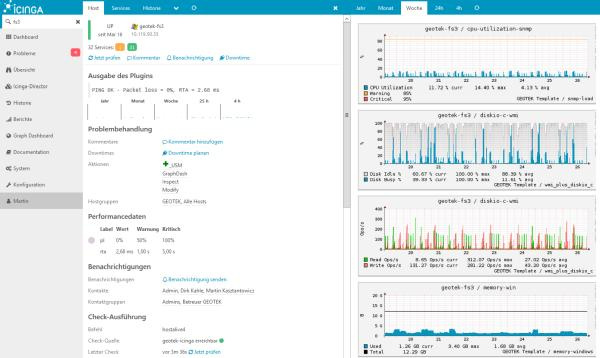
Small retreat
All of the above systems are worthy of respect. They are easily installed from packages in most linux distributions and have been used in production on many servers for a long time, they are supported, but very poorly developed and have an outdated interface.
Half of the products use sql-databases, which is not optimal for storing historical data (metrics). On the one hand, these databases are universal, and on the other, they create a greater load on the disks, and the data takes up more space during storage.
For such tasks, modern database of time series such as ClickHouse are more suitable.
New generation monitoring systems use time-series databases, some of them include them as an inseparable part, others are used as a separate component, and the third can work without any database at all.
Netdata
Generally does not require a database, but can upload metrics to Graphite, OpenTSDB, Prometheus, InfluxDB . Written in c and python . First release: 2016 .
Interface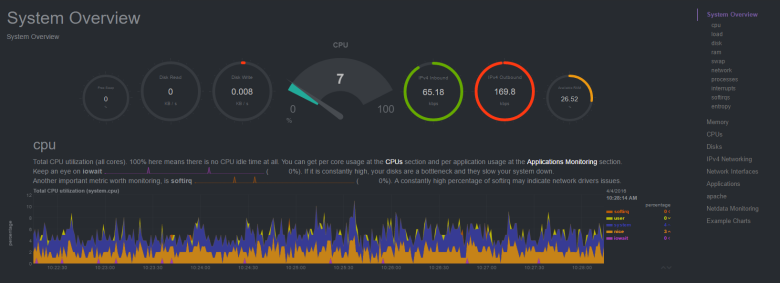
Prometheus
It consists of three components written in go :
prometheus - the kernel, its own built-in database and web interface.
node_exporter - an agent that can be installed on another server and send metrics to the kernel, works only with prometheus.
alertmanager is a notification system.
First release: 2014 .
Interface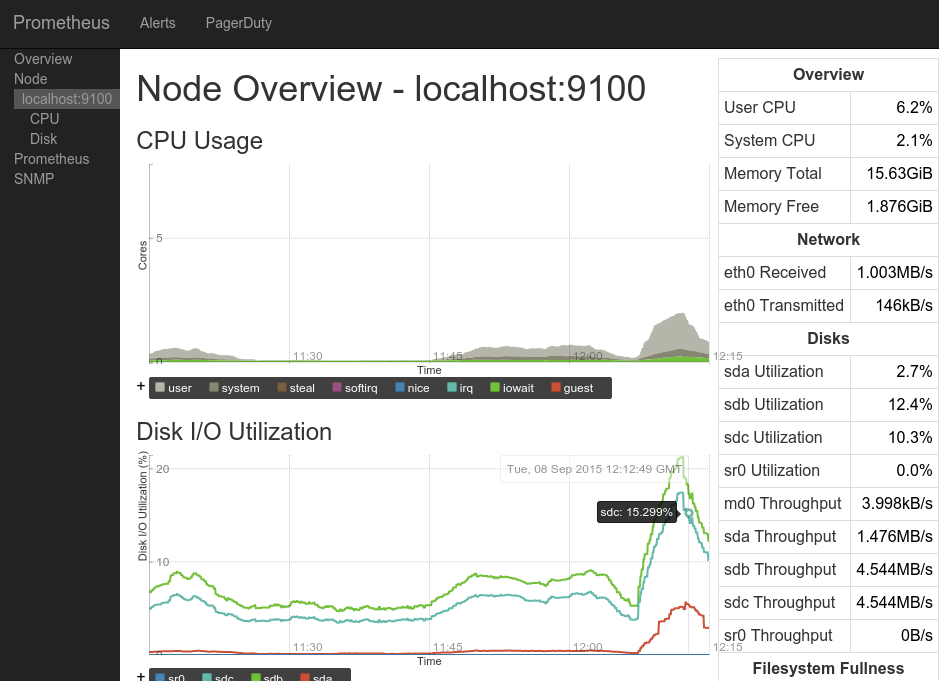
InfluxData (TICK Stack)
It consists of four components written on go that can work with third-party products:
telegraf - an agent that can be installed on another server and send metrics, as well as logs to the influxdb , elasticsearch , prometheus or graphite databases , as well as to several queue servers .
influxdb is a database that can receive data from telegraf , netdata, or collectd .
chronograf - web interface for visualization of metrics from database.
kapacitor - notification system.
First release: 2013 .
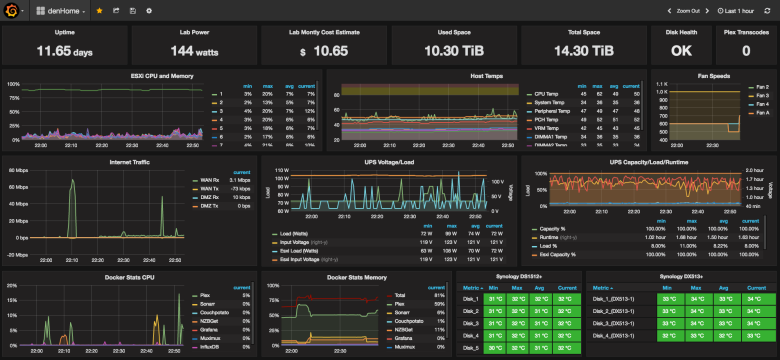
Interface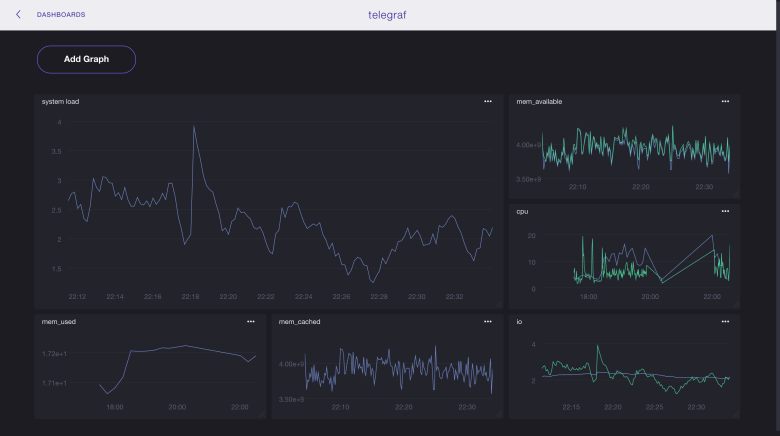
Separately, I would like to mention such a product as grafana , it is written in go and allows you to visualize data from influxdb, elasticsearch, clickhouse, prometheus, graphite , as well as send notifications by mail, slack and telegram.
First release: 2014 .
Interface
Choose the best
On the Internet and on Habré, including, it is full of examples of the use of various components from different products to get what you need exactly.
carbon (agent) -> whisper (bd) -> grafana (interface)
netdata (as an agent) -> null / influxdb / elasticsearch / prometheus / graphite (as a database) -> grafana (interface)
node_exporter (agent) -> prometheus (as a database) -> grafana (interface)
collectd (agent) -> influxdb (db) -> grafana (interface)
zabbix (agent + server) -> mysql -> grafana (interface)
telegraf (agent) -> elasticsearch (bd) -> kibana (interface)
… etc.
Saw a mention even of such a bunch:
... (agent) -> clickhouse (bd) -> grafana (interface)
In most cases, grafana was used as an interface, even if it was in conjunction with a product that already contained its own interface (prometheus, graphite-web).
Therefore (and also because of its versatility, simplicity and convenience) I chose grafana as an interface and started to choose a database: prometheus was dropped because I didn’t want to pull all its functionality along with the interface because of only one database, graphite - database of the previous decade, reworked rrdtool-bd of the previous century, well, actually I settled on the influxdb and as it turned out - not one I made that choice .
Also for myself, I decided to choose telegraf, because it met my needs (a large number of metrics and the ability to write my own plugins in bash), and also works with different databases that may be useful in the future.
The final bundle I got is this:
telegraf (agent) -> influxdb (bd) -> grafana (interface + notifications)
All components do not contain anything extra and are written in go . The only thing I was afraid of was that this bundle would be difficult to install and configure, but as you can see below, it was in vain.
So, a short tig installation guide:
influxdb
wget https://dl.influxdata.com/influxdb/releases/influxdb-1.2.2.x86_64.rpm && yum localinstall influxdb-1.2.2.x86_64.rpm #centos wget https://dl.influxdata.com/influxdb/releases/influxdb_1.2.4_amd64.deb && dpkg -i influxdb_1.2.4_amd64.deb #ubuntu systemctl start influxdb systemctl enable influxdb Now you can make queries to the database (although the data is not there yet):
http://localhost:8086/query?q=select+*+from+telegraf..cputelegraf
wget https://dl.influxdata.com/telegraf/releases/telegraf-1.2.1.x86_64.rpm && yum -y localinstall telegraf-1.2.1.x86_64.rpm #centos wget https://dl.influxdata.com/telegraf/releases/telegraf_1.3.2-1_amd64.deb && dpkg -i telegraf_1.3.2-1_amd64.deb #ubuntu # influxdb /etc/telegraf/telegraf.conf [[outputs.influxdb]] urls = ["http://localhost:8086"]: sed -i 's| urls = ["http://localhost:8086"]| urls = ["http://myserver.ru:8086"]|g' /etc/telegraf/telegraf.conf systemctl start telegraf systemctl enable telegraf Telegraf will automatically create a base in the influxdb with the name "telegraf", the login "telegraf" and the password "metricsmetricsmetricsmetrics".
grafana
yum install https://s3-us-west-2.amazonaws.com/grafana-releases/release/grafana-4.3.2-1.x86_64.rpm #centos wget https://s3-us-west-2.amazonaws.com/grafana-releases/release/grafana_4.3.2_amd64.deb && dpkg -i grafana_4.3.2_amd64.deb #ubuntu systemctl start grafana-server systemctl enable grafana-server The interface is available at
http://myserver.ru:3000 : http://myserver.ru:3000 . Login: admin, password: admin.Initially, the interface will not do anything, because grafana does not know anything about the data.
1) You need to go to the sources and specify the influxdb (bd: telegraf)
2) You need to create your own dashboards with the necessary metrics (it will take a lot of time) or import already ready, for example:
928 - allows you to see all metrics for the selected host
914 is the same
61 - allows metrics for selected hosts on one graph
Grafana has a great tool for importing third-party dashboards (just enter its number), you can also create your own dashboards and share it with the community.
Here is a list of all dashboards that work with the data from influxdb that were collected using the telegraf collector.
Focus on safety
All ports on your servers should be opened only from those ip that you trust or in the products you use should be enabled authorization and passwords are changed by default (I do both).
influxdb
In influxdb, authorization is disabled by default and anyone can do anything. Therefore, if there is no firewall on the server, I highly recommend enabling authorization:
# : influx -execute 'CREATE DATABASE telegraf' influx -execute 'CREATE USER admin WITH PASSWORD "password_for_admin" WITH ALL PRIVILEGES' influx -execute 'CREATE USER telegraf WITH PASSWORD "password_for_telegraf"' influx -execute 'CREATE USER grafana WITH PASSWORD "password_for_grafana"' influx -execute 'GRANT WRITE ON "telegraf" TO "telegraf"' # telegraf influx -execute 'GRANT READ ON "telegraf" TO "grafana"' # grafana # /etc/influxdb/influxdb.conf [http] auth-enabled : sed -i 's| # auth-enabled = false| auth-enabled = true|g' /etc/influxdb/influxdb.conf systemctl restart influxdb telegraf
# /etc/telegraf/telegraf.conf [[outputs.influxdb]] : sed -i 's| # password = "metricsmetricsmetricsmetrics"| password = "password_for_telegraf"|g' /etc/telegraf/telegraf.conf systemctl restart telegraf grafana
In the settings of the sources, you need to specify for influxdb a new login: “grafana” and password “password_for_grafana” from the item above.
Also in the interface you need to change the default password for the user admin.
Admin -> profile -> change password Update: added the item to its criteria “free and open source”, forgot to specify it from the very beginning, and now I am advised to a bunch of paid / shareware / trial / closed software. There would be a free deal.
How did I choose
1) first looked at the comparison of monitoring systems on the English Wikipedia
2) looked at the top projects on the githaba
3) looked what is on this subject on Habré
4) google which systems are now in trende
2) looked at the top projects on the githaba
3) looked what is on this subject on Habré
4) google which systems are now in trende
Update2: now a group of enthusiasts creates a table in google docs , comparing different monitoring systems by key parameters (Language, Bytes / point, Clustering). Work boils, the current cut under the cut.
Screenshot at 15:15
Update3: another comparison of Open-Source TSDB in Google Docs. Slightly more elaborate, but less AnyKey80lvl systems
PS: if I omitted some moments in the description of the setup-installation, then write in the comments and I will update the article. Typos - in PM.
PPS: Of course, no one will hear this (based on previous experience of writing articles), but I still have to try: do not ask questions in PM on Habré, VC, FB, etc., and write comments here.
PPPS: the size of the article and the time spent on it strongly got out of the initial “budget”, I hope that the results of this work will be useful for someone.
Source: https://habr.com/ru/post/331016/
All Articles