Architecture and indexing algorithms audio records VKontakte
We'll tell you how the search for similar tracks is arranged among all the VKontakte audio recordings.
Why is all this necessary?
We really have a lot of music. A lot - it's more than 400 million tracks that weigh about 4 PB. If you download all the music from VKontakte to 64 GB iPhones, and put them on top of each other, you’ll get a tower above the Eiffel Tower. Every day, another 25 iPhones need to be added to this stack — or 150,000 new 1.5 TB audio recordings.
')
Of course, not all of these files are unique. Each audio has information about the artist and title (optional - text and genre), which the user fills when loading songs on the site. There is no pre-moderation. As a result, we get the same songs under different names, remixes, concert and studio recordings of the same songs, and, of course, absolutely incorrectly named tracks.
If you learn to accurately find the same (or very similar) audio recordings, you can use it with benefit, for example:
- do not duplicate in search one track under different names;
- offer to listen to your favorite song in higher quality;
- add covers and lyrics to all song options;
- improve the recommendation mechanism;
- improve work with content owner complaints.
Perhaps the first thing that comes to mind is ID3 tags. Each mp3-file has a set of metadata, and you can take this information into account as a higher priority than what the user specified in the site interface when loading the track. This is the easiest solution. And it is not too good - the tags can be edited manually, and they do not necessarily correspond to the content.
So, all the information associated with the file that we have is human-dependent and may be unreliable. So you need to be taken for the file itself.
We set ourselves the task of identifying tracks that are the same or very similar to the ear, while analyzing only the contents of the file.
It seems someone already did it?
Finding similar audio is a pretty popular story. The solution that has already become a classic is used by everyone, from Shazam to biologists studying howling wolves. It is based on acoustic prints.
An acoustic fingerprint is a representation of an audio signal as a set of values that describe its physical properties.
Simply put, the imprint contains some information about the sound, and this information is compact - its volume is much smaller than that of the original file. Songs similar to the ear will have the same prints, and vice versa, the songs with different sounding tracks will not have the same prints.
We started by trying to use one of the ready-made C ++ solutions to generate acoustic footprints. They screwed up their search for it, tested it on real files and realized that for a significant part of the sample the results are bad. The same track is successfully “masked” by the equalizer, adding background noise or jingles, gluing with a fragment of another track.
Here's what it looks like (compared to the original track):
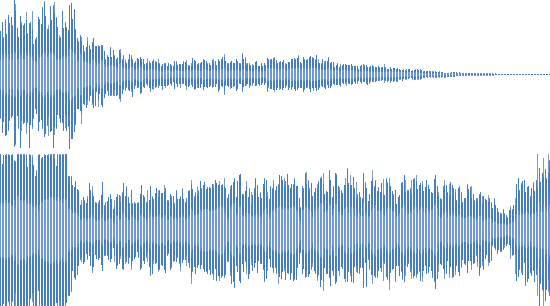
Live performance
Echo

Remix
In all these cases, the person will easily understand that this is one and the same composition. We have a lot of files with similar distortions, and it is important to be able to get a good result on them. It became clear that we need our own implementation of the fingerprint generator.
Fingerprint generation
Well, we have an audio recording as an mp3 file. How to turn it into a compact footprint?
We need to start with decoding the audio signal that is packed into this file. MP3 is a frame chain (block) that contains encoded audio data in PCM format (pulse code modulation) - this is uncompressed digital audio.
To get PCM from MP3, we used the libmad library on C and our own wrapper for it on Go. Later opted for the direct use of ffmpeg .
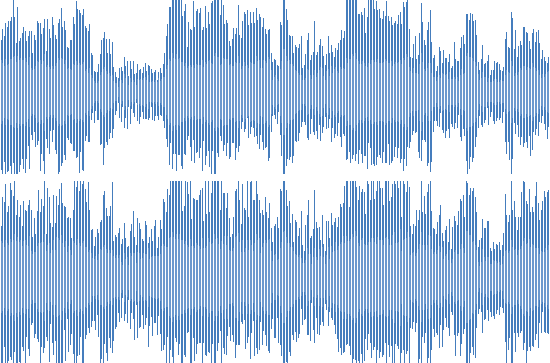
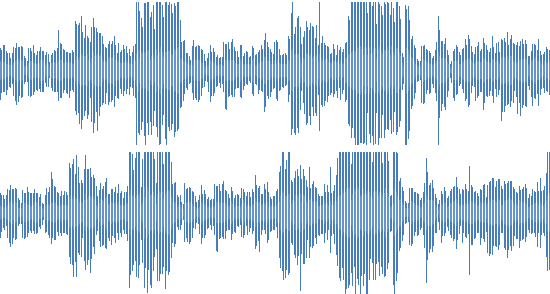
One way or another, as a result, we have an audio signal in the form of an array of values that describe the amplitude as a function of time. You can present it in the form of such a schedule:
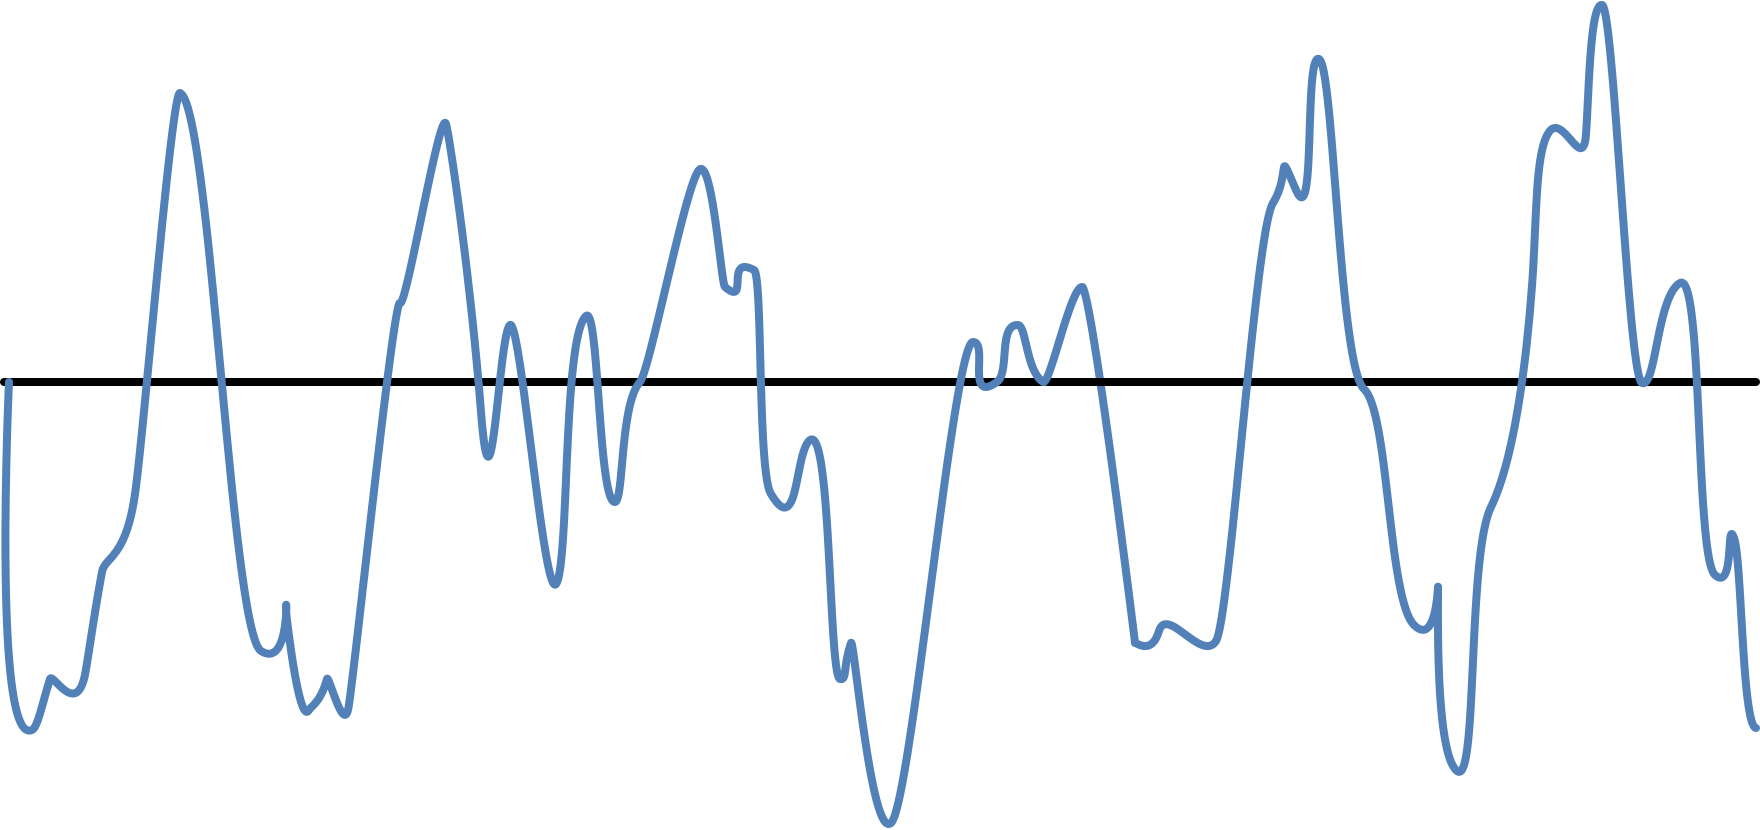
Audio signal
This is the sound that our ear hears. A person can perceive it as a single whole, but in reality a sound wave is a combination of a set of elementary waves of different frequencies. Something like a chord, consisting of several notes.
We want to know what frequencies are in our signal, and especially - which ones are the most “characteristic” for it. Let us resort to the canonical method of obtaining such data - the fast Fourier transform (FFT).
A detailed description of the mathematical apparatus is beyond the scope of this article. You can learn more about applying the Fourier transform in digital signal processing, for example, in this publication .
In our implementation, the GO-DSP (Digital Signal Processing) package is used, namely github.com/mjibson/go-dsp/fft — FFT itself and github.com/mjibson/go-dsp/window — for the Hann window function.
At the output, we obtain a set of complex numbers, which, being transferred to a plane, are called a spectrogram.
Spectrogram is a visual representation of all three acoustic measurements: time, frequency and signal amplitude. It expresses the amplitude value for a specific frequency value at a specific point in time.
For example:
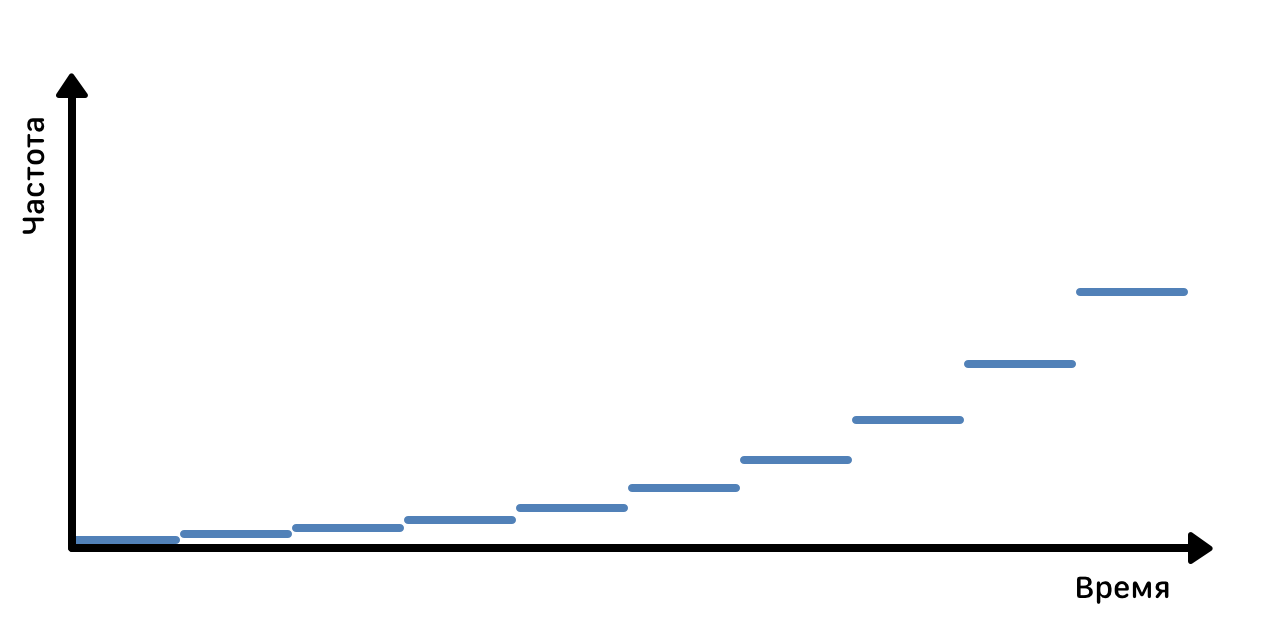
Spectrogram reference track
On the X axis, time is counted, the Y axis represents the frequency, and the amplitude value is indicated by the color intensity of the pixel. The illustration shows the spectrogram for the "reference" signal with a uniformly increasing frequency. For an ordinary song, the spectrogram looks like this:
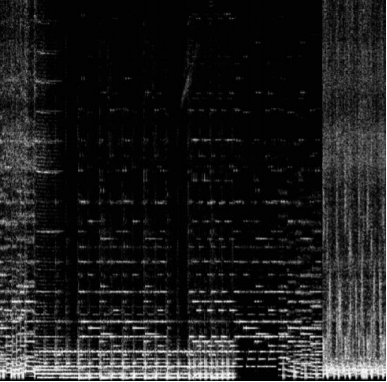
Spectrogram usual track
This is a rather detailed “portrait” of the audio track, from which it is possible (with a certain approximation) to restore the original track. From the point of view of resources, storing such a “portrait” is completely unprofitable. In our case, this would have required 10 PB of memory — two and a half times more than the audio recordings themselves weigh.
We select key points (peaks) on the spectrogram, based on the intensity of the spectrum, in order to save only the most characteristic values for this track. As a result, the amount of data is reduced by about 200 times.
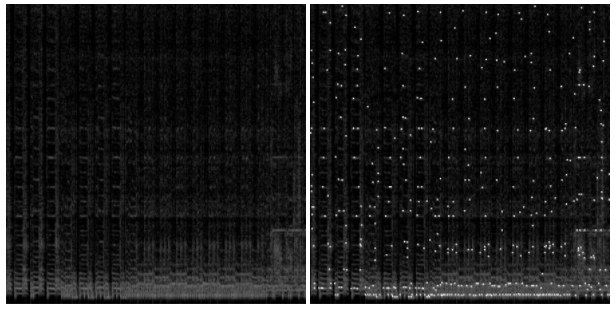
Key values on the spectrogram
It remains to collect this data in a convenient form. Each peak is uniquely determined by two numbers - the values of frequency and time. Adding all the peaks for the track in one array, we get the desired acoustic imprint.
Fingerprint comparison
Suppose we have done all of the above for two conditional tracks, and now we have their prints. Let's return to the original problem - compare these tracks with the help of prints and find out if they are similar (identical) or not.
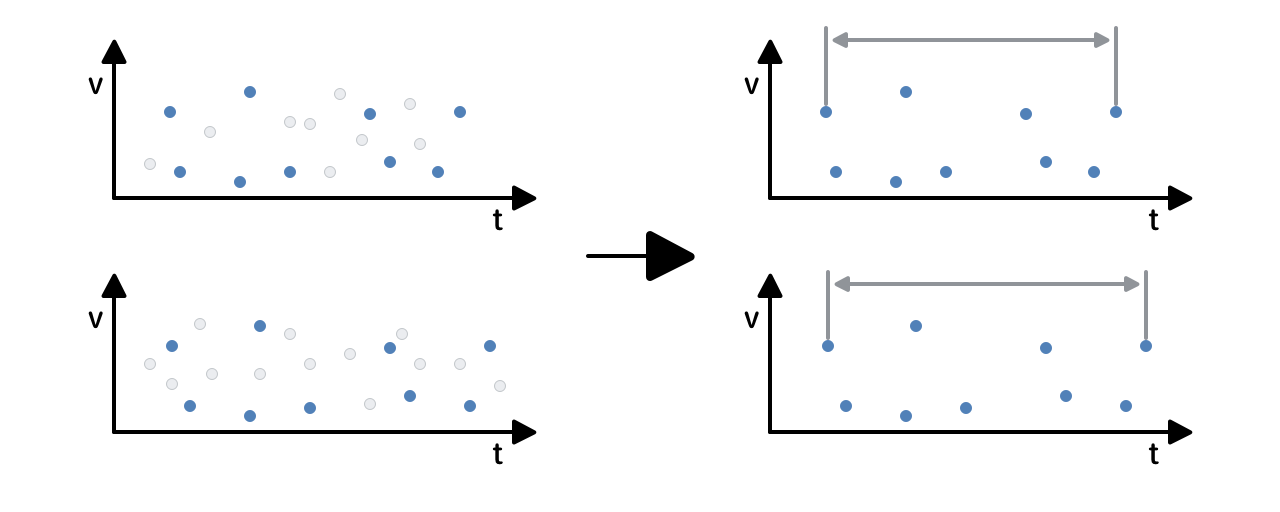
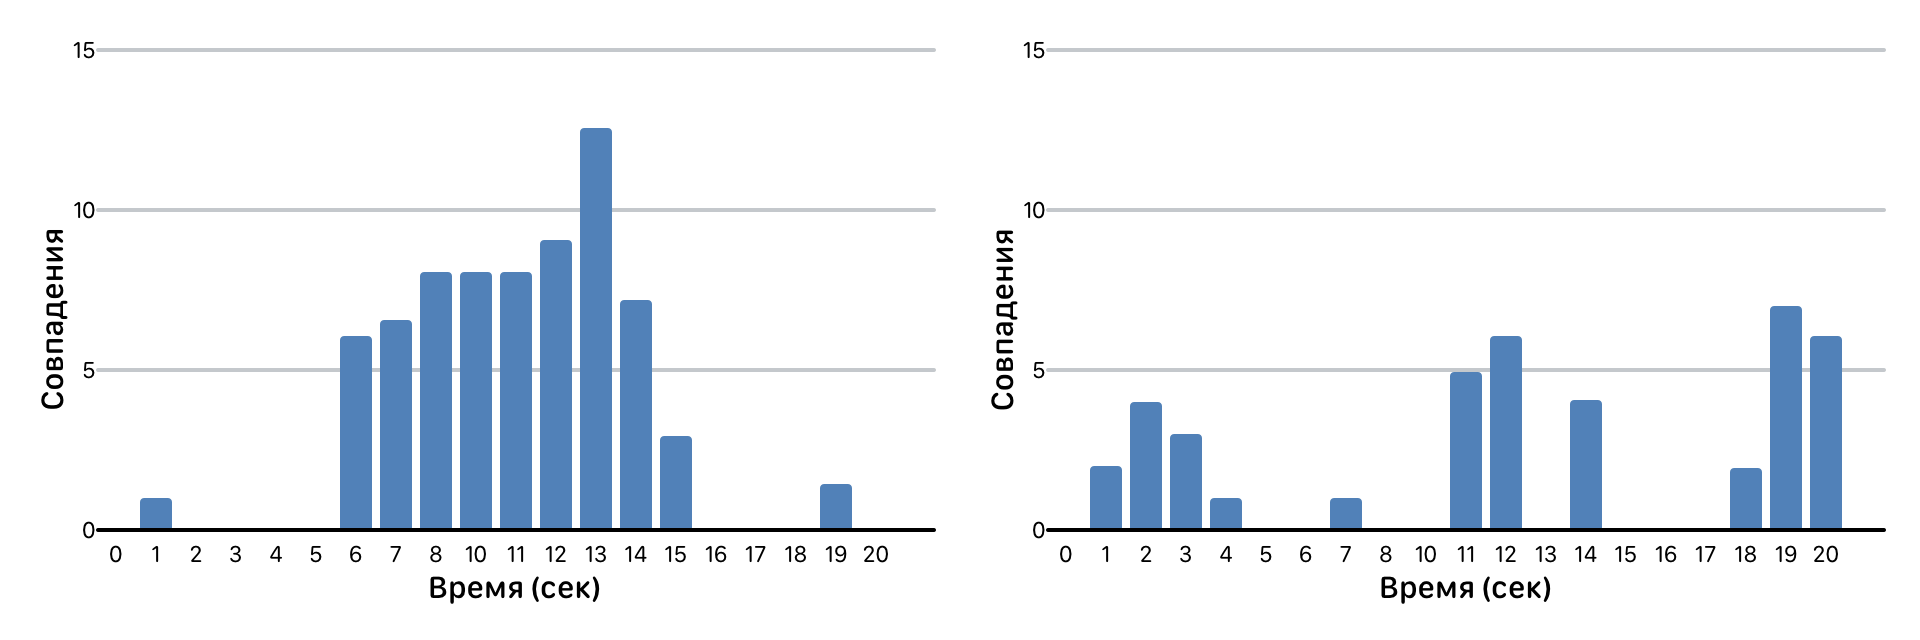
Each fingerprint is an array of values. Let's try to compare them element by element, shifting the tracks on the time scale relative to each other (shift is needed, for example, to take into account silence at the beginning or end of the track). There will be more coincidences in prints on some displacements, less on others. It looks like this:
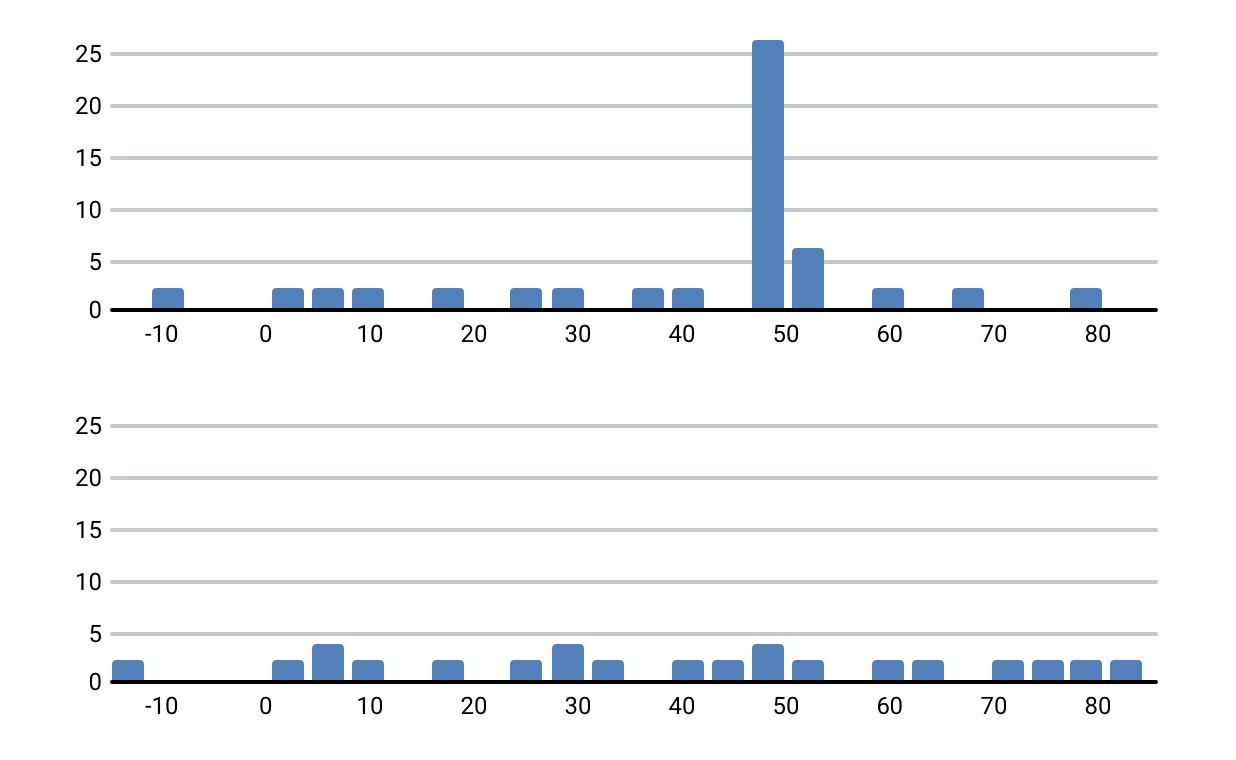
Tracks with a common fragment and different tracks
It looks like the truth. For tracks with a common fragment, this fragment was found and looks like a surge in the number of coincidences at a certain time offset. The result of the comparison is the “similarity coefficient”, which depends on the number of matches with the offset.
A software implementation of the Go library for generating and comparing fingerprints is available on GitHub . You can see graphs and results for your own examples.
Now we need to embed all this into our infrastructure and see what happens.
Architecture
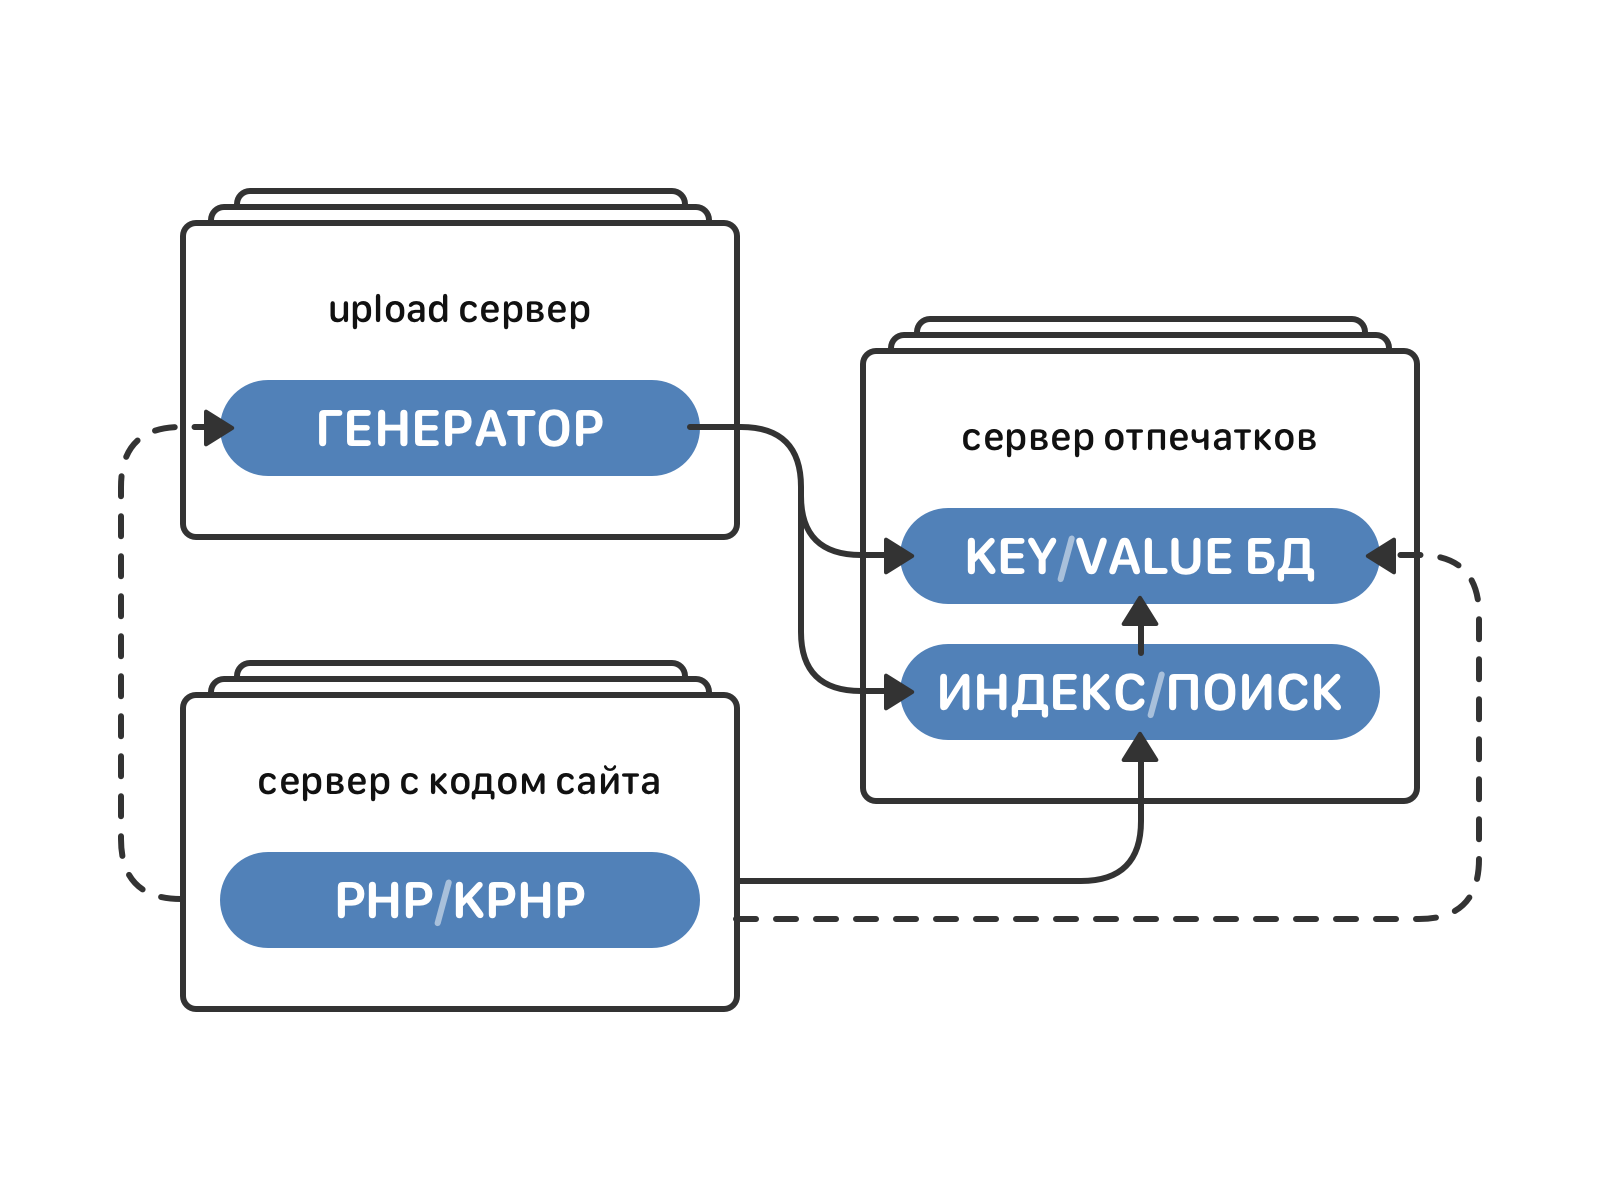
Fingerprint generation and indexing / search engines in the VC architecture
The fingerprint generation engine runs on each server for downloading audio (there are about 1000 of them now). It takes an mp3 file as input, processes it (decoding, FFT, extracting spectrum peaks) and produces an acoustic imprint of this audio.
The load is parallelized at the file level - each track is processed in a separate gorutin. For an average audio recording with a duration of 5-7 minutes, processing takes 2-4 seconds. Processing time increases linearly with increasing audio duration.
Acoustic prints of all tracks, albeit with some loss of accuracy, will take about 20 TB of memory. All this amount of data needs to be stored somewhere and be able to quickly access it in order to find something in it. This task is solved by a separate indexing and search engine.
It stores fingerprint data in the form of inverse (inverted) indices:
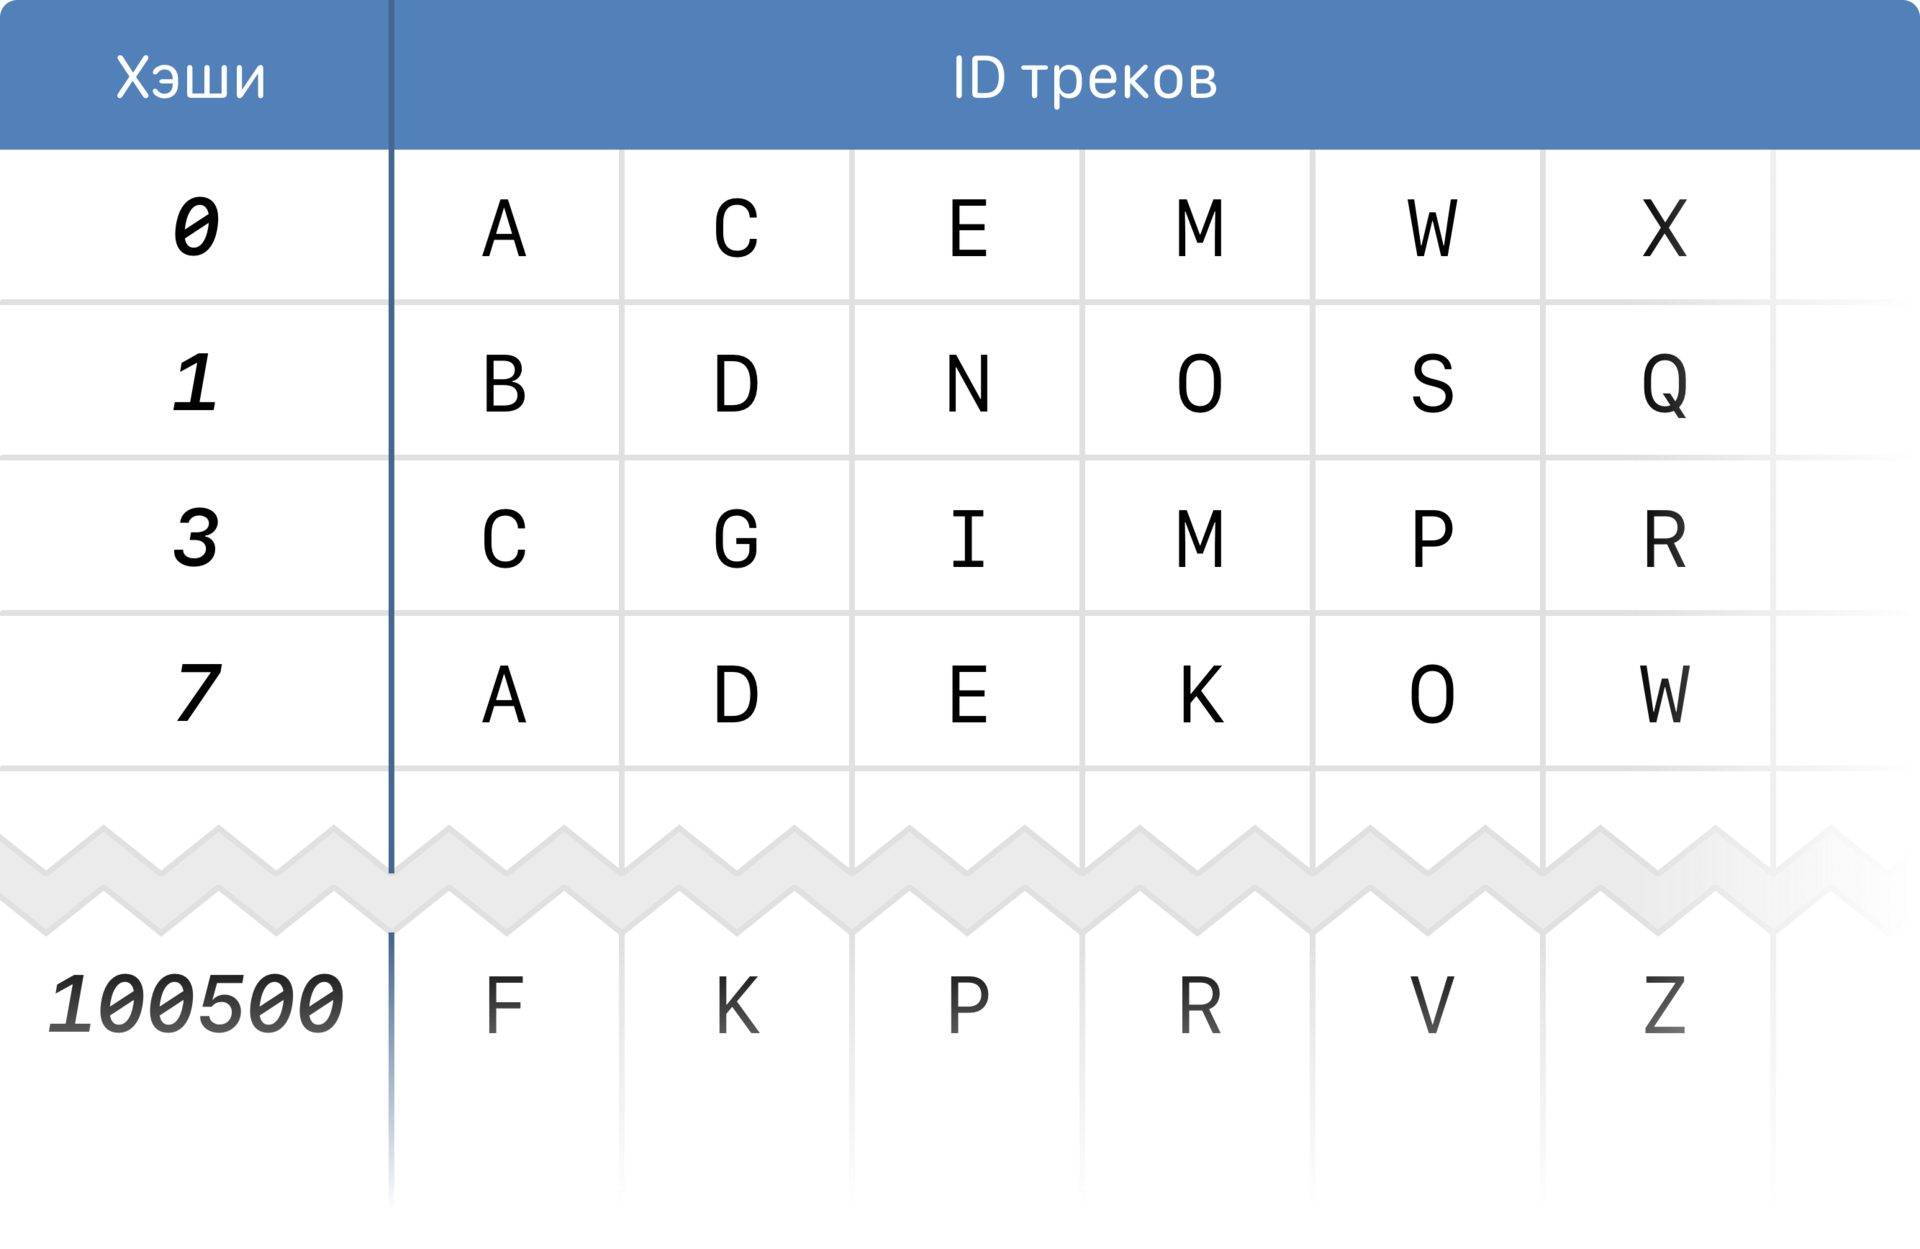
Reverse index
To achieve speed and save on memory, we use the advantages of the structure of the print itself. An imprint is an array, and we can consider its individual elements (hashes), which, as you remember, correspond to the peaks of the spectrum.
Instead of storing the match “track” → “fingerprint”, we break each fingerprint into hashes and store the “hash” correspondence → “list of tracks in which it has prints”. The index is thinned out, and 20 TB of prints as an index will occupy about 100 GB.
How does it work in practice? In the search engine comes a request with audio. It is necessary to find tracks similar to it. From the repository downloaded fingerprint for this audio. In the index, the lines containing the hashes of this print are selected. Frequently selected tracks are selected from the corresponding lines, fingerprints are downloaded for them from the repository. These fingerprints are compared to the fingerprint of the source file. As a result, the most similar tracks with the corresponding matched fragments and the conditional “similarity coefficient” for these fragments are returned.
The index and search engine runs on 32 machines, written in pure Go. Here, gorutines and pools of internal workers are used to the maximum, work with the network and the global index will be parallel.
So, all the logic is ready. Let's collect prints of all music, index it and start working with them. By the way, how long does it take?
We started the indexing, waited a couple of days and estimated the time. As it turned out, the result will be about a year. Such a term is unacceptable - you need to change something.
The introduction of sync.Pool, wherever possible, has taken 2 months. New term: 10 months. It is still too long. Need better.
We optimize the data type - the selection of tracks by index was implemented by merging the array. Using container / heap instead of an array promises to save half the time. We get 6 months of execution. Maybe you can do better?
Sharpen container / heap for using our data type instead of standard interfaces, and win another month of time. But this is not enough for us (that is, a lot).
Rule stdlib by making your own implementation for container / heap - still minus 2 months, for a total of 3. Four times less than the first estimates!
And finally, the upgrade of the Go version from 1.5 to 1.6.2 led us to the final result. 2.5 months was required to create an index.
What happened?
Production testing revealed several cases that we did not take into account initially. For example, a copy of a track with a slightly changed playback speed:
Fast track
For the listener, this is practically the same thing, a slight acceleration is not perceived as a significant difference. Unfortunately, our algorithm for comparing prints considered such tracks completely different.
To fix this, we added a bit of conversion. It consists in finding the largest common subsequence (Longest Common Subsequence) in two prints. After all, the amplitude and frequency do not change, in this case only the corresponding time value changes, and the general sequence order of the points behind each other is preserved.
LCS
Finding LCS allows you to determine the ratio of "compression" or "stretching" of the signal on a time scale. Next is the small thing - we compare the prints as usual, applying the coefficient found to one of them.
The use of the LCS search algorithm has significantly improved the results - many tracks that were not previously fingerprinted have been successfully processed.
Another interesting case - the coincidence of the fragments. For example, minus some popular song recorded on top of amateur vocals.
Matches of track fragments
We decompose the result of the comparison in time and look at the number of matches for each second of the track. The picture above is just an example of amateur recording over a minus in comparison with the original track of this minus. The absence of coincidence intervals is vocal, the coincidence peaks are silence (that is, a pure minus that is similar to the original track). In such a situation, we count the number of fragments with coincidences and calculate the conditional “similarity coefficient” by the number of coincidences themselves.
After clustering similar tracks, individual clusters turned out to be much more than the others. What is there? There are interesting situations in which it is not very clear what to consider them correctly. For example, everyone knows Happy Birthday to You. We have dozens of variations of this song, which differ only in the name of the person being congratulated. Consider them different or not? The same applies to versions of the track in different languages. These distortions and their combinations became a serious problem at the launch stage.
We had to pretty much refine the mechanism taking into account these and other not quite normal situations. Now the system is working properly, including on such complex clusters, and we continue to improve it, meeting with new extraordinary transformations. We are able to find songs under fictitious titles, sped up, with jingles and without vocals. The task was completed, and, undoubtedly, more than once will be useful in further work on the development of service recommendations, music search and audio section as a whole.
PS This is the first article in a series of stories we have long promised about the technical side of VKontakte.
In addition to Habr, we will publish them on our blog in Russian and English. It is also possible to ask the authors of articles not only here, but also in a separate VK community .
Source: https://habr.com/ru/post/330988/
All Articles