Interface design of corporate BI tool for data mining
It is impossible to control that which cannot be measured (ancient Roman wisdom)
The amount of information in the world is growing exponentially, while the human brain is not able to evolve at the same rate. Therefore, many large companies have already encountered the fact that the data and reports in multipage and multi-column tables need not only to be collected and stored, forwarded and unloaded, but also regularly analyzed and researched. But what to do if the giant multi-screen tables confuse and tire more than help to investigate and identify patterns? This means that the most advanced technologies and, naturally, design should come to the rescue.
')
Business intelligence (abbreviated as BI) is methods and tools for translating raw information into a meaningful, convenient form. This data is used for business analysis. BI technologies process large amounts of unstructured data to find strategic business opportunities.
Business analysis as an activity consists of several related processes:
The goal of BI is to interpret a large amount of data, focusing only on key performance factors, modeling the outcome of various options for action, and tracking the results of decision making.
And, by the ingenious definition of Hans Peter Luna, with whom I absolutely agree, “It’s not the facts themselves that are important, but the connections between them.”
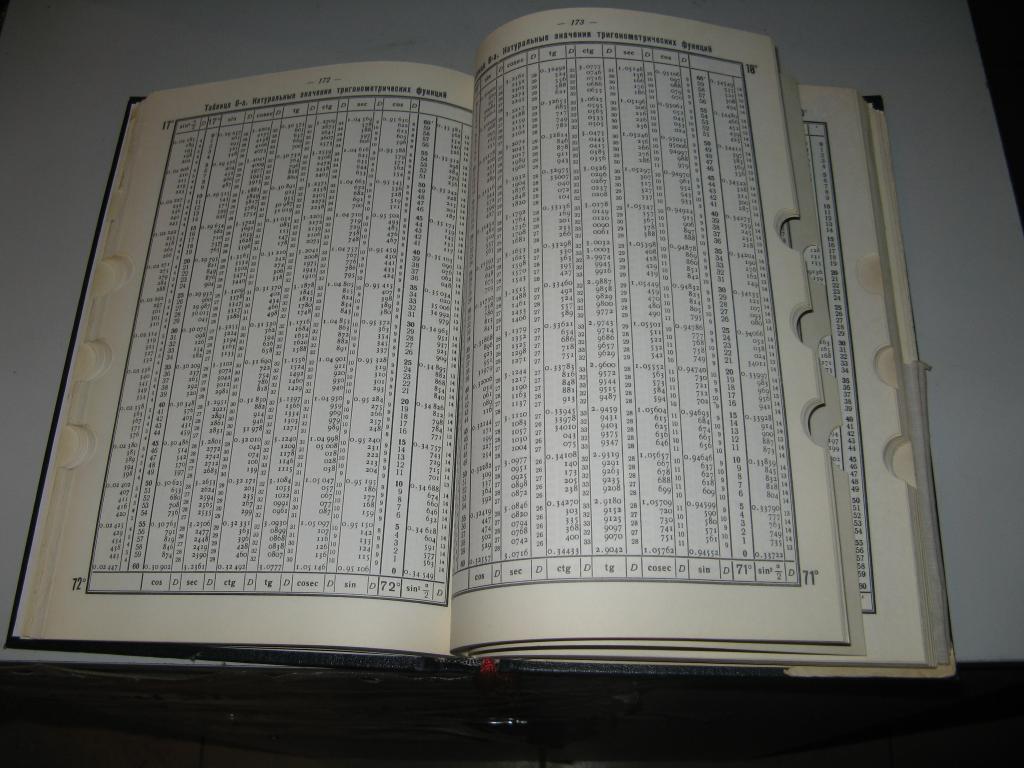
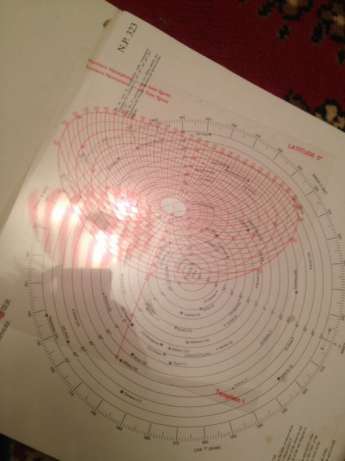
In fact, really big and complex data did not appear yesterday. Any textbook on ballistics and maritime navigation from three hundred years ago can also exactly enter into a complete stupor any modern unprepared man in the street.
The only thing is that earlier, the problem of high-quality visualization and the presentation of available data was not seriously puzzled by anyone, because knowledge as such was already a privilege for very small groups of people. Now it sounds strange, but for most of its history, humanity was convinced that any existing knowledge is needed by a very narrow and specialized group of people:

These categories of people who know, in turn, did not spare the time and effort to comprehend any amount of knowledge in any quantities, reasonably believing that this activity is a guarantee of their high social status and nutritious food. They did not need infographics and high-quality visualization, design of bar-charts and pie charts rotating in three-dimensional space, as they had enough time, effort and diligence to dedicate their entire lives for daily observation of everything small existing at that moment availability of data.
The concept that “knowledge is necessary for everyone and at once” is still relatively young and has not gained another 100% of supporters, even in the modern world, because even on the Internet today, the tendencies of restrictions, prohibitions, complications, and manipulations with unreliable information are growing.
Interestingly, it is the infographics that has reached its peak demand today - when huge data is already structured, processed, digested, cut off and served by the author in the right way, in order to reinforce its original idea as accurately as possible - with visual argumentation.
It is the speed of perception of the data “chewed up” for the user that determines today the overall efficiency, trainability and profitability of any employee in any company. Moreover, the need of modern society specifically for multi-experts, combining shallow knowledge at once in a multitude of related industries, adds the urgent need to place unfamiliar data in the right context at once, in order to feed any columns of numbers at the right angle, expanding the whole horizon of events to the user .
That is why most modern charts should synthesize several different indicators in one place at once: point indicator, accumulation, speed of its growth over time and possible projection to the future.
But at the same time, during the initial benchmarking, it quickly became clear that it is “Table - the queen of data”, because our typical user, looking at the highest-quality chart, instantly wants to clarify the data in the table. Moreover, it is also more familiar to him to customize sorting, filtering, set complex expressions to columns of numbers in a tabular version. Thank you for this decades of domination of the world picture from MS Excel.
The refinement of our future system for a specific data format of a particular enterprise allowed us to simplify the processing of data from the database and the quality of the generated OLAP cubes. Cubes could merge and allow editing of existing data. The information itself in cubes has already been clearly divided into Dimensions and Measures, and ready-made technologies have already identified empty or degenerate data sets in order to hide them by default from the user.
Having studied a huge number of analogs: MS Power BI, Dundas, Tableau, Qlik, it was found with interest that one of the easiest to learn and comfortable systems for work was developed by the domestic company Polimatika.
Even in their free demo access, the number of well-thought-out and at the same time simple solutions that their experts found was noticeable. it was their approach that was taken as a basis with the desire to improve and deepen all the freely available developments.

In my opinion, there are three ways to solve any problem in which the design of any modern system takes the second place as the complexity decreases.
Level 1 is a solution using algorithms and an interface completely invisible to a third-party observer.
Such a top-level system does not ask, does not wait for permission and setting-up from user information that is entangled in the web - and is itself able to offer it the necessary data, identify particularly interesting clusters, bursts, draw connections between completely independent (at first glance) data and give it to the end user ready advice, action plan, the path to the goal.
Ideally, this decision is not only because it minimally distracts the common man from the actual affairs with his requests to enter data, then select, select, click, drop; but also by the fact that it is able to independently find and handle the deep cause of a particular problem.
The best analogy of this approach is the preliminary prevention of diseases in a person from a young age, when medicine offers to harden and brush your teeth in advance, to strengthen your body and spirit, without waiting for the symptoms of a (possibly already neglected) disease to be identified.
At this level of solution, the visual design of the system is not needed by definition, at the same time, logic circuits, uml-diagrams, process decomposition, or just Mindmaps occupy more than one hundred pages in the Terms of Reference.
As your body is not important to the design of the bucket, with which you will pour cold water every morning - but it is extremely important for him to have a clear schedule of the morning schedule, a verified water temperature and a set of motivation for the daily performance of the wellness ritual for a clear movement to the goal.
It is very cool when a modern system is able to at least simulate such smart activities, assuming in advance which reports and data presentations will be most demanded by the user. This allows the screen to be loaded from a dashboard ready for visual perception, and not from a “clean slate”. The optimal method here is the initial distribution of all existing facts and information - according to the time dimension. So the user is immediately involved in the process and is interested to add new measurements for more in-depth research, to twist the obtained data or immediately go to the visualization.
This is exactly what Yandex.Metrica does, and the same idea of instant formation of dashboards on the basis of existing connections was also implemented by us:

At the second level , when the emergence of the problem was missed and its root causes are not very clear - and 99% of the existing tools for discovery, research and analytics are located. This is where the quality of graphic design and convenient presentation of data comes to the fore.
The analogue from medicine is a beautifully packaged tablet in a sweet glaze, taking which the patient hopes with maximum comfort to begin to deal with the most clearly discernible symptoms and consequences, such as elevated temperature. Although, in itself, high fever is not a disease, but an attempt by the body to independently and fully adequately respond and resist the appearance of a problem. It is on the same principle that the work of modern BI systems is organized, when, by the non typical manifestations of data on a dashboard, it can be concluded that the living organism of your business, as it can, resists a problem that has arisen from somewhere.
It is here that any measurable characteristics should be applied to the quality of the design of such dashboards, in addition to the standard subjective notions of beauty and visual taste.
It will be extremely important also:
The third and lowest level of quality in my understanding consists of constant prompts, alerts, notifications, multi-screen creation wizards and a lengthy onboarding process. Here again, the quality of the design does not play any role, for the user will mainly look at textual recommendations and arrows. Creating a similar redundantly complex interface for the system working with redundantly complex data is a failure idea a priori. Yes, and medical examples here are not entirely successful: constant conspiracies, slander and removal of port instead of complex treatment.
From the point of view of UX, hiding the data itself for even a few seconds under the menus, settings and modal windows is as bad as suddenly hiding the shopping cart with the order and the total cost just a second before the user makes a purchase in the online store. It is also impossible to imagine drop-down menus in the cockpit of a fighter jet or electric locomotive driver, but on the working screen of various such practices have become too intrusive.
In general, the problem of data breaking from the elements of their control is rather nontrivial and demanded from us several dozen attempts to solve it. The gap here means the need to manage data through a special interface panel located on the right / left or top / bottom of the table itself.
The most natural from the point of view of evolution from any person is the principle of “taking what I see”, when the columns of a chart or table lines are fully interactive and ready to respond to any desire of the user without waiting for the special control panel to be put out to the side. This was perhaps one of the most difficult principles to implement.
We came to understand that a person who grew up in an absolutely three-dimensional world would have to spend extra milliseconds to translate the abstraction of numbers into information colored with emotions and understanding, for example:
32,456 rubles are not just written here - this is a good result highlighted in color, this is correct, I am young;
here it’s not just that 34% is written - this is a reason to single out a number with a marker, organize a meeting, reprimand and make a long-planned shift in the manual.
Without these emotional stories generated by our consciousness, the numbers remain just strange Arabic squiggles informing about the measurement of certain indicators.
There were even attempts to add emotions to the one-dimensional world of numbers and the two-dimensional world of diagrams:
Here we fell for the authority of the world design expert Edward Taft, who constantly urges to put numerical data in context, complementing them with the necessary atmosphere and forming, in fact, an augmented reality. Unfortunately, the effort on the high-quality placement of multidimensional OLAP-cubes in the three-dimensional world would be just beyond the limits, and the useful effect is not so obvious.
In field studies of the process of working with big data, the necessity of creating a complete data management tool for mobile interfaces seemed very controversial.
Most likely, complex designers, highly loaded with settings, options and advanced features (see the cockpit) should be clearly separated from the place of the relaxed traveler to the country of Big Data in business class by the window.
Just as a consumer of a Hollywood blockbuster is not allowed into the director's chair, we concluded that the same user would require two different roles in the system:
Operator data on a PC with advanced designer functionality, forming the necessary cubes, summary tables, as well as summary dashboards, a viewer on a smartphone, passionate about the final narration and sincerely empathizing with the peripetias of the story that appears on the dashboard / storyboard.
Obviously, the importance and simplicity of the tabular presentation of data should not be underestimated. At the same time, their own modest studies have clearly shown that it is quite difficult for people to perceive tables from 4-5 columns of data. Moreover, an inner conviction was developed that the average person is able to adequately evaluate information (focus and link in a sequence of 3 or more inferences) only in the column according to which the data in the table (of arbitrarily large volume) were sorted.
At the same time, already complex double sorting within groups of the second level is perceived with problems, and sorting within the third level of nesting in the tables - after some time causes the simplest errors and confusion in the conclusions.
Thus, the paradox turns out when multidimensional OLAP-cubes of data with 5-7 sets of information on 10-20 dimensions ideally need to be adapted into whole heaps of simple tables with one or two measurements and a pair of sets of information degenerated into cards.
Too chaotic appearance of such a solution with a pile of hundreds of cards on the screen, despite the good technique of merging these simplest tables by dragging, overlaying and reverse breaking, did not allow to fully follow the path found by using our own observations.
The card interfaces themselves are certainly very good, as is the ability to send a single card from the table with the correct indicator to any messenger without unloading the entire dashboard (or even a cube), but in fact for the user, the presence of this particular feature will not be decisive factor when choosing a tool for data discovery.
Speaking frankly, the problem of choosing software for research within the company did not arise at all, so innovative interface ideas had to be strictly reduced to a minimum.
Even in spite of the trendiness and trend of such an operation as drag & drop, in practice and in truly complex systems, it has to be periodically abandoned. The thing is that dragging “eats” an unforgivably long time and effort from the user, forcing him instead of a typical click:
In my research, it turned out that the average drag & drop of a small data field into a table \ chart \ designer takes approximately two seconds of time. Sometimes this tedious operation took up half a minute, taking the user’s concentration, calories and time from further in-depth analysis of the data obtained.
The same is true for the dropdown submenus of the menu, in which in order to complete a pair of settings, it is often necessary to open the first level menu twice in order to go to the next submenu. Worst of all, when such settings menus are designed in such a way that they fall out over the data, for the sake of examining which, in fact, the whole process was started.
So, step by step, when designing an interface, we managed to identify several fundamental problems:
a) Big data is really big. They have many dimensions, facts, presentation possibilities, and up to 7 simultaneous settings that constantly create a visual overload for the analyst and not without a scroll enter neither horizontal lines nor vertical panels:
b) Constantly before your eyes you need to keep the directory of all data fields of the selected cube, which takes up a quarter of the entire screen;
c) Google material guides, adapted for managing social networks and contacts on a small smartphone, are absolutely not suitable for a complex b2b system;
d) The absence of a direct association between fact and action with it. The complexity of displaying the associated data by flipping visual “bridges” between them;
e) The absence of a pronounced conversion action, a clear final goal, the end of the study. Each data can be transformed continuously, the user can regularly return to one report and on its basis create all new variations and data slices;
f) Regular need for keyboard input of complex expressions, filters, categories for qualitative analysis of pre-formed tables;
g) The ability to set filters both to the entire report at once, and to each diagram separately, without allowing the user to become entangled in the complex intricacies of filtering;
h) an indispensable tool for highlighting any region within a table (lasso) with data being transferred to a separate visual entity (table or chart);
i) work in a single window without reloading pages and darkening them with modal windows.
Flight simulators of the past, similar in complexity to the interfaces of today's analytical programs, were using hot keys. Therefore, at some stage it seemed to be an interesting idea to transfer all the complexities of data management to the keyboard.
So, each data field could have only indicators of the current state, and all sorts, formulas, filters, or axis changes would be carried out using the S, F, Z, X, Y, Tab combinations with the Ctrl button, after selecting the desired fact / measurement with the mouse. Naturally, such an approach would require quite a long training and user adaptation (high input threshold), but it could significantly unload the visual part of the interface.
Likewise, at some point it seemed that replacing all the options with tags could significantly relieve the interface. But such an unloading was imaginary, making the screen easier - we greatly complicated the life of the operator of our data, forcing him to keep in his head the rules for writing a huge number of tags and short formulas:
Also, unfortunately, for reasons of marginal efficiency, it was not possible to push the solution to write completely its graphic library for styling graphic reports for the needs of the company. I had to take one of the existing ones and deprive myself of such beauty:
As you can see, a large number of concepts were tried, each of which had the right to exist, but did not fully satisfy all the key principles, and also did not solve all existing problems, and even gave rise to new ones.
At the current stage, it seems to me that the closest solution to the ideal is that conventionally called the “Notebook” concept:
It is emotional - it gives rise to pleasant memories from school, it contains a notebook pad, emphasizing as much as possible the importance of the Talitsa. It allows you to see the data always and overlaps only when you enter a new value in the string. It is absolutely anti-mobile in the form of a constructor, but it allows you to view dashboards generated in html using a link from a phone.
Each line here is interactive and allows you to start entering the names of Dimensions, Values, Filter directly in any specified place. A high-quality auto-prompt will prompt and speed up input.
There are no any drag and drop, and all settings are logically structured in the left navigation and control unit. The same screen on the PC is both the table designer and the final dashboard.
On the left, the data reference is always available, and the lasso (Ctrl + L) allows you to select any area from the table.
But the last problem here so far failed to solve - the data itself and their settings were extremely broken, and the person constantly has to look at the right side of the screen, making the settings on the left.
Actually, the purpose of this article is to call upon the help of highly respected colleagues who could voluntarily and sincerely help resolve the last dilemma and finally get to the first release.
The amount of information in the world is growing exponentially, while the human brain is not able to evolve at the same rate. Therefore, many large companies have already encountered the fact that the data and reports in multipage and multi-column tables need not only to be collected and stored, forwarded and unloaded, but also regularly analyzed and researched. But what to do if the giant multi-screen tables confuse and tire more than help to investigate and identify patterns? This means that the most advanced technologies and, naturally, design should come to the rescue.
')
What is BI
Business intelligence (abbreviated as BI) is methods and tools for translating raw information into a meaningful, convenient form. This data is used for business analysis. BI technologies process large amounts of unstructured data to find strategic business opportunities.
Business analysis as an activity consists of several related processes:
- data mining (data mining),
- real-time analytical processing (online analytical processing),
- getting information from databases (querying),
- reporting.
The goal of BI is to interpret a large amount of data, focusing only on key performance factors, modeling the outcome of various options for action, and tracking the results of decision making.
And, by the ingenious definition of Hans Peter Luna, with whom I absolutely agree, “It’s not the facts themselves that are important, but the connections between them.”
Why do you need it?
In fact, really big and complex data did not appear yesterday. Any textbook on ballistics and maritime navigation from three hundred years ago can also exactly enter into a complete stupor any modern unprepared man in the street.
The only thing is that earlier, the problem of high-quality visualization and the presentation of available data was not seriously puzzled by anyone, because knowledge as such was already a privilege for very small groups of people. Now it sounds strange, but for most of its history, humanity was convinced that any existing knowledge is needed by a very narrow and specialized group of people:
- Astronomy and medicine only for shamans (healers),
- The Bible is only in Latin for a handful of priests,
- a certificate - only for one clerk in the whole village,
- foreign language - for one whole country interpreter, etc ...
These categories of people who know, in turn, did not spare the time and effort to comprehend any amount of knowledge in any quantities, reasonably believing that this activity is a guarantee of their high social status and nutritious food. They did not need infographics and high-quality visualization, design of bar-charts and pie charts rotating in three-dimensional space, as they had enough time, effort and diligence to dedicate their entire lives for daily observation of everything small existing at that moment availability of data.
The concept that “knowledge is necessary for everyone and at once” is still relatively young and has not gained another 100% of supporters, even in the modern world, because even on the Internet today, the tendencies of restrictions, prohibitions, complications, and manipulations with unreliable information are growing.
Interestingly, it is the infographics that has reached its peak demand today - when huge data is already structured, processed, digested, cut off and served by the author in the right way, in order to reinforce its original idea as accurately as possible - with visual argumentation.
It is the speed of perception of the data “chewed up” for the user that determines today the overall efficiency, trainability and profitability of any employee in any company. Moreover, the need of modern society specifically for multi-experts, combining shallow knowledge at once in a multitude of related industries, adds the urgent need to place unfamiliar data in the right context at once, in order to feed any columns of numbers at the right angle, expanding the whole horizon of events to the user .
That is why most modern charts should synthesize several different indicators in one place at once: point indicator, accumulation, speed of its growth over time and possible projection to the future.
But at the same time, during the initial benchmarking, it quickly became clear that it is “Table - the queen of data”, because our typical user, looking at the highest-quality chart, instantly wants to clarify the data in the table. Moreover, it is also more familiar to him to customize sorting, filtering, set complex expressions to columns of numbers in a tabular version. Thank you for this decades of domination of the world picture from MS Excel.
What we have
The refinement of our future system for a specific data format of a particular enterprise allowed us to simplify the processing of data from the database and the quality of the generated OLAP cubes. Cubes could merge and allow editing of existing data. The information itself in cubes has already been clearly divided into Dimensions and Measures, and ready-made technologies have already identified empty or degenerate data sets in order to hide them by default from the user.
Having studied a huge number of analogs: MS Power BI, Dundas, Tableau, Qlik, it was found with interest that one of the easiest to learn and comfortable systems for work was developed by the domestic company Polimatika.
Even in their free demo access, the number of well-thought-out and at the same time simple solutions that their experts found was noticeable. it was their approach that was taken as a basis with the desire to improve and deepen all the freely available developments.
Three levels of design quality
In my opinion, there are three ways to solve any problem in which the design of any modern system takes the second place as the complexity decreases.
Level 1 is a solution using algorithms and an interface completely invisible to a third-party observer.
Such a top-level system does not ask, does not wait for permission and setting-up from user information that is entangled in the web - and is itself able to offer it the necessary data, identify particularly interesting clusters, bursts, draw connections between completely independent (at first glance) data and give it to the end user ready advice, action plan, the path to the goal.
Ideally, this decision is not only because it minimally distracts the common man from the actual affairs with his requests to enter data, then select, select, click, drop; but also by the fact that it is able to independently find and handle the deep cause of a particular problem.
The best analogy of this approach is the preliminary prevention of diseases in a person from a young age, when medicine offers to harden and brush your teeth in advance, to strengthen your body and spirit, without waiting for the symptoms of a (possibly already neglected) disease to be identified.
At this level of solution, the visual design of the system is not needed by definition, at the same time, logic circuits, uml-diagrams, process decomposition, or just Mindmaps occupy more than one hundred pages in the Terms of Reference.
As your body is not important to the design of the bucket, with which you will pour cold water every morning - but it is extremely important for him to have a clear schedule of the morning schedule, a verified water temperature and a set of motivation for the daily performance of the wellness ritual for a clear movement to the goal.
It is very cool when a modern system is able to at least simulate such smart activities, assuming in advance which reports and data presentations will be most demanded by the user. This allows the screen to be loaded from a dashboard ready for visual perception, and not from a “clean slate”. The optimal method here is the initial distribution of all existing facts and information - according to the time dimension. So the user is immediately involved in the process and is interested to add new measurements for more in-depth research, to twist the obtained data or immediately go to the visualization.
This is exactly what Yandex.Metrica does, and the same idea of instant formation of dashboards on the basis of existing connections was also implemented by us:
At the second level , when the emergence of the problem was missed and its root causes are not very clear - and 99% of the existing tools for discovery, research and analytics are located. This is where the quality of graphic design and convenient presentation of data comes to the fore.
The analogue from medicine is a beautifully packaged tablet in a sweet glaze, taking which the patient hopes with maximum comfort to begin to deal with the most clearly discernible symptoms and consequences, such as elevated temperature. Although, in itself, high fever is not a disease, but an attempt by the body to independently and fully adequately respond and resist the appearance of a problem. It is on the same principle that the work of modern BI systems is organized, when, by the non typical manifestations of data on a dashboard, it can be concluded that the living organism of your business, as it can, resists a problem that has arisen from somewhere.
It is here that any measurable characteristics should be applied to the quality of the design of such dashboards, in addition to the standard subjective notions of beauty and visual taste.
It will be extremely important also:
- the rate at which changes are made to the data sets
- convenience of preparing reports
- the number of actions to change the type of display or update data
- the ability to create your own templates, libraries, data sets.
The third and lowest level of quality in my understanding consists of constant prompts, alerts, notifications, multi-screen creation wizards and a lengthy onboarding process. Here again, the quality of the design does not play any role, for the user will mainly look at textual recommendations and arrows. Creating a similar redundantly complex interface for the system working with redundantly complex data is a failure idea a priori. Yes, and medical examples here are not entirely successful: constant conspiracies, slander and removal of port instead of complex treatment.
Creating the fundamental principles of the future system
1. Visibility - data is always visible
From the point of view of UX, hiding the data itself for even a few seconds under the menus, settings and modal windows is as bad as suddenly hiding the shopping cart with the order and the total cost just a second before the user makes a purchase in the online store. It is also impossible to imagine drop-down menus in the cockpit of a fighter jet or electric locomotive driver, but on the working screen of various such practices have become too intrusive.
2. Continuity (seamlessness) - I interact in the same place where I get the result
In general, the problem of data breaking from the elements of their control is rather nontrivial and demanded from us several dozen attempts to solve it. The gap here means the need to manage data through a special interface panel located on the right / left or top / bottom of the table itself.
The most natural from the point of view of evolution from any person is the principle of “taking what I see”, when the columns of a chart or table lines are fully interactive and ready to respond to any desire of the user without waiting for the special control panel to be put out to the side. This was perhaps one of the most difficult principles to implement.
3. Emotionality as the basis for quick perception.
We came to understand that a person who grew up in an absolutely three-dimensional world would have to spend extra milliseconds to translate the abstraction of numbers into information colored with emotions and understanding, for example:
32,456 rubles are not just written here - this is a good result highlighted in color, this is correct, I am young;
here it’s not just that 34% is written - this is a reason to single out a number with a marker, organize a meeting, reprimand and make a long-planned shift in the manual.
Without these emotional stories generated by our consciousness, the numbers remain just strange Arabic squiggles informing about the measurement of certain indicators.
There were even attempts to add emotions to the one-dimensional world of numbers and the two-dimensional world of diagrams:
- creating animated scrollable rollers,
- tools for adding photos, pictures and videos to reports,
- and even the ability to rotate any table on a three-dimensional panel online, at least upside down.
You look straight - you see the table, slightly tilted the working panel, when suddenly color columns or line diagrams grew from numbers, turning a set of tables into a visually beautiful dashboard.
Here we fell for the authority of the world design expert Edward Taft, who constantly urges to put numerical data in context, complementing them with the necessary atmosphere and forming, in fact, an augmented reality. Unfortunately, the effort on the high-quality placement of multidimensional OLAP-cubes in the three-dimensional world would be just beyond the limits, and the useful effect is not so obvious.
4. Anti-mobility
In field studies of the process of working with big data, the necessity of creating a complete data management tool for mobile interfaces seemed very controversial.
Most likely, complex designers, highly loaded with settings, options and advanced features (see the cockpit) should be clearly separated from the place of the relaxed traveler to the country of Big Data in business class by the window.
Just as a consumer of a Hollywood blockbuster is not allowed into the director's chair, we concluded that the same user would require two different roles in the system:
Operator data on a PC with advanced designer functionality, forming the necessary cubes, summary tables, as well as summary dashboards, a viewer on a smartphone, passionate about the final narration and sincerely empathizing with the peripetias of the story that appears on the dashboard / storyboard.
5. The key role of the table
Obviously, the importance and simplicity of the tabular presentation of data should not be underestimated. At the same time, their own modest studies have clearly shown that it is quite difficult for people to perceive tables from 4-5 columns of data. Moreover, an inner conviction was developed that the average person is able to adequately evaluate information (focus and link in a sequence of 3 or more inferences) only in the column according to which the data in the table (of arbitrarily large volume) were sorted.
At the same time, already complex double sorting within groups of the second level is perceived with problems, and sorting within the third level of nesting in the tables - after some time causes the simplest errors and confusion in the conclusions.
Thus, the paradox turns out when multidimensional OLAP-cubes of data with 5-7 sets of information on 10-20 dimensions ideally need to be adapted into whole heaps of simple tables with one or two measurements and a pair of sets of information degenerated into cards.
Too chaotic appearance of such a solution with a pile of hundreds of cards on the screen, despite the good technique of merging these simplest tables by dragging, overlaying and reverse breaking, did not allow to fully follow the path found by using our own observations.
The card interfaces themselves are certainly very good, as is the ability to send a single card from the table with the correct indicator to any messenger without unloading the entire dashboard (or even a cube), but in fact for the user, the presence of this particular feature will not be decisive factor when choosing a tool for data discovery.
Speaking frankly, the problem of choosing software for research within the company did not arise at all, so innovative interface ideas had to be strictly reduced to a minimum.
6. Down with drag and drop
Even in spite of the trendiness and trend of such an operation as drag & drop, in practice and in truly complex systems, it has to be periodically abandoned. The thing is that dragging “eats” an unforgivably long time and effort from the user, forcing him instead of a typical click:
- grab,
- to drag
- aim,
- let off,
- spit,
- again, take and drag more precisely.
In my research, it turned out that the average drag & drop of a small data field into a table \ chart \ designer takes approximately two seconds of time. Sometimes this tedious operation took up half a minute, taking the user’s concentration, calories and time from further in-depth analysis of the data obtained.
The same is true for the dropdown submenus of the menu, in which in order to complete a pair of settings, it is often necessary to open the first level menu twice in order to go to the next submenu. Worst of all, when such settings menus are designed in such a way that they fall out over the data, for the sake of examining which, in fact, the whole process was started.
Main problems
So, step by step, when designing an interface, we managed to identify several fundamental problems:
a) Big data is really big. They have many dimensions, facts, presentation possibilities, and up to 7 simultaneous settings that constantly create a visual overload for the analyst and not without a scroll enter neither horizontal lines nor vertical panels:
b) Constantly before your eyes you need to keep the directory of all data fields of the selected cube, which takes up a quarter of the entire screen;
c) Google material guides, adapted for managing social networks and contacts on a small smartphone, are absolutely not suitable for a complex b2b system;
d) The absence of a direct association between fact and action with it. The complexity of displaying the associated data by flipping visual “bridges” between them;
e) The absence of a pronounced conversion action, a clear final goal, the end of the study. Each data can be transformed continuously, the user can regularly return to one report and on its basis create all new variations and data slices;
f) Regular need for keyboard input of complex expressions, filters, categories for qualitative analysis of pre-formed tables;
g) The ability to set filters both to the entire report at once, and to each diagram separately, without allowing the user to become entangled in the complex intricacies of filtering;
h) an indispensable tool for highlighting any region within a table (lasso) with data being transferred to a separate visual entity (table or chart);
i) work in a single window without reloading pages and darkening them with modal windows.
Are hot keys obsolete?
Flight simulators of the past, similar in complexity to the interfaces of today's analytical programs, were using hot keys. Therefore, at some stage it seemed to be an interesting idea to transfer all the complexities of data management to the keyboard.
So, each data field could have only indicators of the current state, and all sorts, formulas, filters, or axis changes would be carried out using the S, F, Z, X, Y, Tab combinations with the Ctrl button, after selecting the desired fact / measurement with the mouse. Naturally, such an approach would require quite a long training and user adaptation (high input threshold), but it could significantly unload the visual part of the interface.
Likewise, at some point it seemed that replacing all the options with tags could significantly relieve the interface. But such an unloading was imaginary, making the screen easier - we greatly complicated the life of the operator of our data, forcing him to keep in his head the rules for writing a huge number of tags and short formulas:
Also, unfortunately, for reasons of marginal efficiency, it was not possible to push the solution to write completely its graphic library for styling graphic reports for the needs of the company. I had to take one of the existing ones and deprive myself of such beauty:
The results of all the torment
As you can see, a large number of concepts were tried, each of which had the right to exist, but did not fully satisfy all the key principles, and also did not solve all existing problems, and even gave rise to new ones.
At the current stage, it seems to me that the closest solution to the ideal is that conventionally called the “Notebook” concept:
It is emotional - it gives rise to pleasant memories from school, it contains a notebook pad, emphasizing as much as possible the importance of the Talitsa. It allows you to see the data always and overlaps only when you enter a new value in the string. It is absolutely anti-mobile in the form of a constructor, but it allows you to view dashboards generated in html using a link from a phone.
Each line here is interactive and allows you to start entering the names of Dimensions, Values, Filter directly in any specified place. A high-quality auto-prompt will prompt and speed up input.
There are no any drag and drop, and all settings are logically structured in the left navigation and control unit. The same screen on the PC is both the table designer and the final dashboard.
On the left, the data reference is always available, and the lasso (Ctrl + L) allows you to select any area from the table.
But the last problem here so far failed to solve - the data itself and their settings were extremely broken, and the person constantly has to look at the right side of the screen, making the settings on the left.
Actually, the purpose of this article is to call upon the help of highly respected colleagues who could voluntarily and sincerely help resolve the last dilemma and finally get to the first release.
Source: https://habr.com/ru/post/330958/
All Articles