Monitoring Nginx Plus in Zabbix
Nginx Plus includes advanced monitoring and diagnostic tools. I want to tell you how to integrate them with Zabbix.
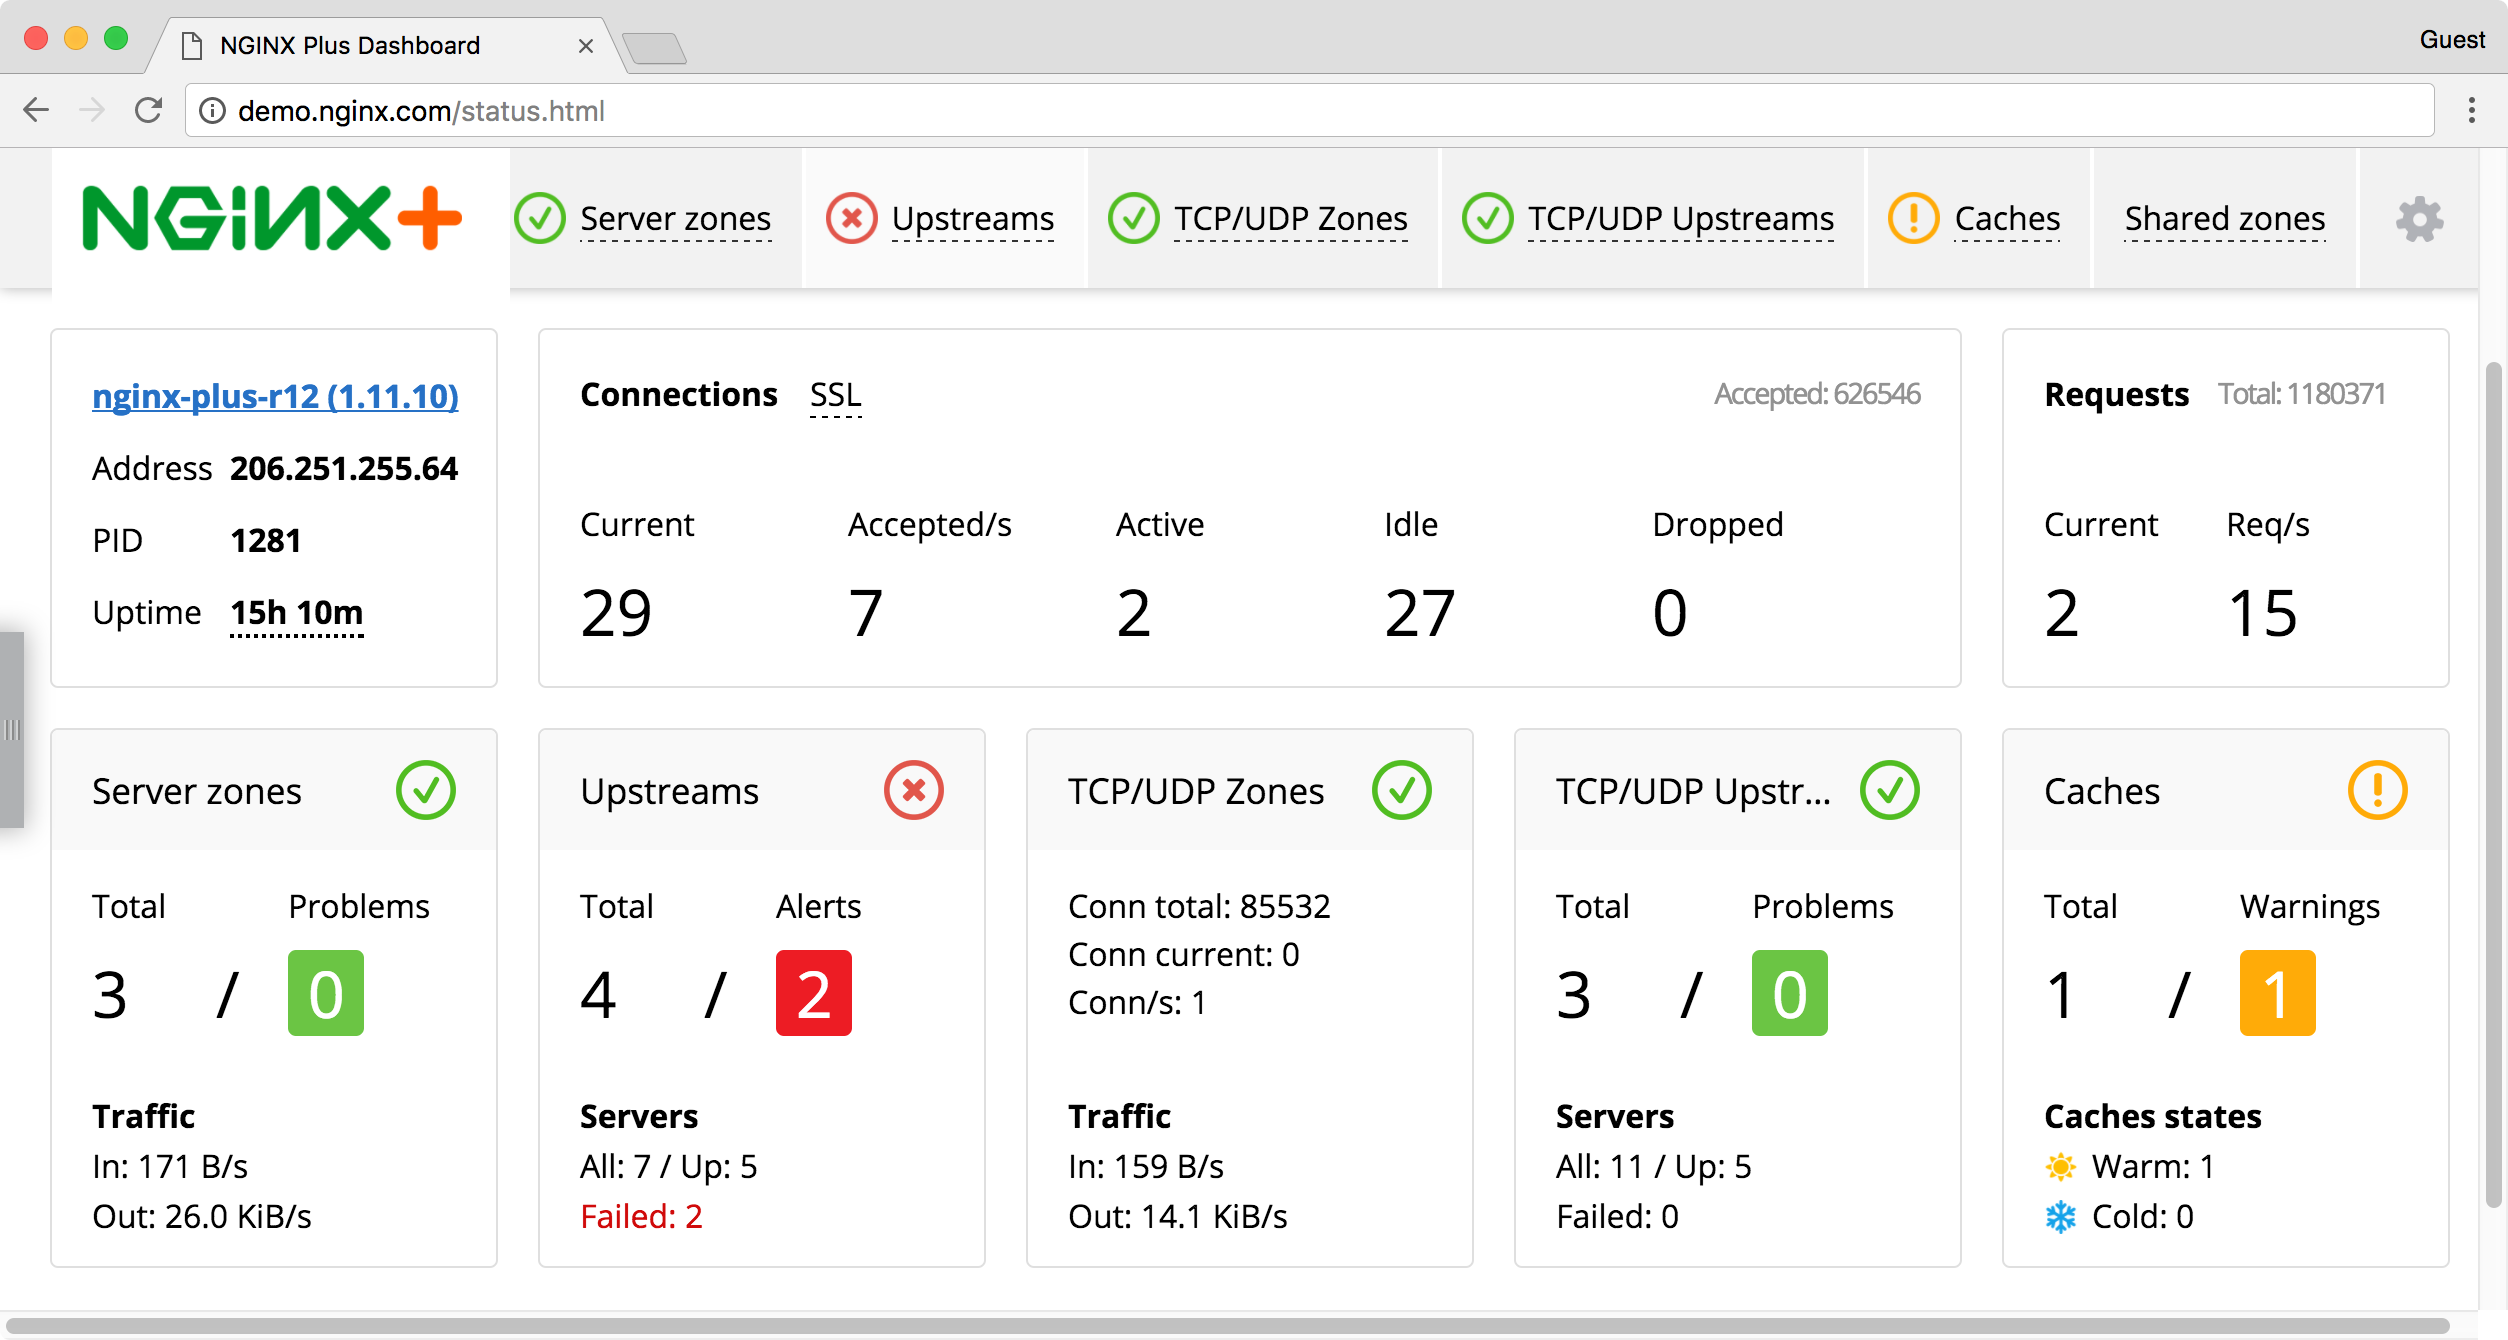
As you can see in the illustration, Nginx Plus has a good dashboard that displays its status . This is great, but if Zabbix is already in use, I would like to track this data in it. Fortunately, Nginx Plus allows you to get the current status as a JSON file .
Information produced by this json file is divided into two types:
')
1. concerning the server as a whole
2. concerning upstreams
If the status of the server as a whole does not raise issues, then it is somewhat more difficult with upstream.
Since the number of upstream and their peers is not known in advance, it makes sense to determine them dynamically using low-level zabbiks queries (LLD) .
to parse json from nginx, use a python script:
To find out how many upstream and peers the server has, use the autodiscovery script:
For monitoring to work, you need to do the following:


This completes the monitoring setup for Nginx Plus. The files used in this article are available in the repository on GitHub .
If you have questions, want to add something, or something did not work for you, write me about it (in the comments, in Issues, or by personal message).
Thanks for attention!
As you can see in the illustration, Nginx Plus has a good dashboard that displays its status . This is great, but if Zabbix is already in use, I would like to track this data in it. Fortunately, Nginx Plus allows you to get the current status as a JSON file .
Information produced by this json file is divided into two types:
')
1. concerning the server as a whole
2. concerning upstreams
If the status of the server as a whole does not raise issues, then it is somewhat more difficult with upstream.
Since the number of upstream and their peers is not known in advance, it makes sense to determine them dynamically using low-level zabbiks queries (LLD) .
to parse json from nginx, use a python script:
nginx-stats.py
#! /usr/bin/python2 # -*- coding: utf-8 -*- # script awaits command line args for input # json keys from nginx status use as args # examples: # nginx-stats.py requests current (get current requests count) # nginx-stats.py upstreams hg-backend peers 10.0.0.1 requests (get count requests to peer 10.0.0.1, for upstream hg-backend) # into Zabbix templates it looks like: # 1) all active connections [connections,active] # 2) all current requests [requests,current] # Upstreams: # 4) active connections [upstreams,{#UPSTREAM},peers,{#NODE_IP},active] # 5) status [upstreams,{#UPSTREAM},peers,{#NODE_IP},state] # 7) requests per second [upstreams,{#UPSTREAM},peers,{#NODE_IP},requests] # 8) responses for every HTTP-code per second [upstreams,{#UPSTREAM},peers,{#NODE_IP},responses,Xxx] # 9) summ active connections [upstreams,{#UPSTREAM},active] # 10) summ requests per second [upstreams,{#UPSTREAM},requests] # 11) summ responses for every HTTP-code per second [upstreams,{#UPSTREAM},responses,Xxx] import json, sys, os, urllib # parse json from nginx to doct data url="http://demo.nginx.com/status" directory="/tmp/nginx-stats/" response = urllib.urlopen(url) data = json.loads(response.read()) maxTime = float(3600) # in seconds avgTime = float(60) # average during, in seconds def printInt(float): print(int(round(float))) if not os.path.exists(directory): os.makedirs(directory) tmpfile = directory + str(sys.argv[1]) for i in range(2, len(sys.argv)): tmpfile = tmpfile + "." + str(sys.argv[i]) # test for file with data from previous run # if not - create it with current data and exit # if yes - read it to timestampDelta for count req/s and res/s try: json.loads(open(tmpfile).read()) except IOError as e: with open(tmpfile, 'w') as delta_file: json.dump(data, delta_file) sys.exit() except ValueError as e: with open(tmpfile, 'w') as delta_file: json.dump(data, delta_file) sys.exit() else: with open(tmpfile) as data_file: data_delta = json.load(data_file) timestampDelta = data_delta["timestamp"] # check load_timestamp with data from previous run # if it have another value, create temp file # with current data and exit. if int(data['load_timestamp']) <> int(data_delta['load_timestamp']): with open(tmpfile, 'w') as delta_file: json.dump(data, delta_file) sys.exit() # check timestamp file with data from previous run # if it older then maxTime (1 hour by default) # create it with current data and exit. if int(data['timestamp']) - int(timestampDelta) > (maxTime * 1000) : with open(tmpfile, 'w') as delta_file: json.dump(data, delta_file) sys.exit() delta = (data['timestamp'] - timestampDelta) / (avgTime * 1000) if ((str(sys.argv[1])) == "connections") or ((str(sys.argv[1])) == "requests"): print data[str(sys.argv[1])][str(sys.argv[2])] # print all active connections or all current connections elif (str(sys.argv[1])) == "upstreams": ip_data = dict([[v['server'],v] for v in data['upstreams'][str(sys.argv[2])]['peers']]) ip_data_delta = dict([[v['server'],v] for v in data_delta['upstreams'][str(sys.argv[2])]['peers']]) if ((str(sys.argv[3])) == "active") or ((str(sys.argv[3])) == "requests") or ((str(sys.argv[3])) == "responses"): summ_active = summ_requests = summ_responses_1xx = summ_responses_2xx = summ_responses_3xx = summ_responses_4xx = summ_responses_5xx = 0 for i in ip_data.keys(): summ_active = summ_active + ip_data[i]['active'] summ_requests = summ_requests + (ip_data[i]['requests'] - ip_data_delta[i]['requests']) / delta summ_responses_1xx = summ_responses_1xx + (ip_data[i]['responses']['1xx'] - ip_data_delta[i]['responses']['1xx']) / delta summ_responses_2xx = summ_responses_2xx + (ip_data[i]['responses']['2xx'] - ip_data_delta[i]['responses']['2xx']) / delta summ_responses_3xx = summ_responses_3xx + (ip_data[i]['responses']['3xx'] - ip_data_delta[i]['responses']['3xx']) / delta summ_responses_4xx = summ_responses_4xx + (ip_data[i]['responses']['4xx'] - ip_data_delta[i]['responses']['4xx']) / delta summ_responses_5xx = summ_responses_5xx + (ip_data[i]['responses']['5xx'] - ip_data_delta[i]['responses']['5xx']) / delta if (str(sys.argv[3])) == "active": print summ_active elif (str(sys.argv[3])) == "requests": printInt (summ_requests) elif (str(sys.argv[3])) == "responses": if (str(sys.argv[4])) == "1xx": printInt (summ_responses_1xx) elif (str(sys.argv[4])) == "2xx": printInt (summ_responses_2xx) elif (str(sys.argv[4])) == "3xx": printInt (summ_responses_3xx) elif (str(sys.argv[4])) == "4xx": printInt (summ_responses_4xx) elif (str(sys.argv[4])) == "5xx": printInt (summ_responses_5xx) else: sys.exit() else: sys.exit() elif ((str(sys.argv[5])) == "active") or ((str(sys.argv[5])) == "state"): print ip_data[str(sys.argv[4])][str(sys.argv[5])] # print peer's active connections or peer's state elif (str(sys.argv[5])) == "requests": printInt ((ip_data[str(sys.argv[4])]['requests'] - ip_data_delta[str(sys.argv[4])]['requests']) / delta) elif (str(sys.argv[5])) == "responses": if (str(sys.argv[6])) == "1xx": printInt ((ip_data[str(sys.argv[4])]['responses']['1xx'] - ip_data_delta[str(sys.argv[4])]['responses']['1xx']) / delta) elif (str(sys.argv[6])) == "2xx": printInt ((ip_data[str(sys.argv[4])]['responses']['2xx'] - ip_data_delta[str(sys.argv[4])]['responses']['2xx']) / delta) elif (str(sys.argv[6])) == "3xx": printInt ((ip_data[str(sys.argv[4])]['responses']['3xx'] - ip_data_delta[str(sys.argv[4])]['responses']['3xx']) / delta) elif (str(sys.argv[6])) == "4xx": printInt ((ip_data[str(sys.argv[4])]['responses']['4xx'] - ip_data_delta[str(sys.argv[4])]['responses']['4xx']) / delta) elif (str(sys.argv[6])) == "5xx": printInt ((ip_data[str(sys.argv[4])]['responses']['5xx'] - ip_data_delta[str(sys.argv[4])]['responses']['5xx']) / delta) else: sys.exit() else: sys.exit() else: sys.exit() with open(tmpfile, 'w') as delta_file: json.dump(data, delta_file) To find out how many upstream and peers the server has, use the autodiscovery script:
nginx-discovery.py
#! /usr/bin/python2 # -*- coding: utf-8 -*- # parse json from nginx again # we need to make /another/ json for zabbix # warning: this script not send any values to Zabbiz, only upstreams and peers names. # this script doing just one thing - make json for zabbix with right format # unfortunately, json.dumps gives a slightly different format import json, re, urllib # parse json from nginx to dict data url="http://demo.nginx.com/status" response = urllib.urlopen(url) data = json.loads(response.read()) # forming json for LLD zabbix where {#UPSTREAM} - upstream's name # {#NODE_IP} - peer's IP address result="{\n\"data\":[\n" for i in sorted(data['upstreams'].keys()): ip_data = dict([[v['server'],v] for v in data['upstreams'][i]['peers']]) for j in sorted(ip_data.keys()): result = result + "{\n" result = result + "\"{#UPSTREAM}\":\""+str(i)+"\",\n" result = result + "\"{#NODE_IP}\":\""+str(j)+"\"\n" result = result + "},\n" result = re.sub("},\n$", "", result) + "}]\n}\n" print result For monitoring to work, you need to do the following:
- place scripts in / etc / zabbix / scripts /
- add UserParameter to zabbix-agent
echo 'UserParameter=nginx.stat.[*],/etc/zabbix/scripts/nginx-stats.py $1 $2 $3 $4 $5 $6' > /etc/zabbix/zabbix_agentd.d/userparameter_nginx_plus.conf echo 'UserParameter=nginx.discovery,/etc/zabbix/scripts/nginx-discovery.py' >> /etc/zabbix/zabbix_agentd.d/userparameter_nginx_plus.conf - restart zabbix-agent
- import zabbix template
- Attach the Template App Nginx Plus template to the host
- check for fresh data
This completes the monitoring setup for Nginx Plus. The files used in this article are available in the repository on GitHub .
If you have questions, want to add something, or something did not work for you, write me about it (in the comments, in Issues, or by personal message).
Thanks for attention!
Source: https://habr.com/ru/post/330956/
All Articles