Save data and faith in humanity: large migration of ElasticSearch cluster

In this article, I continue to share my field experience with a logging system based on Heka and ElasticSearch.
This time the story goes about data migration between two clusters of ElasticSearch 2.2 and 5.2.2 , which cost me a lot of nerves. After all, 24 billion records were to be transported without breaking the already running system.
The last article ended on the fact that the system is working, the logs are received and added to the ElasticSearch cluster, their viewing is available in real time through Kibana. But the cluster was originally assembled with a significant margin from memory just for growth.
If you refer to the official documentation of ElasticSearch (hereinafter referred to simply as ES), then first of all you will see the strict warning “Don't cross 32 gb”. The excess threatens to slump performance up to moments of complete standstill while the garbage collector performs a rebuild in the spirit of "stop the world". The manufacturer's recommendation for memory on the server: 32 GB under heap (xms / xmx) and another 32 GB of free space under the cache. Total 64 GB of physical memory per data-node.
But what if there is more memory? The official answer is all in the same documentation - put multiple copies of ES on the same host. But such an approach seemed to me to be not quite correct, since there are no standard means for this. Duplicate init scripts is the last century, so cluster virtualization with the placement of nodes in LXD containers seemed more interesting.
LXD (Linux Container Daemon) is the so-called “container legcaster”. Unlike the "heavy" hypervisors, it does not contain hardware emulation, which allows to reduce the overhead of virtualization. In addition, it has an advanced REST API, flexible configuration of the resources used, the ability to transfer containers between hosts, and other features more typical of classic virtualization systems.

This is the structure of the future cluster.
By the beginning of the work at hand was the following iron:
Four working ES data nodes in the old cluster: Intel Xeon 2x E5-2640 v3; 512 GB of RAM, 3x16TB of RAID-10.
- Two new empty servers similar to the previous item configuration.
As planned, each physical server will have two ES data nodes, a master node and a client node. In addition, the server will house the log container with HAProxy and Heka pool installed to service the data nodes of this physical server.
Preparing a new cluster
First of all, you need to release one of the data-nodes - this server immediately goes to a new cluster. The load on the remaining three will increase by 30%, but they will cope, which is confirmed by the download statistics for the last month. Moreover, this is not for long. Next, I give my sequence of actions for the regular output of the data node from the cluster.
We remove the load from the fourth data node by prohibiting the placement of new indexes on it:
{ "transient": { "cluster.routing.allocation.exclude._host": "log-data4" } } Now we turn off the automatic rebalancing of the cluster during the migration in order not to create an extra load on the remaining data nodes:
{ "transient": { "cluster.routing.rebalance.enable": "none" } } We compile a list of indices from the released data node, divide it into three equal parts and start moving shards to the remaining data nodes as follows (for each index and shard):
PUT _cluster/reroute { "commands" : [ { "move" : { "index" : "service-log-2017.04.25", "shard" : 0, "from_node" : "log-data4", "to_node" : "log-data1" } } } When the transfer is completed, turn off the vacated node and do not forget to return the rebalancing back:
{ "transient": { "cluster.routing.rebalance.enable": "all" } } If the network and the load on the cluster allow, then to speed up the process, you can increase the queue of simultaneously moving shards (by default, this number is equal to two)
{ "transient": { "cluster": { "routing": { "allocation": { "cluster_concurrent_rebalance": "10" } } } } } While the old cluster gradually comes to life, we collect on the three existing servers a new one based on ElasticSearch 5.2.2, with separate LXD containers for each node. The point is simple and well described in the documentation, so I omit the details. If anything - ask in the comments, I will tell in detail.
During the setup of the new cluster, I allocated the memory as follows:
Master nodes: 4 GB
Client nodes: 8 GB
Data nodes: 32 GB
- XMS everywhere is set to XMX.
This distribution was born after thinking about the documentation, viewing the statistics of the old cluster and applying common sense.
Sync clusters
So, we have two clusters:
Old - three data nodes, each on an iron server.
- New, with six data nodes in LXD containers, two per server.
The first thing we do is enable traffic mirroring in both clusters. At the Heka receiving pools (refer to the previous article in the cycle for a detailed description), we add another Output section for each processed service:
[Service1Output_Mirror] type = "ElasticSearchOutput" message_matcher = "Logger == 'money-service1''" server = "http://newcluster.receiver:9200" encoder = "Service1Encoder" use_buffering = true After that, traffic will go in parallel to both clusters. Considering that we store indexes with operational logs of components for no more than 21 days, we could stop at that. After 21 days in the clusters will be the same data, and the old can be disabled and parsed. But so long and so boring to wait. Therefore, we proceed to the last and most interesting stage - the migration of data between clusters.
Transfer indexes between clusters
Since there is no official procedure for migrating data between ES clusters at the time of the project, and I don’t want to reinvent crutches - we use Logstash. Unlike Heka, he can not only write data to ES, but also read it from there.
Judging by the comments on the previous article , many have formed the opinion that for some reason I do not like Logstash. But after all, each tool is designed for its own tasks, and Logstash is the best fit for migration between clusters.
During the migration, it is useful to increase the size of the memory buffer for the indices from 10% by default to 40%, which are selected by the average amount of free memory on the working ES data-nodes. You also need to turn off the update of the indexes on each data node, for which we add the following parameters to the date-node configuration:
memory.index_buffer_size: 40% index.refresh_interval: -1 By default, the index is updated every second and thus creates an extra load. Therefore, while none of the users is watching the new cluster, the update can be disabled. At the same time, I created a default template for the new cluster, which will be used when generating new indexes:
{ "default": { "order": 0, "template": "*", "settings": { "index": { "number_of_shards": "6", "number_of_replicas": "0" } } } } Using the template, we turn off replication for the duration of the migration, thereby reducing the load on the disk system.
For Logstash we have the following configuration:
input { elasticsearch { hosts => [ "localhost:9200" ] index => "index_name" size => 5000 docinfo => true query => '{ "query": { "match_all": {} }, "sort": [ "@timestamp" ] }'} } output { elasticsearch { hosts => [ "log-new-data1:9200" ] index => "%{[@metadata][_index]}" document_type => "%{[@metadata][_type]}" document_id => "%{[@metadata][_id]}"}} } In the input section, we describe the source of the data, indicate to the system that the data needs to be taken in batches (bulk) of 5000 records, and select all records sorted by timestamp.
In output, you must specify the destination for transferring the received data. Pay attention to the descriptions of the following fields, which can be obtained from the old indexes:
document_type - the type (mapping) of the document, which is better to indicate when moving, so that the names of the created mappings in the new cluster coincide with the names in the old one - they are used in saved queries and dashboards.
- document_id - internal identifier of the entry in the index, which is a unique 20-character hash. With its explicit transfer, two tasks are solved: firstly, we ease the load on the new cluster without requiring to generate an id for each of the billions of records, and secondly, if the process is interrupted, there is no need to delete the under-downloaded index, you can simply start the process again, and ES ignores entries with a matching id.
Logstash startup options:
/usr/share/logstash/bin/logstash -f /etc/logstash/conf.d/migrate.conf --pipeline.workers 8 The key parameters affecting the speed of migration are the size of the packs that Logstash will send to ES, and the number of simultaneously running processes (pipeline.workers) for processing. There are no strict rules that would determine the choice of these values - they were selected experimentally by the following method:
We choose a small index: for tests we used an index with 1 million multi-line (this is important) records.
We start migration of this index by means of Logstash.
We look at the thread_pool on the receiving data node, paying attention to the number of "rejected" records. The growth of this value clearly indicates that ES does not have time to index incoming data - then the number of parallel processes Logstash should be reduced.
- If a sharp increase in “rejected” records does not occur, we increase the number of bulk / workers and repeat the process.
After everything was prepared, lists of indexes for relocation were compiled, configurations were written, and warnings were sent about upcoming loads to the network infrastructure and monitoring departments, I started the process.
In order not to sit and not restart the logstash process, after completing the migration of the next index, I did the following with the new configuration file:
The list of indexes for the move was divided into three approximately equal parts.
In /etc/logstash/conf.d/migrate.conf left only the static part of the configuration:
input { elasticsearch { hosts => [ "localhost:9200" ] size => 5000 docinfo => true query => '{ "query": { "match_all": {} }, "sort": [ "@timestamp" ] }'} } output { elasticsearch { hosts => [ "log-new-data1:9200" ] index => "%{[@metadata][_index]}" document_type => "%{[@metadata][_type]}" document_id => "%{[@metadata][_id]}"}} }I compiled a script that reads the names of the indexes from the file and invokes the logstash process, dynamically substituting the index name and node address for migration.
- All you need to run three instances of the script, one for each file: indices.to.move.0.txt , indices.to.move.1.txt and indices.to.move.2.txt . After that, the data goes to the first, third and fifth data nodes.
The code for one of the script instances:
cat /tmp/indices_to_move.0.txt | while read line do echo $line > /tmp/0.txt && /usr/share/logstash/bin/logstash -f /etc/logstash/conf.d/migrate.conf --pipeline.workers 8 --config.string "input {elasticsearch { index => \"$line\" }} output { elasticsearch { hosts => [ \"log-new-data1:9200\" ] }}" done; To view the migration status, I had to assemble another script “on my lap” and run the screen in a separate process (via watch -d -n 60) :
#!/bin/bash regex=$(cat /tmp/?.txt) regex="(($regex))" regex=$(echo $regex | sed 's/ /)|(/g') curl -s localhost:9200/_cat/indices?h=index,docs.count,docs.deleted,store.size | grep -P $regex |sort > /tmp/indices.local curl -s log-new-data1:9200/_cat/indices?h=index,docs.count,docs.deleted,store.size | grep -P$regex | sort > /tmp/indices.remote echo -e "index\t\t\tcount.source\tcount.dest\tremaining\tdeleted\tsource.gb\tdest.gb" diff --side-by-side --suppress-common-lines /tmp/indices.local /tmp/indices.remote | awk '{print $1"\t"$2"\t"$7"\t"$2-$7"\t"$8"\t"$4"\t\t"$9}' The migration process took about a week. And to be honest, I slept this week restlessly.
After moving
After the transfer of the indexes, it remains to do quite a bit. One fine Saturday night, the old cluster was turned off and the DNS records were changed. Therefore, all those who came to work on Monday saw the new pink-blue interface of the fifth Kibana. While the staff got used to the updated color scheme and studied the new features, I continued to work.
From the old cluster I took another server that had become vacant and put two containers on it with ES data nodes for the new cluster. All the rest of the iron went to the reserve.
The final structure turned out exactly what was planned on the first scheme:
Three master nodes.
Three client nodes.
Eight data nodes (two per server).
- Four log-receiver (HAProxy + Heka Pools, one for each server).
We transfer the cluster to production mode - we return the buffer parameters and the index update intervals:
memory.index_buffer_size: 10% index.refresh_interval: 1s The cluster quorum (taking into account three master nodes) is set to two:
discovery.zen.minimum_master_nodes: 2 Next, we need to return the shard values, taking into account that we already have eight date-nodes:
{ "default": { "order": 0, "template": "*", "settings": { "index": { "number_of_shards": "8", "number_of_replicas": "1" } } } } Finally, we select the right moment (all employees went home) and restart the cluster.
Nashardit, but do not mix
In this section, I want to focus on reducing the overall reliability of the system, which occurs when placing multiple ES data-nodes in the same iron server, and indeed with any virtualization.
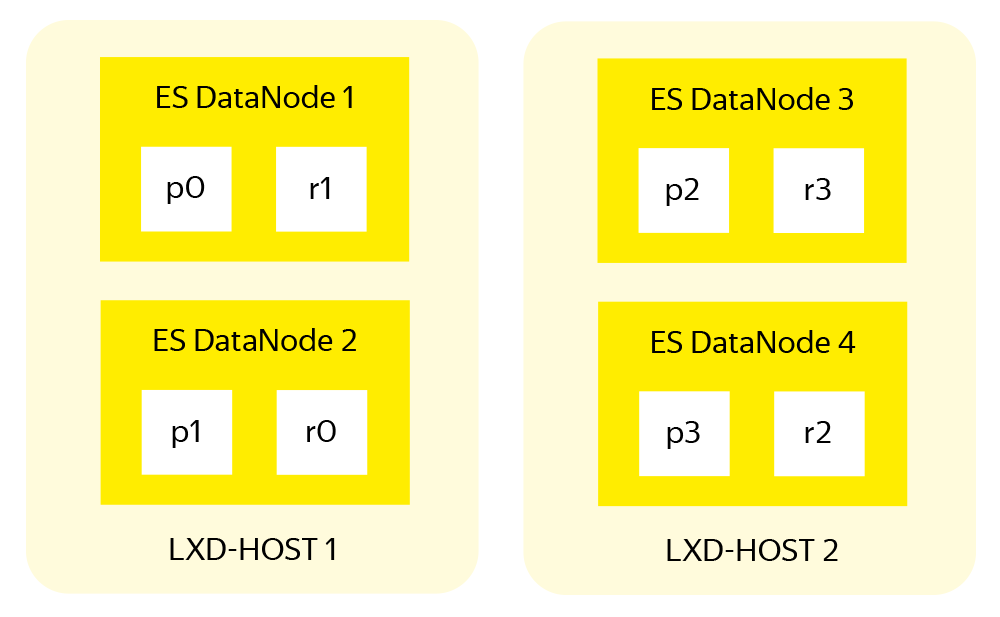
From the point of view of the ES cluster, everything is fine: the index is divided into shards by the number of data nodes, each shard has a replica, the primary and replica shards are stored on different nodes.
The sharding and replication system in ES increases both the speed and reliability of data storage. But this system was designed taking into account the placement of one ES node on one server, when in case of problems with equipment only one ES data node is lost. In the case of our cluster, two will fall . Even taking into account the equal division of indices between all nodes and the presence of a replica for each shard, there is a situation when primary and replica of the same shard appear on two adjacent data nodes of the same physical server.
Therefore, ES developers have proposed a tool to control the placement of the shard within a single cluster - Shard Allocation Awareness (SAA). This tool allows when placing a shard to operate not with data nodes, but with more global structures like servers with LXD containers.
In the settings of each data node, you need to place the ES attribute that describes the physical server on which it is located:
node.attr.rack_id: log-lxd-host-N Now you need to reload the nodes to apply the new attributes, and add the following code to the cluster configuration:
{ "persistent": { "cluster": { "routing": { "allocation": { "awareness": { "attributes": "rack_id" } } } } } } And only in this order, because after enabling SAA, the cluster will not place shards on nodes without the specified attribute.
By the way, a similar mechanism can be used for several attributes. For example, if the cluster is located in several data centers and you do not want to move the shards back and forth between them. In this case, the already familiar settings will look like this:
node.attr.rack_id: log-lxd-hostN node.attr.dc_id: datacenter_name { "persistent": { "cluster": { "routing": { "allocation": { "awareness": { "attributes": "rack_id, dc_id" } } } } } } It would seem that everything in this section is obvious. But it is the obvious that takes off from the head first of all, so check it out separately - then after the move it will not be excruciatingly painful.
The next article in the series will be devoted to two of my favorite topics — monitoring and tuning an already built system. Be sure to write in the comments if something from the already written or planned is particularly interesting and raises questions .
')
Source: https://habr.com/ru/post/330952/
All Articles