GIS and distributed computing
Hello! I will again talk about geo-information technologies. With this article I begin a series on technologies at the intersection of the worlds of classic GIS and the still fashionable direction of BigData. I will talk about the key features of the application of distributed computing to work with geodata, and also make a brief overview of existing tools.
Today we are surrounded by a huge amount of unstructured data, which until recently was unthinkable to process. An example of such data may be, for example, weather sensor data used for accurate weather forecasting. More structured, but no less massive datasets are, for example, satellite images (a number of articles from the OpenDataScience community are even devoted to image processing algorithms using machine learning). A set of high-resolution images, say, for the whole of Russia, takes several petabytes of data. Or the revision history of OpenStreetMap is a terabyte of xml. Or laser scan data. Finally, data from a huge number of sensors, which are covered with a lot of equipment - from drones to tractors (yes, I mean IoT). Moreover, in the digital age, we ourselves create data, many of which contain location information. Mobile communications, applications on smartphones, credit cards - all this creates our digital portrait in space. Many of these portraits create truly monstrous unstructured data sets.
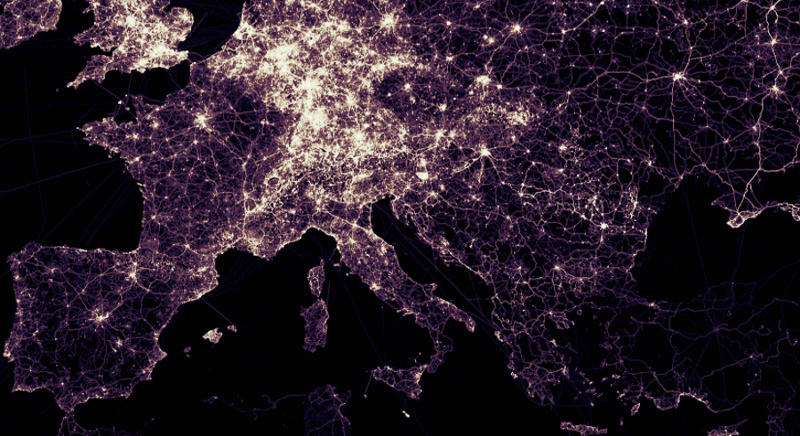
In the picture - visualization of OpenStreetMap tracks using GeoWave
')
Where is the junction of GIS and distributed computing? What is “big geodata”? What tools will help us?
Here to the place to mention a little hackneyed, but still not deprived of the term BigData, Big Data. Decryption of this term often depends on the personal opinion of deciphering, on what tools and in what sphere it uses. Often, BigData is used as a comprehensive term to describe technologies and algorithms for processing large arrays of unstructured data. Often the main idea is the speed of data processing due to the use of distributed computing algorithms.
In addition to processing speed and data volume, there is also an aspect of the “complexity” of data. How to divide complex data into parts, “partitions” for parallel processing? Geodata initially belonged to complex data, and with the transition to “large geodata” this complexity increases almost exponentially. Accordingly, not just the processing of billions of records, but billions of geographic features, which are not just points, but lines and polygons, become important. In addition, the calculation of spatial relationships is often required.
Spatial indexing comes to the rescue, and often classical indexing methods are poorly applicable here. There are many approaches to indexing two-dimensional and three-dimensional space. For example, geodetic networks familiar to many, quadrant trees, R-trees:
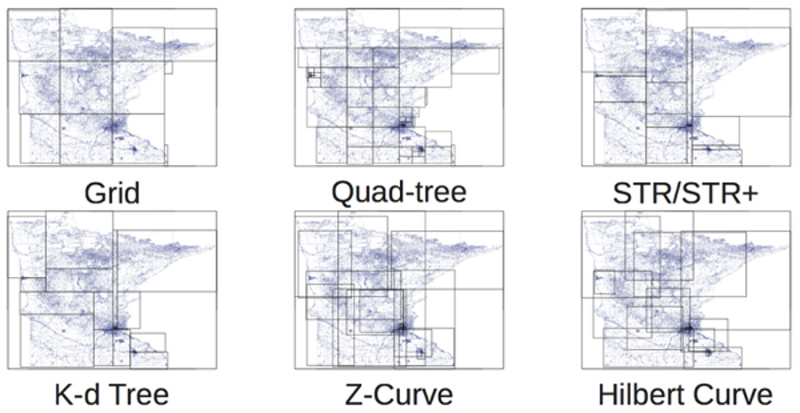
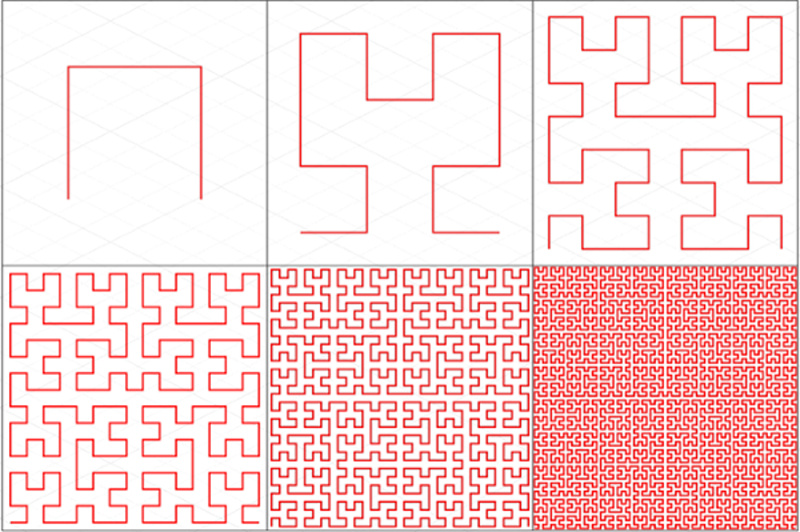
One of the most interesting methods is the variety of “space-filling curves,” the Z-Curve and the Gilbert Curve in the figure above. The pioneer of these curves was Giuseppe Peano. The basic idea is to transform multidimensional space into one-dimensional with the help of a curve that fractally fills the entire space. For example, the Hilbert curve fills a plane:
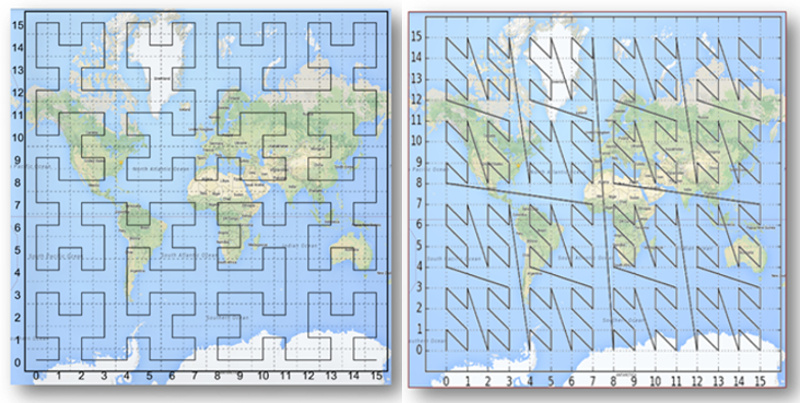
And this is how these curves look on the earth's surface:
Having adopted these indices, we can finally arrive at a geodata partitioning. Do we need to reinvent techniques? Fortunately, no! Already existing frameworks come to our aid. There are many of them, each of them has its own applicability and its own strengths. Below I will tell about the most remarkable.
GeoJinni (formerly known as SpatialHadoop) is an extremely interesting extension for Hadoop, adding geospatial functions to various Hadoop layers and components for storing, processing, and indexing large geodata. To be precise, the extension affects the MapReduce and storage layers, and also adds its own operational layer.
At the lowest level, a new data type is added, which allows storing and processing geodata as a key value. Also added tools for loading and unloading of various formats of geodata. In contrast to the classical structure (more precisely, its absence) of the Hadoop repository, GeoJinni creates two layers of the index space, local and global. The global index allows data to be partitioned by the nodes of a cluster, while the local index is responsible for the partitions on each node. This concept allows the use of three types of indices - Grid, R-tree and R + -tree. All indexes are built on user request and are placed directly in HDFS.
GeoJinni is installed as an extension to an existing Hadoop cluster, which does not require re-building the cluster. The extension can be easily installed in different Hadoop distributions, for example, Apache Hadoop, Cloudera or Hortonworks.
 GeoMesa is a set of tools designed specifically for distributed processing, analysis and visualization of large space-time data, including streaming data. For example, IoT sensor data streams, social network data.
The basis for storing massive data sets are distributed column types of storage, such as Accumulo, HBase, Google Bigtable. This allows you to quickly access this data through queries using distances and areas. GeoMesa also allows you to process data almost in real time through a special layer for the Apache Kafka streaming system.
Finally, by connecting to the GeoServer GIS server, GeoMesa provides access to its streaming services via the OGC WFS and WMS protocols, which gives plenty of space-time analysis and visualization, from maps to graphs.
 GeoWave was conceived in its concept as an analogue of PostGIS, a spatial extension of PostgreSQL, but for the distributed column storage Accumulo. For a long time it was limited to this storage, while remaining a project with a closed code. Only recently the code was transferred to the Apache fund. And the HBase storage and the Mapnik mapping engine are already connected.
Provides Accumulo with multi-spatial indices, standard geographic types and operations, and the ability to process PDAL point clouds. Data processing occurs through extensions for MapReduce, and visualization through a plugin to GeoServer.
It is very similar in its concept with GeoMesa, uses the same storage, but focuses not on spatial-temporal samples, but on the visualization of multidimensional data arrays.

GeoTrellis is different from its fellows. He was conceived not as a tool for working with large arrays of geodata, but as the ability to utilize distributed computing to maximize the processing speed of even standard amounts of geodata. First of all, we are talking about processing rasters, but due to an efficient partitioning system, it has become possible to perform both spatial operations and data conversion. The main development tools are Scala and Akka, the distributed analytics tool is Apache Spark.
The global goal of the project is to provide responsive and rich tools at the web application level, which should change the user experience in using distributed computing systems. Ultimately, the development of an open geotechnology ecosystem, where GeoTrellis will complement PostGIS, GeoServer and OpenLayers. The main goals of the development team are the following:
GeoTrellis is an excellent developer framework designed to create responsive and simple REST services for accessing geoprocessing models. Optimization and parallelization is done by the framework itself.

Although Esri toolsets are formally open, their use makes sense primarily with Esri products. The concept is very similar to GeoJinni.
Tools are divided into three levels.
Geodata has always been somewhere close to big data, and the arrival of distributed computing tools allows you to do really interesting things, allowing not only geographers, but also data analysts (or as they are called Fashion Science) to make new discoveries in data analysis. Instant modeling of flooding, creation of horizon lines, spatial statistics, population analysis, creation of three-dimensional models from point clouds, analysis of satellite images.
The following articles will be devoted to tools and their scope. Your comments can help us develop topics for the following articles.
Today we are surrounded by a huge amount of unstructured data, which until recently was unthinkable to process. An example of such data may be, for example, weather sensor data used for accurate weather forecasting. More structured, but no less massive datasets are, for example, satellite images (a number of articles from the OpenDataScience community are even devoted to image processing algorithms using machine learning). A set of high-resolution images, say, for the whole of Russia, takes several petabytes of data. Or the revision history of OpenStreetMap is a terabyte of xml. Or laser scan data. Finally, data from a huge number of sensors, which are covered with a lot of equipment - from drones to tractors (yes, I mean IoT). Moreover, in the digital age, we ourselves create data, many of which contain location information. Mobile communications, applications on smartphones, credit cards - all this creates our digital portrait in space. Many of these portraits create truly monstrous unstructured data sets.
In the picture - visualization of OpenStreetMap tracks using GeoWave
')
Where is the junction of GIS and distributed computing? What is “big geodata”? What tools will help us?
Here to the place to mention a little hackneyed, but still not deprived of the term BigData, Big Data. Decryption of this term often depends on the personal opinion of deciphering, on what tools and in what sphere it uses. Often, BigData is used as a comprehensive term to describe technologies and algorithms for processing large arrays of unstructured data. Often the main idea is the speed of data processing due to the use of distributed computing algorithms.
In addition to processing speed and data volume, there is also an aspect of the “complexity” of data. How to divide complex data into parts, “partitions” for parallel processing? Geodata initially belonged to complex data, and with the transition to “large geodata” this complexity increases almost exponentially. Accordingly, not just the processing of billions of records, but billions of geographic features, which are not just points, but lines and polygons, become important. In addition, the calculation of spatial relationships is often required.
Spatial Partitioning
Spatial indexing comes to the rescue, and often classical indexing methods are poorly applicable here. There are many approaches to indexing two-dimensional and three-dimensional space. For example, geodetic networks familiar to many, quadrant trees, R-trees:
One of the most interesting methods is the variety of “space-filling curves,” the Z-Curve and the Gilbert Curve in the figure above. The pioneer of these curves was Giuseppe Peano. The basic idea is to transform multidimensional space into one-dimensional with the help of a curve that fractally fills the entire space. For example, the Hilbert curve fills a plane:
And this is how these curves look on the earth's surface:
Having adopted these indices, we can finally arrive at a geodata partitioning. Do we need to reinvent techniques? Fortunately, no! Already existing frameworks come to our aid. There are many of them, each of them has its own applicability and its own strengths. Below I will tell about the most remarkable.
GeoJinni (formerly SpatialHadoop)
GeoJinni (formerly known as SpatialHadoop) is an extremely interesting extension for Hadoop, adding geospatial functions to various Hadoop layers and components for storing, processing, and indexing large geodata. To be precise, the extension affects the MapReduce and storage layers, and also adds its own operational layer.
At the lowest level, a new data type is added, which allows storing and processing geodata as a key value. Also added tools for loading and unloading of various formats of geodata. In contrast to the classical structure (more precisely, its absence) of the Hadoop repository, GeoJinni creates two layers of the index space, local and global. The global index allows data to be partitioned by the nodes of a cluster, while the local index is responsible for the partitions on each node. This concept allows the use of three types of indices - Grid, R-tree and R + -tree. All indexes are built on user request and are placed directly in HDFS.
GeoJinni is installed as an extension to an existing Hadoop cluster, which does not require re-building the cluster. The extension can be easily installed in different Hadoop distributions, for example, Apache Hadoop, Cloudera or Hortonworks.
Geomesa
The basis for storing massive data sets are distributed column types of storage, such as Accumulo, HBase, Google Bigtable. This allows you to quickly access this data through queries using distances and areas. GeoMesa also allows you to process data almost in real time through a special layer for the Apache Kafka streaming system.
Finally, by connecting to the GeoServer GIS server, GeoMesa provides access to its streaming services via the OGC WFS and WMS protocols, which gives plenty of space-time analysis and visualization, from maps to graphs.
Geowave
Provides Accumulo with multi-spatial indices, standard geographic types and operations, and the ability to process PDAL point clouds. Data processing occurs through extensions for MapReduce, and visualization through a plugin to GeoServer.
It is very similar in its concept with GeoMesa, uses the same storage, but focuses not on spatial-temporal samples, but on the visualization of multidimensional data arrays.
GeoTrellis
GeoTrellis is different from its fellows. He was conceived not as a tool for working with large arrays of geodata, but as the ability to utilize distributed computing to maximize the processing speed of even standard amounts of geodata. First of all, we are talking about processing rasters, but due to an efficient partitioning system, it has become possible to perform both spatial operations and data conversion. The main development tools are Scala and Akka, the distributed analytics tool is Apache Spark.
The global goal of the project is to provide responsive and rich tools at the web application level, which should change the user experience in using distributed computing systems. Ultimately, the development of an open geotechnology ecosystem, where GeoTrellis will complement PostGIS, GeoServer and OpenLayers. The main goals of the development team are the following:
- Build Scalable High Performance Web Geoservices
- Creating distributed geoservices for processing “large geodata”
- Maximum parallelization of data processing
GeoTrellis is an excellent developer framework designed to create responsive and simple REST services for accessing geoprocessing models. Optimization and parallelization is done by the framework itself.
GIS Tools for Hadoop
Although Esri toolsets are formally open, their use makes sense primarily with Esri products. The concept is very similar to GeoJinni.
Tools are divided into three levels.
- Esri Geometry API for Java. Library for the expansion of Hadoop geospatial abstractions and operations
- Spatial Framework for Hadoop. Extension for using geospatial queries in Hive Query Language
- Geoprocessing Tools for Hadoop. Directly integration tools Hadoop and ArcGIS, allowing you to perform distributed spatial analysis operations in desktop and server applications.
What's next?
Geodata has always been somewhere close to big data, and the arrival of distributed computing tools allows you to do really interesting things, allowing not only geographers, but also data analysts (or as they are called Fashion Science) to make new discoveries in data analysis. Instant modeling of flooding, creation of horizon lines, spatial statistics, population analysis, creation of three-dimensional models from point clouds, analysis of satellite images.
The following articles will be devoted to tools and their scope. Your comments can help us develop topics for the following articles.
- Which of the frameworks would you like to read first?
- What application of distributed computing would you like to know more about?
Source: https://habr.com/ru/post/330758/
All Articles