Estimation of aging parameters using wearable electronics. Lecture in Yandex
Wearable devices are now in fashion, but are mainly used for fitness and sports. How to find them another use? What can they say about our health and longevity? And most importantly - how to evaluate the data received from them? Timofey Pyrkov, head of mHealth R & D at Gero, gave an excellent lecture on human locomotor activity.
Under the cut - the decoding and most of the slides.
My report is not so much about aging as about general health. And the source of health data is information from trackers, that is, information about the user's motor activity, in English locomotor.
')
Our company Gero is small. we are developing drugs using computer programs, as well as searching for biomarkers about health status. And including trying to understand how human health changes depending on the presence or absence of diseases and on the aging of the organism as a whole. We publish papers in scientific journals, and the source of our data is usually open datasets containing information from many users about the genome in the form of transcriptomes, protopes, and blood tests. In particular, we are interested in physical activity. It turned out that quite a lot of such information is known. She is going with the help of accelerometers. For example, with bracelets that can be worn on the wrist. And there is an open dataset NHANES , where there is a lot of such information for tens of thousands of users. We also cooperate with the UK Biobank, in which there is much more such information, already for hundreds of thousands of users, but it is not in the public domain.

What is motor activity? It is going in a very simple way. The user wears some kind of device that has an accelerometer, he records the acceleration at some frequency, usually in several hertz - 50 or 100. This can be just a pedometer. The pedometer usually gives the user information about the total activity - for example, how many steps a day have you taken. But including the pedometer records it with greater frequency just every minute. That is, such a track looks like approximately in the middle of a slide. This is a sample for two days from one user. It is seen that there is a dominant effect of the circadian rhythm. That is, at night there is no activity - the user is sleeping. During the day he somehow walks, sometime more, sometime less. Sometimes it may even go for a run.
What can you do with such information? Usually, when a person buys a fitness tracker, for example, or puts himself an application on the phone to monitor fitness, it gives him very simple information in the form of a total average heart rate or the number of steps per day. You can use this information. But it seems that if you look at it in more detail, you will learn more about the state of health or what is happening with the body. And in general, data looks something like this. Next you need to understand where science is. Science, probably, is to compare some users with others. Try to understand who is older, who is younger, who is healthier, who has any health problems. Maybe you should already go to the doctor. The question is how to compare the track that is shown on the slide. You cannot directly compare it among users, because a large component of individual social behavior is implicated there. Someone goes to work earlier, someone later, everyone has their own schedule. At the weekend, someone prefers to lie down, sleep, someone - on the contrary, to work, someone - to go to fitness. It is clear that this information is not entirely about physiology, not exactly about health, but more about social behavior and social status. Therefore, naturally, there is a desire to get some kind of a descriptor for such a date, to conduct feature engineering, which will discard social patterns that are unnecessary for our analysis and leave substantial information about physiology.
We look at such tracks, and the first thing we notice is the time series. They are similar in their behavior to the stochastic process. Naturally, there is a desire to look in the textbook, to see how such processes are described.
The simplest example is the Markov process, and it is accurately described by a set of transitions from state to state. Therefore, we take such tracks from all users, we break them into different states. In our case, this is a very simple procedure: just by the number of steps every minute we beat the whole track into states with low, medium, high and very high activity. Further, walking along the track, we calculate the probability of moving from one to another. Thus, we obtain a feature, a descriptor that describes each user, an individual locomotor signature, and a fingerprint. It looks like a matrix of state transition sets: from low to high and vice versa. Here is a picture of the intensity of transitions for one person.
Got this handle. What can we learn from it about physiology? Here is our goal. The greatest physiological changes associated with age-related changes.

Therefore, we first want to see how such a rather crude description allows us to learn something about physiology.
About age-related changes in motor activity can be found in the literature. There are known fairly simple things known for a long time. This is, for example, a drop in total activity, it can be seen in the level. Including you can look at the spectrum of such a time series. Here are the average spectra for conditionally young and old groups - 35 and 45 years, respectively. That is, these are people in their prime. And - already elderly, 70-80, blue and green. It is seen that, in general, the spectral power decreases with aging of a person.
There is another well-known and rather interesting thing that you cannot just get by looking at the number. How many steps you take every day are the acceleration of behavioral motives in time. This is exactly the feature that can be obtained from the analysis of intraday Data, that is, the minute number of steps every minute. I will not dwell on this in more detail, but I will briefly say that our descriptor allows you to learn from locomotor activity such features too.
Therefore, we believe that we have a fairly good signal averaging using this approach, using such feature engineering. We are deleting from the descriptor all the unnecessary features relating to social features that could interfere with us, and at the same time leave all the essential information about physiology.
Further, it turns out, we have collected the date, preprocessed, received some descriptors, and now we want to learn something about the state of health. For this there are, roughly speaking, two groups of methods: supervised and unsupervised. Supervised - training models with control. That is, you usually have some sort of label - for example, age, diagnoses - and you are trying to build a model just for it. And unsupervised methods allow you to learn something about the data structure. The good thing about our signal is that it's just an accelerometer — a reasonably cheap way to collect data. Such data can be collected even with the help of smartphones, and they are for a large number of people. As a result, we get a dataset where the number of samples is quite large. Here it becomes possible to apply unsupervised methods, that is, not to force the model to adapt to some kind of diagnosis, but simply to see how the data is arranged.
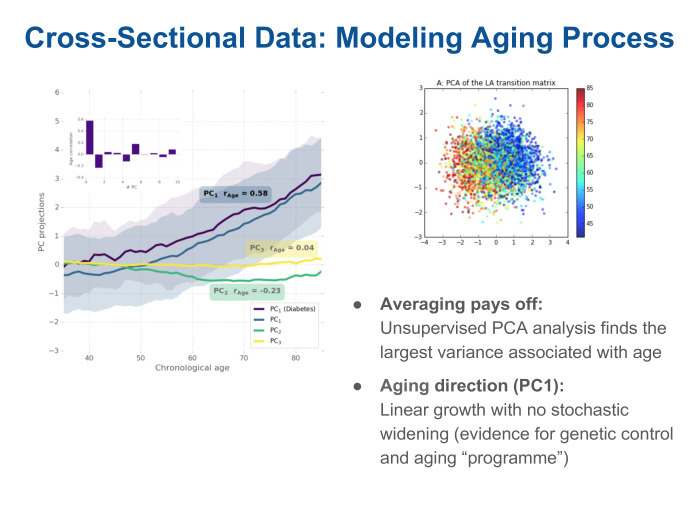
We use the analysis of the main components - the most obvious way to cluster the data, to see what they contain. And we see on the graph on the left that there are several components - they are ranked by the degree of how they describe the variability of the data. The biggest variation is related to age. The projection on this component is paid depending on the age of the patients. It can be seen that it grows linearly with age. And this is the only direction that correlates with age. In fact, by turning to this signal, we received a version of the biological age from a regular tracker that records the number of steps.
What can we do next. Since this is a bio-age, it is rather noisy, but nevertheless it allows users to be ranked by, say, an age cohort. What is it useful for? For example - to predict the effect of some health conditions or diagnoses on life expectancy.
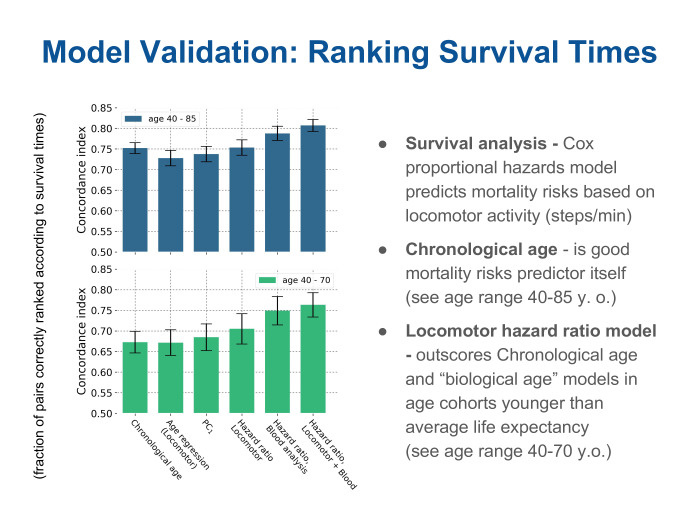
And in this regard, the question arises: how to evaluate its accuracy? We got a model describing aging. Can somehow give an amendment to the fact that a sick person is older, or vice versa, is engaged in fitness, leads a healthy lifestyle and seems younger than his years? The question is, what is the accuracy of each model? We look at the assessment of the accuracy of the ranking of survival times: such data are collected in parallel with medical questionnaires, they are often accompanied by follow up, where each patient is monitored over the next few years, usually 5-10. Often there is information in such datasets that the patient is alive, everything is fine with him. Or, on the contrary - so many years have passed, and he died of illness or of old age.
We can see how accurately the different metrics rank patients by survival time. And we see here that for two age cohorts such metrics of accuracy are given. They are called oncordance index and talk about how much of the pair has been properly ranked.
We see that the first bar is the real age of the patient, the chronological age. It is a fairly high metric, its value is quite high compared to all other methods. The next two bars are different models for age. One of them is the supervised method: using regression, we tried to build age. The other is the projection on the main component, which we found in an unsupervised way. We called this projection simply bio-age. And we see a pretty funny picture. Indeed, in terms of ranking by lifetimes, these two bio-age models are about the same, if you like, good or bad, as if you just look at the patient's passport age and draw the obvious conclusion - the younger you are, the greater the likelihood that you will live even longer , and vice versa. But the next three bars on the right are different models, such special ones, not for bio-age, but models for predicting the risks of mortality. In English, the hazards model is a model of risks, threats, dangers, but in fact it is a question of predicting the risks of mortality, or the likelihood that each patient will die within a short time. We see that models built on a descriptor obtained simply from a locomotor sensor allow a cohort of people up to an average life expectancy ... We look at the bottom figure. It can be seen that the three green bars on the right are different models. One - just on the locomotor descriptor, and the other two with the addition of additional parameters - such as a blood test - can significantly improve the quality of prediction, the quality of evaluation. This is especially good for people who are even younger than life expectancy. But the effect is not so noticeable on the upper graph, where there are all patients, including very old ones. It means that there are limits of applicability and today the chronological age quite accurately tells us: if you are already a very old person, then there are few ways to prolong your life somehow.
But in fact, this whole story is quite interesting from the point of view of analyzing health in the population. In other words, the risks of mortality are probabilistic in nature. Therefore, for each particular user of the pedometer such information is unlikely to be very interesting and even hardly useful. Who, really, will be in the region of 40 or even 70 years to think hard about how to affect his life expectancy - will I soon become old, will I soon die? Therefore, I want to understand what other information, more relevant to the user, can be extracted.
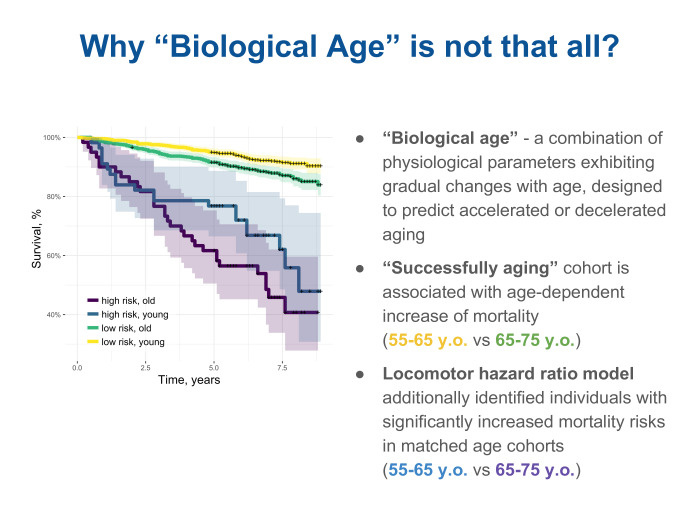
Here we are helped by analyzing the meta-date and trying to figure out why our model provides some kind of improvement compared to a simple estimation by age, compare, see what is really the difference, that such a locomotory descriptor, a descriptor about physical activity, can tell about the state of health, about the physiology of the organism - in addition to assessing that such and such is older and such and such younger. We took two age groups and additionally looked at a cohort in each of them, ranked according to the risk of mortality by our descriptors, thus dividing them into old and young. It is yellow and green on top. But yellow and green are the so-called successfully aging people, successfully aging, there is such a term in English-language literature. And paid (nrzb. - approx. Ed.) For them survival curves. The higher the curve, the greater the number of follow up patients left alive. We see that among successful aging people, the probability of death is slowly increasing. In other words, the survival curve gradually decreases from yellow for younger to green. But at the same time, a model built using a locomotor descriptor also makes it possible to select a cohort with increased risks according to its assessment. And we look at such survival curves and see that they are significantly lower and the dependence on age is not so well traced in them. It is blue for the young and high risk, and purple for slightly older, also with high risk. From here we understand that there are some characteristics of physiology that can be recognized without sending a person to the hospital, without taking any blood tests or genome tests from him, but simply by observing how he moves, through the sensor in the bracelet or, maybe even on the phone.
I want to understand what effect the locomotor track sees.
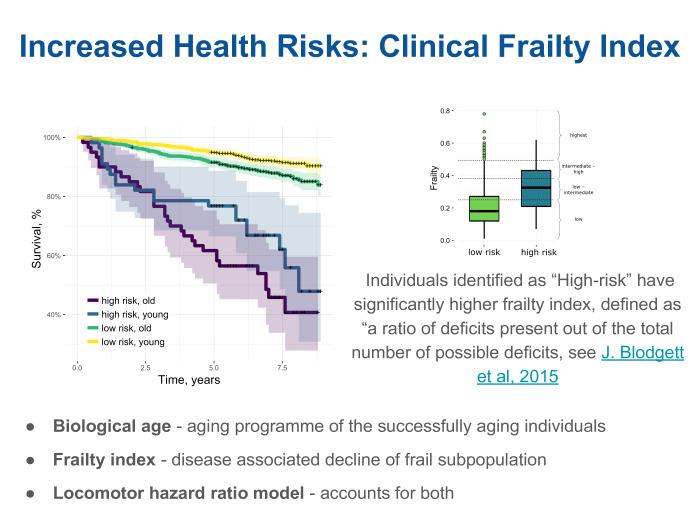
We looked and found that the clinic often uses the index of weakness - the frailty index. Very simple thing. There is a list of known chronic diseases. For example, there are hundreds of them, and each patient can complete a list of the doctor’s analysis through a questionnaire. The doctor will say that a patient from this list has 15 diseases, and another has 30, and the third has 50. And the frailty index is the proportion of diseases observed from the list. It turned out that, indeed, our model, built on human locomotor activity, correlates quite well in each age cohort with this index. In fact, it turns out that there are two independent components. One shows how, on average, organisms age. This effect can be measured through locomotor activity. But there is another component that assesses overall health, regardless of age. We call these two components bio-age and frailty and see that our rather simple approach is already able to take both of these effects into account.
Still, the question remains, what for each person personally?

About aging, maybe not very interesting, but we can remember that in reality everyone is aging, aging is slow. Indeed, the effect of aging will be visible after many, many years. But there are some parameters of health, and in fact even what kind of life each person leads. They may not be so noticeable here and now, but will inevitably and inexorably lead to some serious health consequences over many years.
The most famous, the biggest effect on life expectancy have two lifestyles. One of them is smoking, the second is diabetes. Diabetes is not exactly a lifestyle, but often it is type 2 diabetes, very strongly associated with obesity. Therefore, conditionally, we can call it related to lifestyle. We look at the data we work with. We see that, indeed, there is such information in the metadata. We see that our model can popularly scour the population of non-smokers. On the top graph, it is marked light. She is against smokers, for them she predicts increased risks, increased hazard ratio. Moreover, it can predict in a certain sense in a dose-dependent degree. That is, it is clear that the so-called heavy smokers are shown in dark color - those who smoke more packs per day. And those who have less packs per day are in an intermediate position between non-smokers and smokers.
Our model was built on the NHANES dataset, green on the left. For diabetes is the same. In diabetics, this lifestyle, increased hazard, is also sensible.
It was very good to get access to other datasets. That is, we built a model on a single dataset. NHANES - American Dataset, National Health And Nutrition Examination. In other words, there is data on blood, locomotor activity, and a fairly large number of questionnaires filled in the clinic. We looked at another dataset. This is an English UK Biobank. It also has locomotor data, there is also blood, genetics and metadata from medical questionnaires. And we were very pleased to see that without any additional changes, without tuning and without pre-training, the model is quite easily portable to another datasheet. It is significant here that in one dataset there was one device, and in the other another. In NHANES, it was a single-axis accelerometer worn on a belt, much like my walkie-talkie. And in the UK Biobank it was a completely different device - a three-axis accelerometer, which patients wear on their wrist as a fitness tracker. And we see that all the trackers are the same, and if we are able to extract some information from the model in dataset, then we will have good chances to just take and transfer to real-life cases.
This is all, again, closer to the individual story. There are life-styles here and you are able to apply some kind of intervention with the help of life-style, having learned, for example, that smoking or obesity affects health and longevity. You can quit smoking, go to fitness. - , . , , , - , , . , , .

, . , , — , , , 35 45 . — , — , , .
— , . , never smokers — — - . , , . , . , , , , , . , . , .

, ? , , , , , . . , , 10 . It's a lot. . NHANES — . , , . , , , volcano plot. — wellness score. hazard ratio, , , , , . user friendly-. , , , , , p-value. , , , , , , , , , , occupation — . — : , ; body composition — - ; dietary, , body weight — , . , , , -, , , .
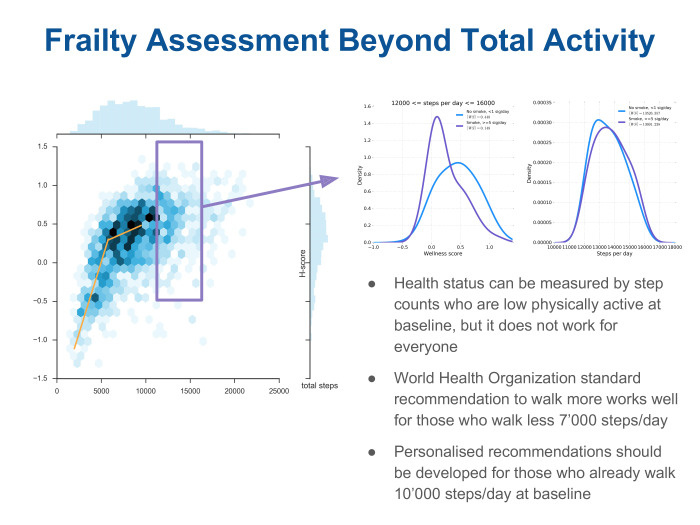
, , - -, — . scatter plot , , — . . , , wellness score . , , , 7 . , . , , — . , . -, . - . : « , ». , — 12 16 . . , . , , - . , .
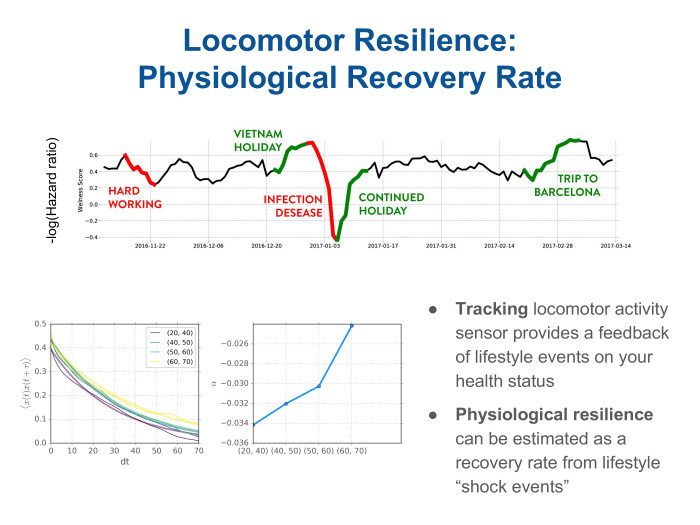
? , , - . , , . wellness score, . - . — . , .
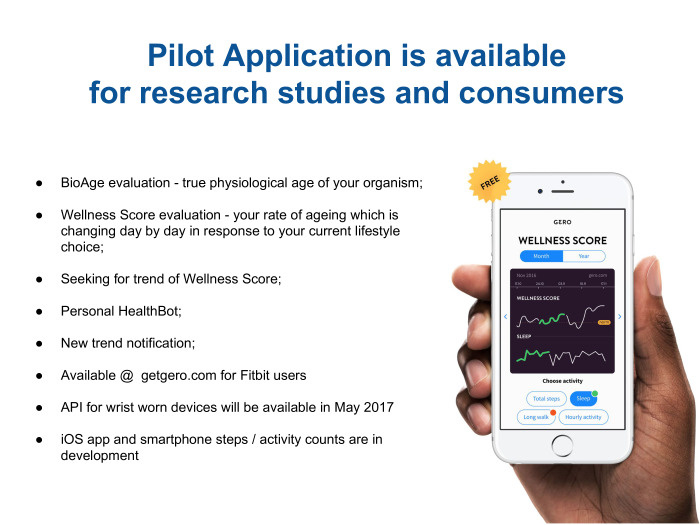
, . , Fitbit. , , BIH Wellness score, frailty-. API . Fitbit, , . , - iPhone, .
, .
Under the cut - the decoding and most of the slides.
My report is not so much about aging as about general health. And the source of health data is information from trackers, that is, information about the user's motor activity, in English locomotor.
')
Our company Gero is small. we are developing drugs using computer programs, as well as searching for biomarkers about health status. And including trying to understand how human health changes depending on the presence or absence of diseases and on the aging of the organism as a whole. We publish papers in scientific journals, and the source of our data is usually open datasets containing information from many users about the genome in the form of transcriptomes, protopes, and blood tests. In particular, we are interested in physical activity. It turned out that quite a lot of such information is known. She is going with the help of accelerometers. For example, with bracelets that can be worn on the wrist. And there is an open dataset NHANES , where there is a lot of such information for tens of thousands of users. We also cooperate with the UK Biobank, in which there is much more such information, already for hundreds of thousands of users, but it is not in the public domain.

What is motor activity? It is going in a very simple way. The user wears some kind of device that has an accelerometer, he records the acceleration at some frequency, usually in several hertz - 50 or 100. This can be just a pedometer. The pedometer usually gives the user information about the total activity - for example, how many steps a day have you taken. But including the pedometer records it with greater frequency just every minute. That is, such a track looks like approximately in the middle of a slide. This is a sample for two days from one user. It is seen that there is a dominant effect of the circadian rhythm. That is, at night there is no activity - the user is sleeping. During the day he somehow walks, sometime more, sometime less. Sometimes it may even go for a run.
What can you do with such information? Usually, when a person buys a fitness tracker, for example, or puts himself an application on the phone to monitor fitness, it gives him very simple information in the form of a total average heart rate or the number of steps per day. You can use this information. But it seems that if you look at it in more detail, you will learn more about the state of health or what is happening with the body. And in general, data looks something like this. Next you need to understand where science is. Science, probably, is to compare some users with others. Try to understand who is older, who is younger, who is healthier, who has any health problems. Maybe you should already go to the doctor. The question is how to compare the track that is shown on the slide. You cannot directly compare it among users, because a large component of individual social behavior is implicated there. Someone goes to work earlier, someone later, everyone has their own schedule. At the weekend, someone prefers to lie down, sleep, someone - on the contrary, to work, someone - to go to fitness. It is clear that this information is not entirely about physiology, not exactly about health, but more about social behavior and social status. Therefore, naturally, there is a desire to get some kind of a descriptor for such a date, to conduct feature engineering, which will discard social patterns that are unnecessary for our analysis and leave substantial information about physiology.
We look at such tracks, and the first thing we notice is the time series. They are similar in their behavior to the stochastic process. Naturally, there is a desire to look in the textbook, to see how such processes are described.
The simplest example is the Markov process, and it is accurately described by a set of transitions from state to state. Therefore, we take such tracks from all users, we break them into different states. In our case, this is a very simple procedure: just by the number of steps every minute we beat the whole track into states with low, medium, high and very high activity. Further, walking along the track, we calculate the probability of moving from one to another. Thus, we obtain a feature, a descriptor that describes each user, an individual locomotor signature, and a fingerprint. It looks like a matrix of state transition sets: from low to high and vice versa. Here is a picture of the intensity of transitions for one person.
Got this handle. What can we learn from it about physiology? Here is our goal. The greatest physiological changes associated with age-related changes.

Therefore, we first want to see how such a rather crude description allows us to learn something about physiology.
About age-related changes in motor activity can be found in the literature. There are known fairly simple things known for a long time. This is, for example, a drop in total activity, it can be seen in the level. Including you can look at the spectrum of such a time series. Here are the average spectra for conditionally young and old groups - 35 and 45 years, respectively. That is, these are people in their prime. And - already elderly, 70-80, blue and green. It is seen that, in general, the spectral power decreases with aging of a person.
There is another well-known and rather interesting thing that you cannot just get by looking at the number. How many steps you take every day are the acceleration of behavioral motives in time. This is exactly the feature that can be obtained from the analysis of intraday Data, that is, the minute number of steps every minute. I will not dwell on this in more detail, but I will briefly say that our descriptor allows you to learn from locomotor activity such features too.

Therefore, we believe that we have a fairly good signal averaging using this approach, using such feature engineering. We are deleting from the descriptor all the unnecessary features relating to social features that could interfere with us, and at the same time leave all the essential information about physiology.
Further, it turns out, we have collected the date, preprocessed, received some descriptors, and now we want to learn something about the state of health. For this there are, roughly speaking, two groups of methods: supervised and unsupervised. Supervised - training models with control. That is, you usually have some sort of label - for example, age, diagnoses - and you are trying to build a model just for it. And unsupervised methods allow you to learn something about the data structure. The good thing about our signal is that it's just an accelerometer — a reasonably cheap way to collect data. Such data can be collected even with the help of smartphones, and they are for a large number of people. As a result, we get a dataset where the number of samples is quite large. Here it becomes possible to apply unsupervised methods, that is, not to force the model to adapt to some kind of diagnosis, but simply to see how the data is arranged.
We use the analysis of the main components - the most obvious way to cluster the data, to see what they contain. And we see on the graph on the left that there are several components - they are ranked by the degree of how they describe the variability of the data. The biggest variation is related to age. The projection on this component is paid depending on the age of the patients. It can be seen that it grows linearly with age. And this is the only direction that correlates with age. In fact, by turning to this signal, we received a version of the biological age from a regular tracker that records the number of steps.
What can we do next. Since this is a bio-age, it is rather noisy, but nevertheless it allows users to be ranked by, say, an age cohort. What is it useful for? For example - to predict the effect of some health conditions or diagnoses on life expectancy.

And in this regard, the question arises: how to evaluate its accuracy? We got a model describing aging. Can somehow give an amendment to the fact that a sick person is older, or vice versa, is engaged in fitness, leads a healthy lifestyle and seems younger than his years? The question is, what is the accuracy of each model? We look at the assessment of the accuracy of the ranking of survival times: such data are collected in parallel with medical questionnaires, they are often accompanied by follow up, where each patient is monitored over the next few years, usually 5-10. Often there is information in such datasets that the patient is alive, everything is fine with him. Or, on the contrary - so many years have passed, and he died of illness or of old age.
We can see how accurately the different metrics rank patients by survival time. And we see here that for two age cohorts such metrics of accuracy are given. They are called oncordance index and talk about how much of the pair has been properly ranked.
We see that the first bar is the real age of the patient, the chronological age. It is a fairly high metric, its value is quite high compared to all other methods. The next two bars are different models for age. One of them is the supervised method: using regression, we tried to build age. The other is the projection on the main component, which we found in an unsupervised way. We called this projection simply bio-age. And we see a pretty funny picture. Indeed, in terms of ranking by lifetimes, these two bio-age models are about the same, if you like, good or bad, as if you just look at the patient's passport age and draw the obvious conclusion - the younger you are, the greater the likelihood that you will live even longer , and vice versa. But the next three bars on the right are different models, such special ones, not for bio-age, but models for predicting the risks of mortality. In English, the hazards model is a model of risks, threats, dangers, but in fact it is a question of predicting the risks of mortality, or the likelihood that each patient will die within a short time. We see that models built on a descriptor obtained simply from a locomotor sensor allow a cohort of people up to an average life expectancy ... We look at the bottom figure. It can be seen that the three green bars on the right are different models. One - just on the locomotor descriptor, and the other two with the addition of additional parameters - such as a blood test - can significantly improve the quality of prediction, the quality of evaluation. This is especially good for people who are even younger than life expectancy. But the effect is not so noticeable on the upper graph, where there are all patients, including very old ones. It means that there are limits of applicability and today the chronological age quite accurately tells us: if you are already a very old person, then there are few ways to prolong your life somehow.
But in fact, this whole story is quite interesting from the point of view of analyzing health in the population. In other words, the risks of mortality are probabilistic in nature. Therefore, for each particular user of the pedometer such information is unlikely to be very interesting and even hardly useful. Who, really, will be in the region of 40 or even 70 years to think hard about how to affect his life expectancy - will I soon become old, will I soon die? Therefore, I want to understand what other information, more relevant to the user, can be extracted.

Here we are helped by analyzing the meta-date and trying to figure out why our model provides some kind of improvement compared to a simple estimation by age, compare, see what is really the difference, that such a locomotory descriptor, a descriptor about physical activity, can tell about the state of health, about the physiology of the organism - in addition to assessing that such and such is older and such and such younger. We took two age groups and additionally looked at a cohort in each of them, ranked according to the risk of mortality by our descriptors, thus dividing them into old and young. It is yellow and green on top. But yellow and green are the so-called successfully aging people, successfully aging, there is such a term in English-language literature. And paid (nrzb. - approx. Ed.) For them survival curves. The higher the curve, the greater the number of follow up patients left alive. We see that among successful aging people, the probability of death is slowly increasing. In other words, the survival curve gradually decreases from yellow for younger to green. But at the same time, a model built using a locomotor descriptor also makes it possible to select a cohort with increased risks according to its assessment. And we look at such survival curves and see that they are significantly lower and the dependence on age is not so well traced in them. It is blue for the young and high risk, and purple for slightly older, also with high risk. From here we understand that there are some characteristics of physiology that can be recognized without sending a person to the hospital, without taking any blood tests or genome tests from him, but simply by observing how he moves, through the sensor in the bracelet or, maybe even on the phone.
I want to understand what effect the locomotor track sees.

We looked and found that the clinic often uses the index of weakness - the frailty index. Very simple thing. There is a list of known chronic diseases. For example, there are hundreds of them, and each patient can complete a list of the doctor’s analysis through a questionnaire. The doctor will say that a patient from this list has 15 diseases, and another has 30, and the third has 50. And the frailty index is the proportion of diseases observed from the list. It turned out that, indeed, our model, built on human locomotor activity, correlates quite well in each age cohort with this index. In fact, it turns out that there are two independent components. One shows how, on average, organisms age. This effect can be measured through locomotor activity. But there is another component that assesses overall health, regardless of age. We call these two components bio-age and frailty and see that our rather simple approach is already able to take both of these effects into account.
Still, the question remains, what for each person personally?

About aging, maybe not very interesting, but we can remember that in reality everyone is aging, aging is slow. Indeed, the effect of aging will be visible after many, many years. But there are some parameters of health, and in fact even what kind of life each person leads. They may not be so noticeable here and now, but will inevitably and inexorably lead to some serious health consequences over many years.
The most famous, the biggest effect on life expectancy have two lifestyles. One of them is smoking, the second is diabetes. Diabetes is not exactly a lifestyle, but often it is type 2 diabetes, very strongly associated with obesity. Therefore, conditionally, we can call it related to lifestyle. We look at the data we work with. We see that, indeed, there is such information in the metadata. We see that our model can popularly scour the population of non-smokers. On the top graph, it is marked light. She is against smokers, for them she predicts increased risks, increased hazard ratio. Moreover, it can predict in a certain sense in a dose-dependent degree. That is, it is clear that the so-called heavy smokers are shown in dark color - those who smoke more packs per day. And those who have less packs per day are in an intermediate position between non-smokers and smokers.
Our model was built on the NHANES dataset, green on the left. For diabetes is the same. In diabetics, this lifestyle, increased hazard, is also sensible.
It was very good to get access to other datasets. That is, we built a model on a single dataset. NHANES - American Dataset, National Health And Nutrition Examination. In other words, there is data on blood, locomotor activity, and a fairly large number of questionnaires filled in the clinic. We looked at another dataset. This is an English UK Biobank. It also has locomotor data, there is also blood, genetics and metadata from medical questionnaires. And we were very pleased to see that without any additional changes, without tuning and without pre-training, the model is quite easily portable to another datasheet. It is significant here that in one dataset there was one device, and in the other another. In NHANES, it was a single-axis accelerometer worn on a belt, much like my walkie-talkie. And in the UK Biobank it was a completely different device - a three-axis accelerometer, which patients wear on their wrist as a fitness tracker. And we see that all the trackers are the same, and if we are able to extract some information from the model in dataset, then we will have good chances to just take and transfer to real-life cases.
This is all, again, closer to the individual story. There are life-styles here and you are able to apply some kind of intervention with the help of life-style, having learned, for example, that smoking or obesity affects health and longevity. You can quit smoking, go to fitness. - , . , , , - , , . , , .

, . , , — , , , 35 45 . — , — , , .
— , . , never smokers — — - . , , . , . , , , , , . , . , .

, ? , , , , , . . , , 10 . It's a lot. . NHANES — . , , . , , , volcano plot. — wellness score. hazard ratio, , , , , . user friendly-. , , , , , p-value. , , , , , , , , , , occupation — . — : , ; body composition — - ; dietary, , body weight — , . , , , -, , , .

, , - -, — . scatter plot , , — . . , , wellness score . , , , 7 . , . , , — . , . -, . - . : « , ». , — 12 16 . . , . , , - . , .

? , , - . , , . wellness score, . - . — . , .

, . , Fitbit. , , BIH Wellness score, frailty-. API . Fitbit, , . , - iPhone, .
, .
Source: https://habr.com/ru/post/330680/
All Articles