Naively. Super. Review of the book by Jean Zelazny "Speak in the language of diagrams"
The book " Say It With Chart " (literally "Say it using a chart") was written more than 30 years ago (in 1985!), But today it is of interest. It has been translated into the main world languages, reprinted again and again, businessmen, marketers, analysts consider it to be a reference book in 2017 as well.
The book is interesting to read, it has a lot of useful things, but it was expected. Surprise was the lack of information about its author in the network (which also owns several of the world's best-selling books). About Jean Zelazny there is no Wikipedia article (neither in English nor Russian), for requests such as “J. Zelazny’s biography” or “Who is J. Zelazny”, countless sites are issued with the same text - an annotation to the book “Speak chart language. And this, you see, only increases interest, so the review will consist of two parts: “On the book” and “Who is Jean Zelazny?”.
About the book
The book shows how to effectively transmit information in visual form using various charts , graphs and diagrams. The author is "shows", and not just tells. The book is easy to read and in one breath, because 80% of the information in it is images - drawings, diagrams of all kinds, examples of “good and bad”, graphs and tables. And only about 20% of the volume of the book is a text - rules, examples from practice, tips, conclusions. That is, the word "benefit" in the title used is absolutely justified.
')
The main idea is formulated at the very beginning:
“Work on any presentation begins with determining what you want to say. And only then - the choice of the form of a chart and a picture. ”To this thought, the author returns the reader throughout the book. This fact explains the success of the book: despite the fact that it was written a long time ago and the data visualization technology has leaped ahead, the approach and methods remain relevant. Zelazny recognized:
“It was not always the way it is now. I came to the field of visual communications in 1961 BC. That is, before the era of computers, computing and copying machines. ”In the original, a pun is used: “It wasn't always like that. I’ve entered into the field of 1961 BC That's Before Computers, Before Calculators, Before Copiers. BC = B efore C hrist = before Christ, i.e. BC B efore C omputers, B efore C alculators, B efore C opiers.
Therefore, the idea that in communication it is necessary to build on the natural abilities, features of thinking and perception of a person is not obsolete. “The wide spread of computer technology has led to slides being baked like cakes ... Fresh and tasteless. Without having formulated what you want to say, do not grasp the pencil, ”the paper says.
The visual communication manual consists of 4 parts : the choice of diagrams, the use of diagrams, concepts and metaphors in a presentation (solutions in search of a problem) and sayit.com (the use of computer technologies in data presentation).
Part I - a description of the process of converting data into charts. The reader is invited to go the following way:
- “Starting from” evidence formulate the idea,
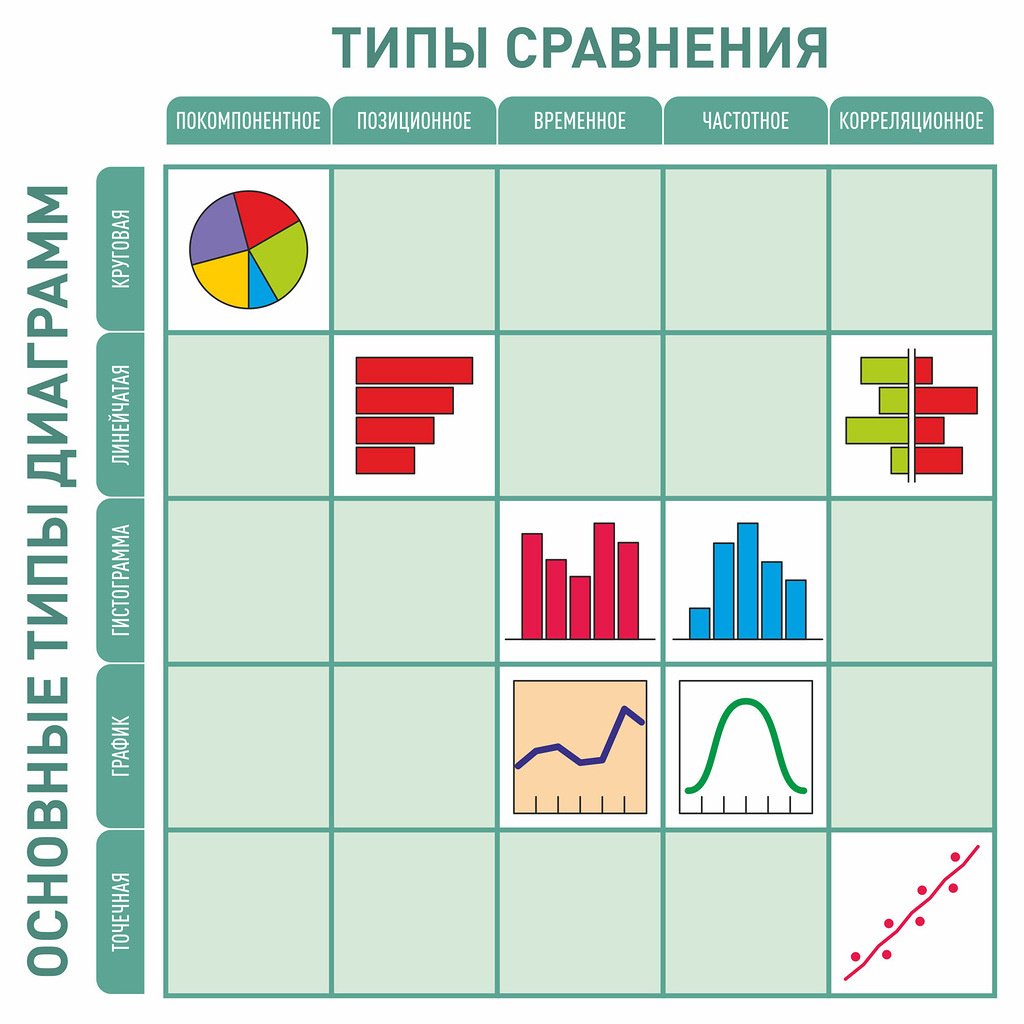
- then determine the type of comparison (all ideas can be shown using 5 types of comparisons),
- based on the type of comparison, select the type of chart.
Gene Zelazny clarifies:
“The type of chart is not determined by data at all (dollars or percentages) and not by certain parameters (profit, profitability or salary), but your idea is what you want to put in the diagram”.
The wording of what you want to say should be concise and clear. The main message - the title of a presentation or a chart - is comparable to the title of an article in a newspaper or magazine. The titles of the diagrams of the type “The number of contracts concluded from January to August” are erroneous (they state the fact that the audience should make a conclusion independently). A good title should indicate the essence of the image, for example, “The number of contracts has grown” (state the conclusion).
Any idea can be conveyed using one of the 5 types of comparison , a convenient tool is to select the desired diagram by keywords (according to the wording of what is needed to convey to the audience, the audience).
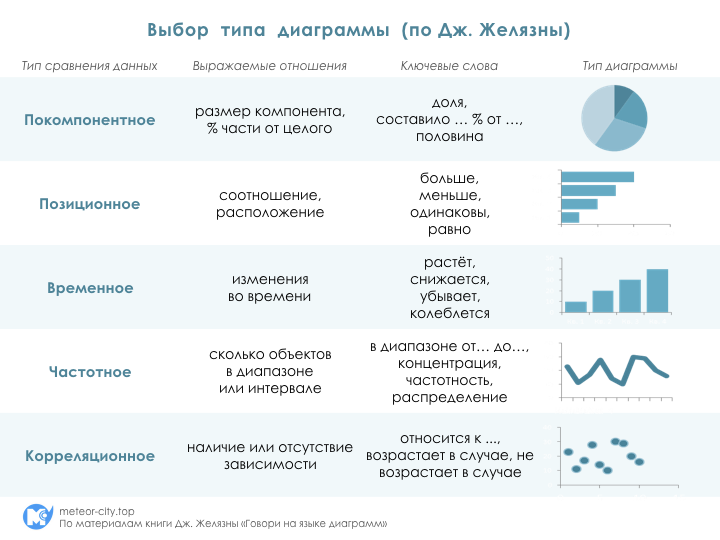
In paragraph 1.3. The first part, “Selecting Charts,” details all 5 main types of charts: circular, bar, histogram, graph, and scatter; their options and examples of use. Some recommendations today seem to be “common truths,” although, perhaps, it was in this book that they were written for the first time:
- Pie chart is the most impractical type of chart.
- Put no more than 6 components on a pie chart, ideally 5 most important, group the rest into one sector with the name “other”.
- The most important sector of the pie chart should go from the 12 o'clock line of the dial (from the top to the right), it should be the most contrast.
- Do not use on the bar chart and histogram at the same time the labels on the scale and the column.
- On the charts use integers, avoiding fractions.
- The grid should not be bright. "The grid is like the lines of a football field; are needed so that the judges could perform their functions, and not to attract the attention of the audience. ”
The first part the author ends up with
“Diagrams are visual aids, auxiliary materials , and by no means a replacement for written and spoken words. Use them skillfully, and they will stand you in good stead. ”
To check whether the reader is ready to “skillfully use” the described (whether the information is correctly understood and assimilated), a workshop is offered. Several real-world tasks for self-solution — you need to select a type of diagram illustrating one or another idea, draw on specially left pages and compare with the correct answers.
Part II deals with the use of 5 types of diagrams to convey relevant ideas. On 44 pages, the author consistently comments on and examines in detail 80 examples of diagrams of different types. The material helps to delve into the types of data visualization listed in the first part. The author gives illustrations (examples of diagrams), comments on them, compares with others.
The idea that the visualization of an idea needs to be tested in all possible ways seemed to be productive, and only then choose the best one. Zelazny writes:
“You don't have to grab the first idea you like. Keep looking, play with charts and eventually you will find the perfect visual solution. ”
According to the author, to check the effectiveness of the selected chart option, you need to remove the scale:
“Lack of scales should not interfere with the understanding of relationships. By removing the scales, you can successfully check whether the diagrams are clearly drawn up, whether they clearly convey the basic idea. ”
Among the diagrams described in the second part there are unusual ones that can become a source of new (or well forgotten old) ideas.
Part III "Concepts and metaphors in the presentation (Solutions in search of a problem)" - 50 pages of figures, diagrams, models of visualization of processes, relationships, movement, interaction with a minimum of text (titles and rare, brief explanations). All these “visual solutions to communication problems” are divided into two groups: visual concepts (abstract figures) and visual metaphors (objects of the surrounding world). This is a ready-made set of images for use in reports, presentations or articles - it is enough to fill in the content you need.
Part IV deals with "how to develop visual aids for a presentation on a computer."
Considered useful in a computer presentation. Gene Zelazny considers animation effects, movement of elements, color photos, sounds, videos and links. The main advantages (compared to “pre-Internet” printed materials) are the speed of creating graphic work and the ability to make changes in a matter of minutes (right on the spot where the presentation will take place or on the way to it). The minuses are technical difficulties (a projector, screen, etc. are needed) and “the feeling that the speaker is splashing eyes, and he is more concerned with the form, not the content of the information”.
Lists the rules for a good presentation (for example, “the bigger the better”). A separate paragraph of the color discourse in the presentation: “use the color for its intended purpose, and not for beauty”; color assignments - select the necessary elements, mark the keynote (one parameter on different slides with the same color), symbolically depict (use the symbolic color value).
To test the effectiveness of the presentation, the author recommends translating it into black and white. Images and text should be clear, readable even from afar.
Unfortunately, the book ends unexpectedly - there is no conclusion, conclusions or results. On the last page there is a man in a raincoat and a hat with a sword in his hands. This drawing - the graphic "stamp" of the author, his identification mark - reminded me of the signature in the "living" letters (on the notebook sheet) that we wrote earlier. BC. The era of digital technology.
Who is Gene Zelazny?

The inadequacy of the book made me go after this man with a sword and make several more discoveries.
His personal website says that he has been working as a visual communications director at McKinsey & Company (a consulting firm since 1926!), Giving lectures and trainings at leading business schools in America and Europe. His books: Say It With Charts, Say It With Presentations, now work on Say It With Imagination.

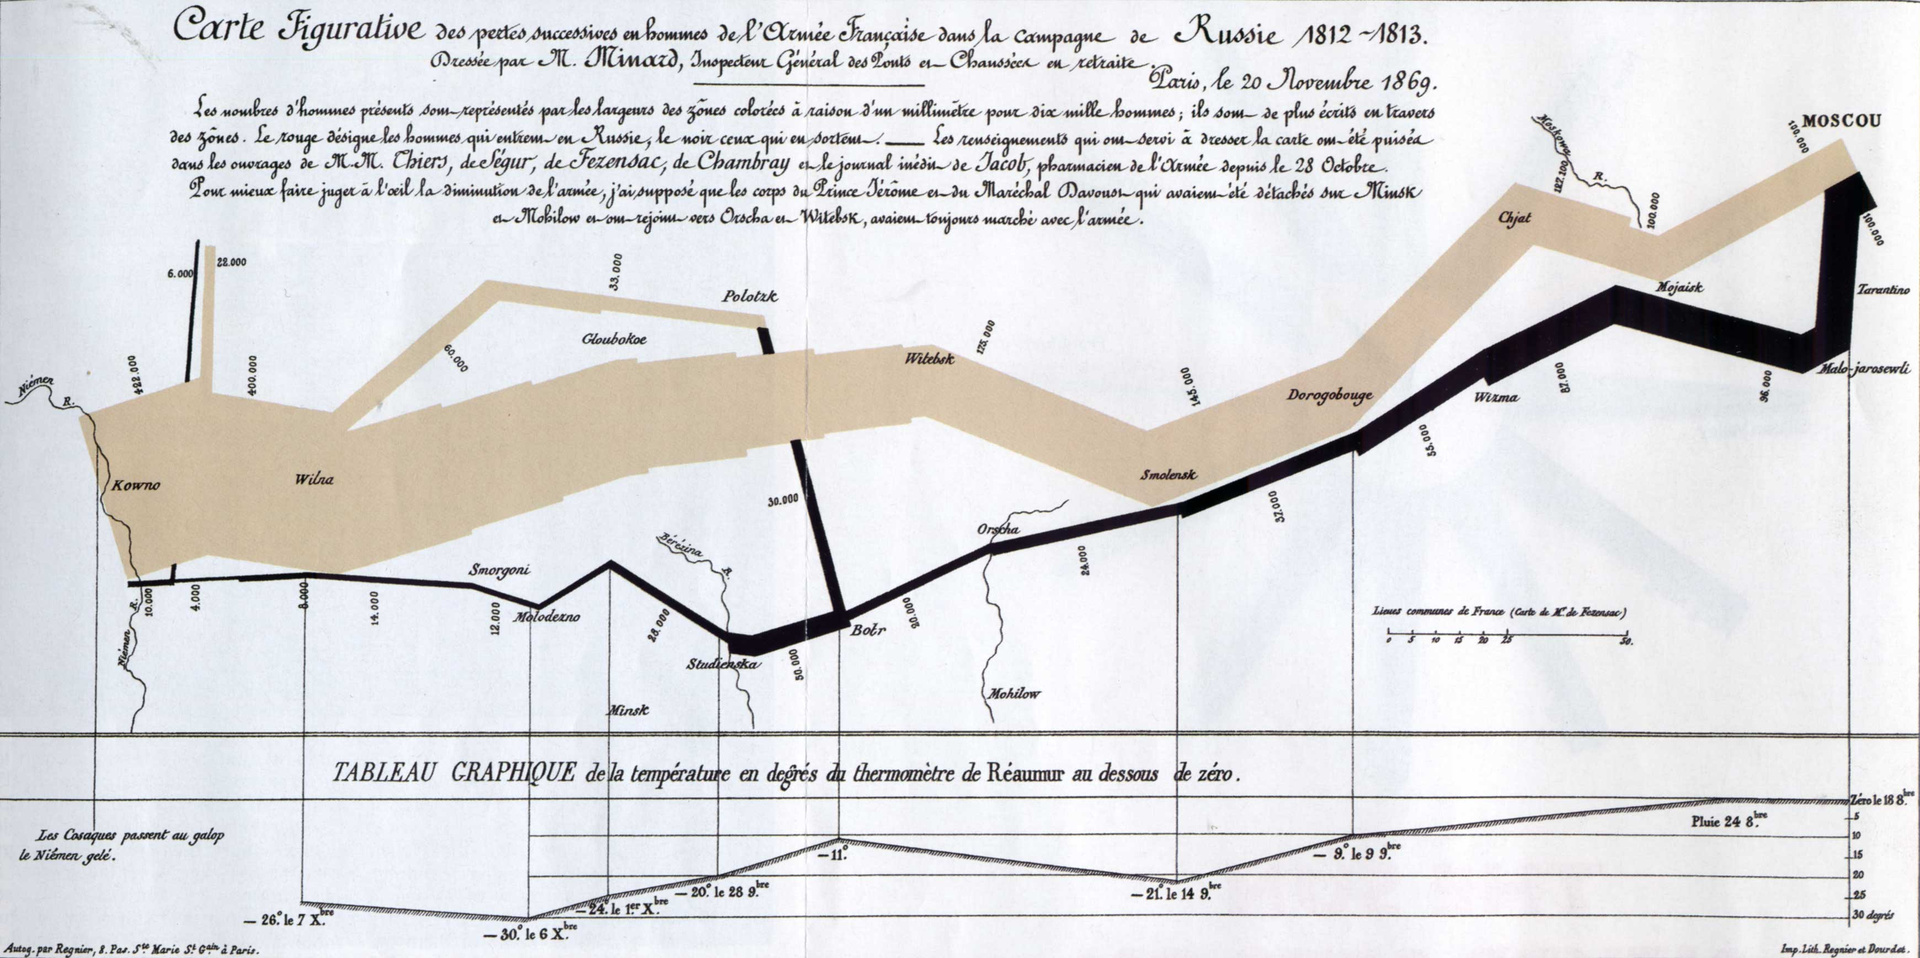
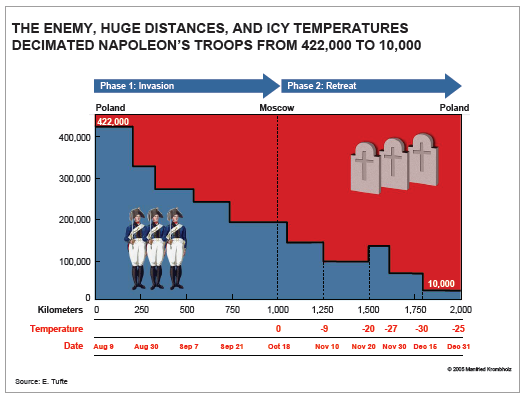
It is interesting to contrast the views of J. Zelazny and Edward Tufti . Zelazny protects PowerPoint and proves that the tool can be very useful in visual communication. He's writing:
“I think you all know about the heated debates of business communication experts around PowerPoint. Probably, there is no other such software around which there would be so much emotion. Sometimes it even seems that opponents will shoot each other with bullet points (bullet points - “bullet points”). Louder than all, of course, "shots" of critics. One of the main, a professor at Yale University, Edward Tufti, argues that PowerPoint provokes people to create vulgar, trivial content and strongly “litters” serious communication. “Meetings should focus on short written reports on paper, not abstracts or scraps of the list projected onto the wall,” said Taffee in his work Cognitive PowerPoint.Further, Zelazny proves the use of the most popular program for creating presentations, citing his version of the visualization of Napoleon’s map of the campaign against Moscow (Charles Joseph Minard (1781–1840)) - the very map that Taft calls one of the best examples of information graphics made in PowerPoint.
Zelazny does not insist on the exceptional benefits of PowerPoint, but he says that high-quality, evidence-based infodesign can be done with even the simplest tools.
He has a memoir book In an Moment ( In The Moment ), in which he shares episodes of his life.
Introduction to the book:
“If you were an eight-year-old child and saw that the Nazis were taking your friends somewhere, then you would think that Paris is a bad place to be in 1942. If you wore the Star of David, it was so. The transition from a tormented Europe to a vibrant, quivering America was also not always perceived easily. School in the Bronx (in the street style of "Da Bronx"), college, service in the Air Force and, finally, corporate America - the world of big business. Big steps and no mother who could lead you. To begin with, Jeannot became Gene, the author of these sparkling, revealing, insolent, subtle, wise, sharp, tolerant, curious, brilliant, sad and funny, cunning and straightforward essays without boundaries. Jin, we are ready to have fun and be surprised at all that you have to say, and always admire your ideas. ”
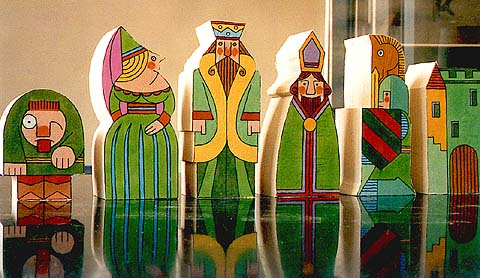
Gene Zelazny - visual in all spheres of life and manifestations. In addition to his famous books, a confirmation of this is his hobby - collecting unusual sets of chess pieces. He has dozens of chess sets of unexpected shapes.
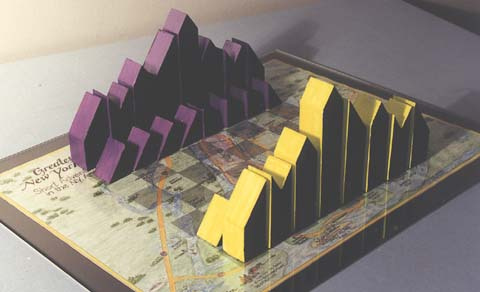
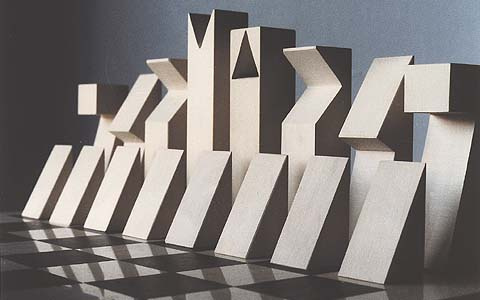
In this hobby, his love of geometric forms, admiration for lines, observation and humor are obvious - all that is characteristic of a true artist and creator.
Source: https://habr.com/ru/post/330630/
All Articles