XoruX - free monitoring of virtual infrastructure, data storage and transmission systems
 =
=  +
+ 
Due to the nature of my activities in conducting an audit, I often encounter various monitoring systems with our customers. In addition to the well-known Zabbix, Nagios, Cacti and others, there are sometimes quite interesting specimens. Today I would like to talk about one of these cases - the free monitoring system of the virtual infrastructure from the company XoruX. Mention of this company and its products was not found on the Habré, so I decided to correct this situation. Interested please under the cat.
XORUX
XoruX sro is a Czech company that develops 2 GPLv3 licensed tools for monitoring virtual infrastructure:
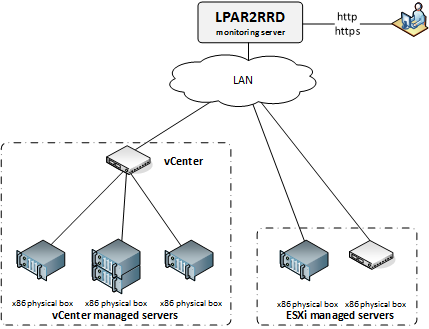
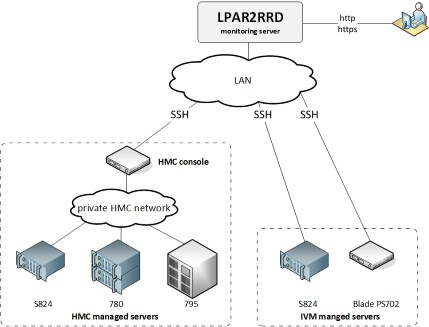
- LPAR2RRD - monitoring server infrastructure for VMware and IBM Power Systems.
- STOR2RRD - storage systems monitoring from EMC², IBM, HP, Hitachi, NetApp and Lenovo, as well as Cisco SAN switches, Brocade and others based on them.
XoruX sro also offers several levels of paid support and SaaS version of its products.
You can download and deploy on your XoruX site as a tar archive or image for VMware, Hyper-V, Docker. The current XoruX-2.01 image is based on CentOS 7.3 and contains LPAR2RRD version 5.01 and STOR2RRD version 2.01. Resource requirements are not high: 1vCPU, 3GB vRAM, 50GB vHDD.
')
Before deploying on your site, both tools can be viewed on demo-sites: LPAR2RRD and STOR2RRD .
LPAR2RRD
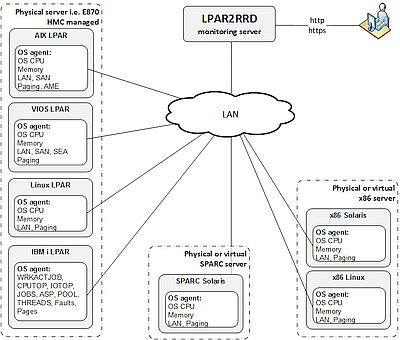
It supports both “agent less” monitoring of VMware and IBM Power Systems, as well as monitoring through agents for systems such as AIX & Linux, IBM i (AS / 400), Solaris.
How it works
VMware agent less
IBM Power Systems agent less
OS agent
The system is extremely easy to set up. All you need is to download the archive from the VMware vSphere Perl SDK (not distributed as part of the VM image), set the credentials for connecting to the ESXi host or VCenter server (in the case of VMware), test the “Test” connection and start the “run data” data collection. load ":
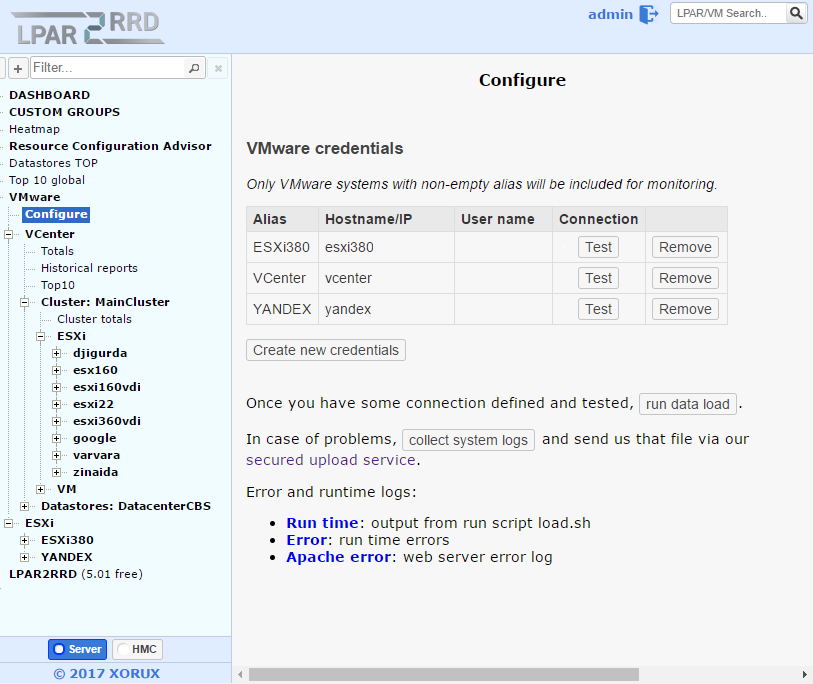
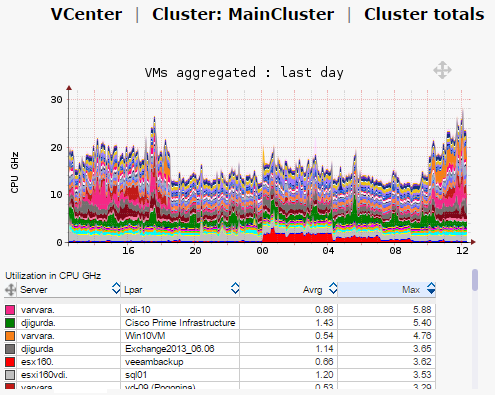
The system will do the rest. You just have to enjoy the charts: last day, last week, last month, last year and trend (1 month, 3 month, 1 year) in all main sections of vCenter / Cluster / ESXi / VM memory, processor, disk, network, etc. .
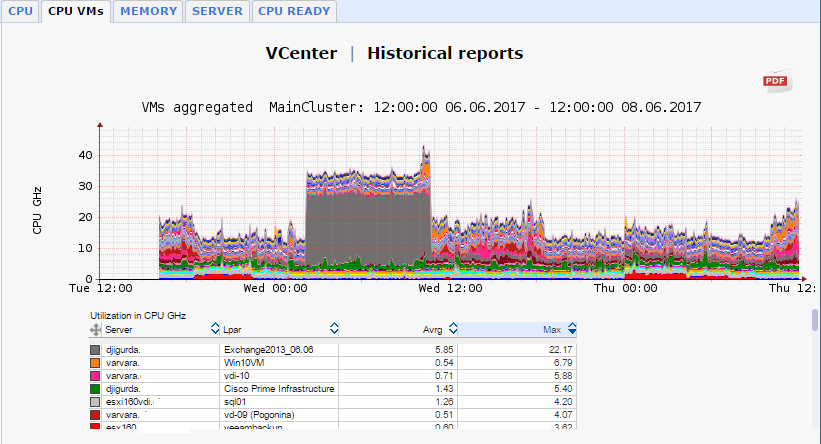
Historical reports with the ability to export reports are also available:
There is such a very handy thing as Heatmap - an overview of what is happening in the infrastructure as a whole. The map is interactive and when you hover on any square, a hint is displayed to which virtual machine and for which server it belongs.

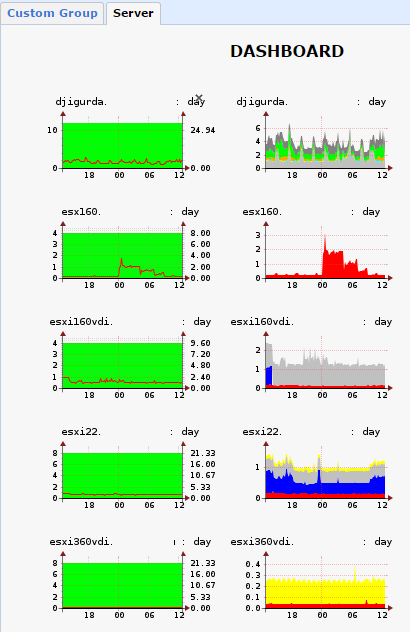
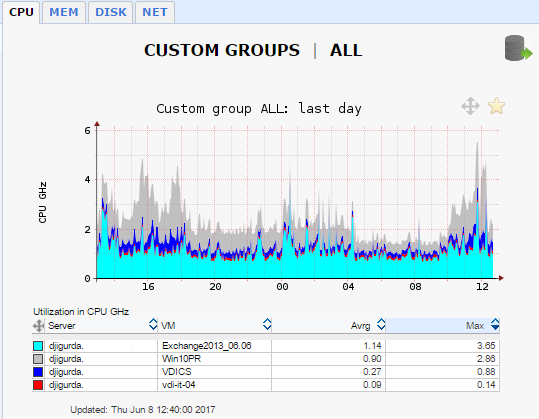
And there is also a Dashboard with Custom Groups for convenient grouping:
Dashboard

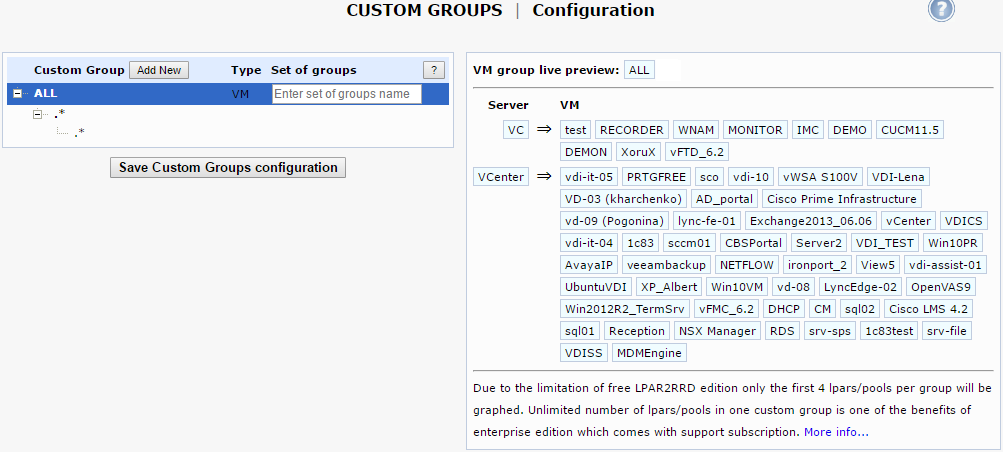
Custom Groups
STOR2RRD
How it works

List of supported storage systems
Netapp
Ibm
Other Vendors
Hitachi
HPE
EMC²
At the development stage:
- NetApp FAS / AFF (Clustered Data OnTAP (CDOT))
- NetApp FAS (OnTAP 7-mode)
- NetApp E / EF-series
Ibm
- IBM System Storage DS8000, DS6800
- Ibm flashsystem
- IBM Storwize family (V7000, V5000 and V3700)
- IBM Spectrum Virtualize (SVC)
- IBM XIV Storage System
- IBM DS3xxx, 4xxx, 5xxx
- IBM DCS3700
Other Vendors
- Dell PowerVault MD3000
- Lenovo Storwize
- Lenovo S2200 / S3200
- LSI / Engenio based storages
- DotHill AssuredSAN
Hitachi
- Hitachi Data Systems VSP G
- Hitachi Data Systems VSP F
- Hitachi Data Systems HUS-VM
- Hitachi Data Systems VSP
- Hitachi Data Systems HUS
- Hitachi Data Systems AMS
HPE
- HPE StorageWorks XP7
- HPE StoreServ 3PAR
- HPE MSA2000 / P2000
EMC²
- EMC² VMAX
- EMC² Unity
- EMC² VNX
- EMC² VNX file
- EMC² VNXe
At the development stage:
- EMC² VPLEX
- Dell SC Series (formerly Compellent)
- Huawei OceanStor
Supported SAN Devices
Storages are configured by editing the configuration file /home/stor2rrd/stor2rrd/etc/storage-list.cfg (examples are in the file and on the website), do not forget to encrypt the password through perl ./bin/spasswd.pl .
After some time, when the interface is updated (Ctrl + F5) on the DASHBOARD, you will see the added storage.
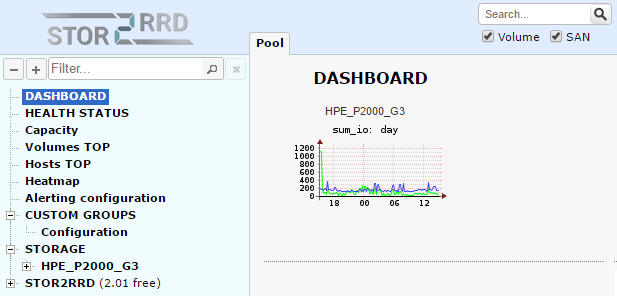
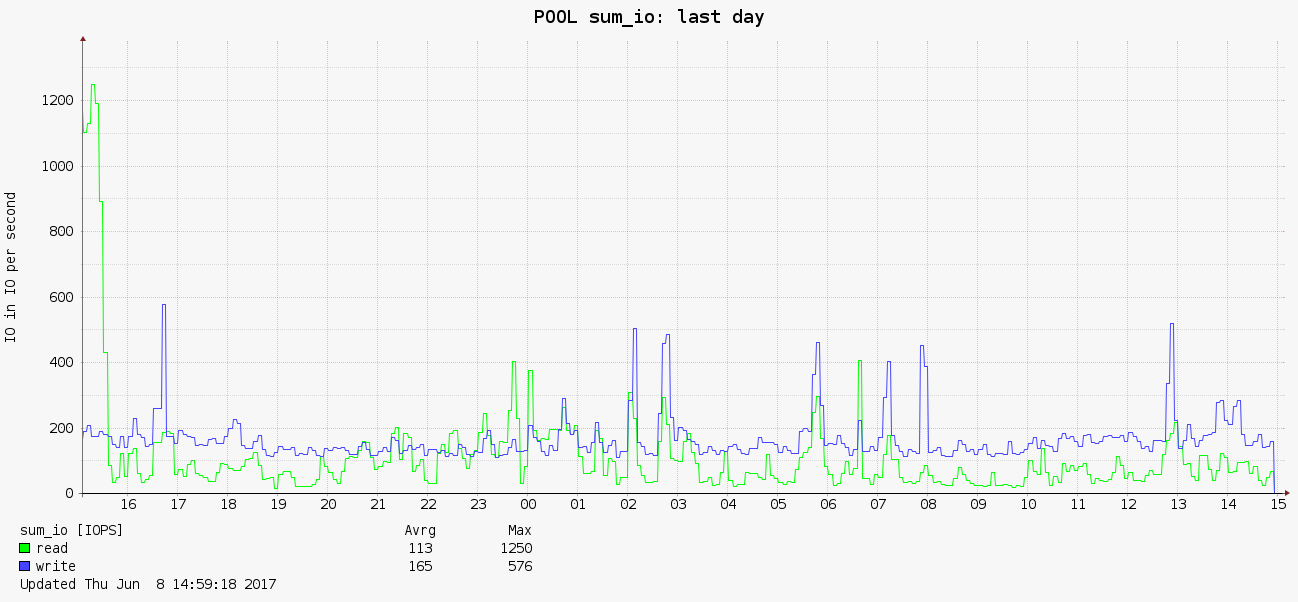
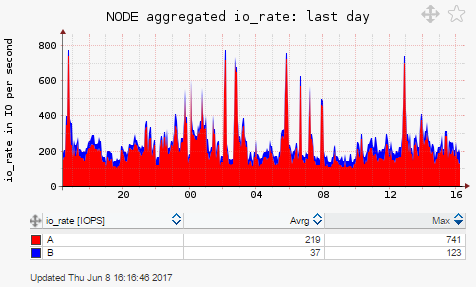
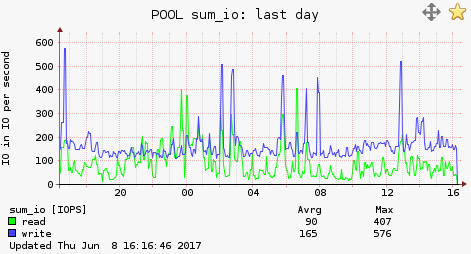
When you click a graph opens POOL sum_io last day .
The following items in the top menu: their status, capacity, etc.
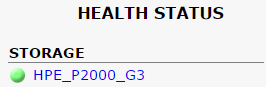
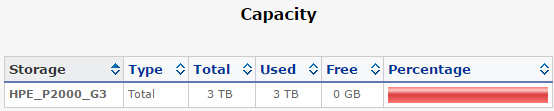
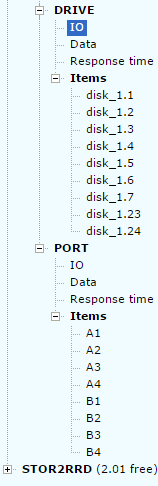
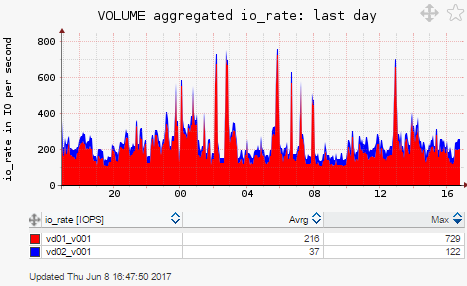
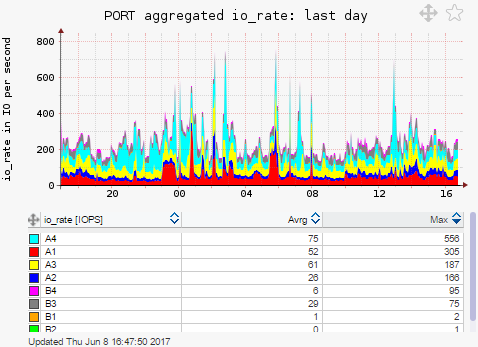
Below, in the STORAGE section, for each added storage system there are various sections of their vital activity.
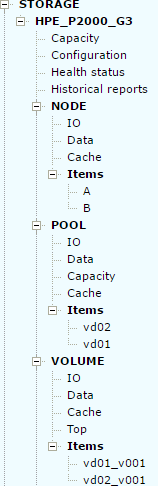

In general, the interface is the same as LPAR2RRD - the same Dashboard , Custom Groups, etc. Also there is the ability to customize notifications when exceeding any parameters of peak values.
findings
According to the statements on the site , XoruX sro is a partner of such companies as IBM, NetApp, EMC², Hitachi, VMware, Microsoft. The list of clients is quite large. Among resellers there is also Russian SoftLine. The presence of paid support indicates the possibility of using the product in Enterprise. By the way, and without acquiring paid subscriptions, support normally answers questions by mail and helps with setting up. Over the past couple of months, several updates have been released, indicating that the project’s vitality and development.
In my opinion a great free tool. It is configured quickly and easily, there is everything you need.
Source: https://habr.com/ru/post/330426/
All Articles