Memory leaks in Android and how to localize them

On one of the projects faced with memory leaks. Used the first rule of developers - google it. To my deep disappointment, I found many articles for programmers and quite a bit for testers. Most publications are dated 2011-2014 year.
Below is information about memory leaks that will come in handy in 2017. I'll tell you what their presence threatens the application, and list several approaches to localization.
How memory leaks can affect an application
In the application, many objects have a limited lifetime. After it is over, they are destroyed by the garbage collector. But if the object is accessible by a chain of links, it will not be assembled. The application allocates memory, but does not release it, it happens until the limit is exhausted and a crash happens.
')
The first bell, but rather the horn's call, when the application crashes with an OutOfMemoryError error. This error indicates that the application has run out of memory allocated to it.
Sometimes things are not so obvious. We had a stable and debugged music player application. It was, until the test did not build with a couple of new screens. At first, the application behaved as usual, but after ten minutes it began to slow down. Sometimes it hung or closed without alerts. There were crashes in the native "pieces", for example GLRenderer.
Why should a tester know how to locate leaks
If you tell the developer that the application itself is minimized, slows down or freezes, it will most likely be of little help. It will send you to locate the problem and look for exact reproduction steps. The developer hopes that your initiative will fade and you will not come to him with such nonsense anymore. But since you are a fighter for the high-quality and stable operation of the application, just do not leave it. It is necessary to localize the problem and justify to the developer its importance and criticality. Next you need to really think about the rationality and the need for a "crusade".
I divide all mobile applications into two types:
The user is in the application for less than 10 minutes
An example would be mobile applications for buying tickets, a mobile bank, an organizer. The user enters the application to achieve a specific goal.
In this case, there is no urgent need to carefully monitor leaks. Small ones will not have time to seriously affect the work of the application. A large, for example, when the screen is recreated with each entry on it, it is easy to find.
The user is in the application for more than 10 minutes
This is a story about music players and soc. networks that the user will test the strength of the clock. Along with testing, you should monitor memory leaks and stable operation of the application. Even a small leak at a session of 40 minutes can affect your work.
If the game is worth the candle, act. I'll tell you about several approaches to the localization of memory leaks.
Approaches to localization of leaks
Localize with your bare hands
If you are lucky, you will immediately find a sequence that causes leakage. Sometimes you have to suffer. Manual localization of leaks is extremely difficult. You will have to repeat the same type of action dozens of times and see if this has affected the operation of your application. I optimistically decided that I could handle it with my bare hands. Spending an indecently large amount of time, revealed a pattern. After 20 switching between tabs, the application did not work correctly. Then completely crashed. On different devices, the number of switching varied.
With this knowledge, went to the developer. After a couple of days I was told that the leak was covered and everything will fly. Attention, spoiler. So it was. Before the advent of new features and screens. Then we began to observe familiar inadequate behavior.
When trying to locate leaks only with your hands, there is no guarantee that the leak is really covered. Perhaps it simply does not play on your steps.
Tip: when localizing leaks, first check the nesting of the screens. The deeper the better. It is necessary to take into account everything: pushy, objects with pictures, animations, lists, maps with elements displayed on them, vertical and landscape orientation.
Localize with special tools
I was helped by Memory Monitor , a standard tool from the android studio package. Read more can be found on the site Android Studio User Guide .
If you are just starting to search for leaks, it is very useful to run Monkey in conjunction with Memory Monitor. The program is perfect for stress testing. It randomly moves through the application and generates user events: tap, click, gesture. More detail also on the Android Studio User Guide .
These two tools will help you understand if you have leaks in your application. While the monkey moves around the application, you are watching the graph on the screen. The application requires a certain amount of memory, which is constantly used. He should keep about the same level. Moving through the application monkey gradually clogs the memory. After calling the garbage collector, it should return to its original value. If after the collector the memory is not cleared, it means a leak.
To search for the steps of play the monkey is no longer suitable. You need to manually and consciously navigate through the application, watching the monitor.
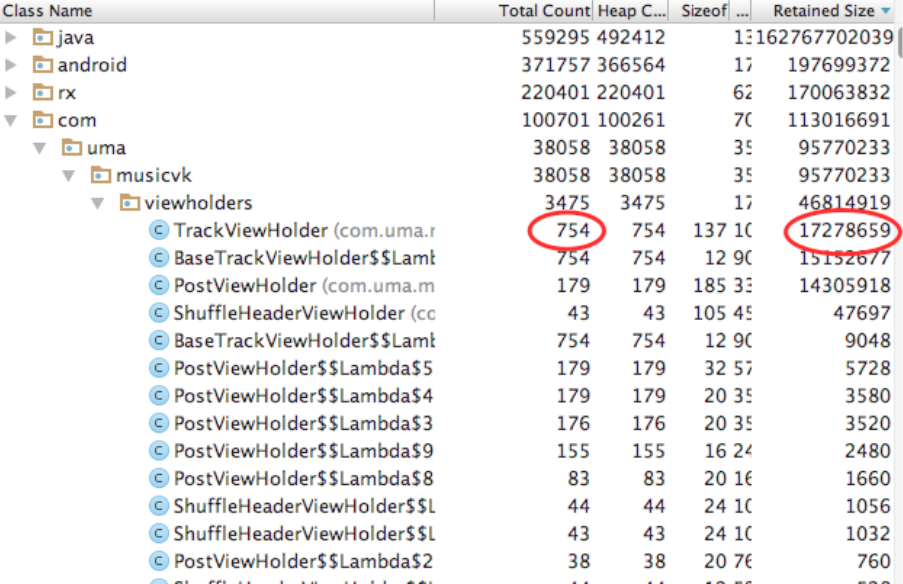
The new build did not dare to test with bare hands. Launched Memory Monitor, opened the application and watched. Found a pattern. All tracks displayed on the screen with a list of songs hung in memory when moving to the next screen. I collected a heap dump and sent it to the developer. It turns out that the RecyclerView onViewDetachedFromWindow method for the cell was called when the track cell disappeared from the screen after scrolling, but was not called when the screen was closed during the onDestroyView call. And it was there that we were unsubscribing from changing the states of the cells of the tracks. Therefore, there were links to all lists after closing the screen.
Now in the application 22 screens. Almost every track you can go to the album screen. From release to release, the problem with leaks only worsened until it resulted in my investigation. Only then did we really cover up memory leaks.
Tip: when starting Memory Monitor, pause the other monitors, they can interfere with each other. Call the garbage collector before dumping the heap to the developer.
Write in the comments how to fight leaks.
Source: https://habr.com/ru/post/330284/
All Articles