Check Point Security CheckUP - R80.10. Part 3
The third and final part concerns the possibility of conducting a free network security audit using Check Point Security CheckUP . If you missed the last parts:
Having finished the installation and initialization, we can proceed to the setting itself. Next will follow a large number of pictures. If you are too lazy to read, then you can subscribe to our YouTube channel , where soon a video instruction on CheckUP will appear.
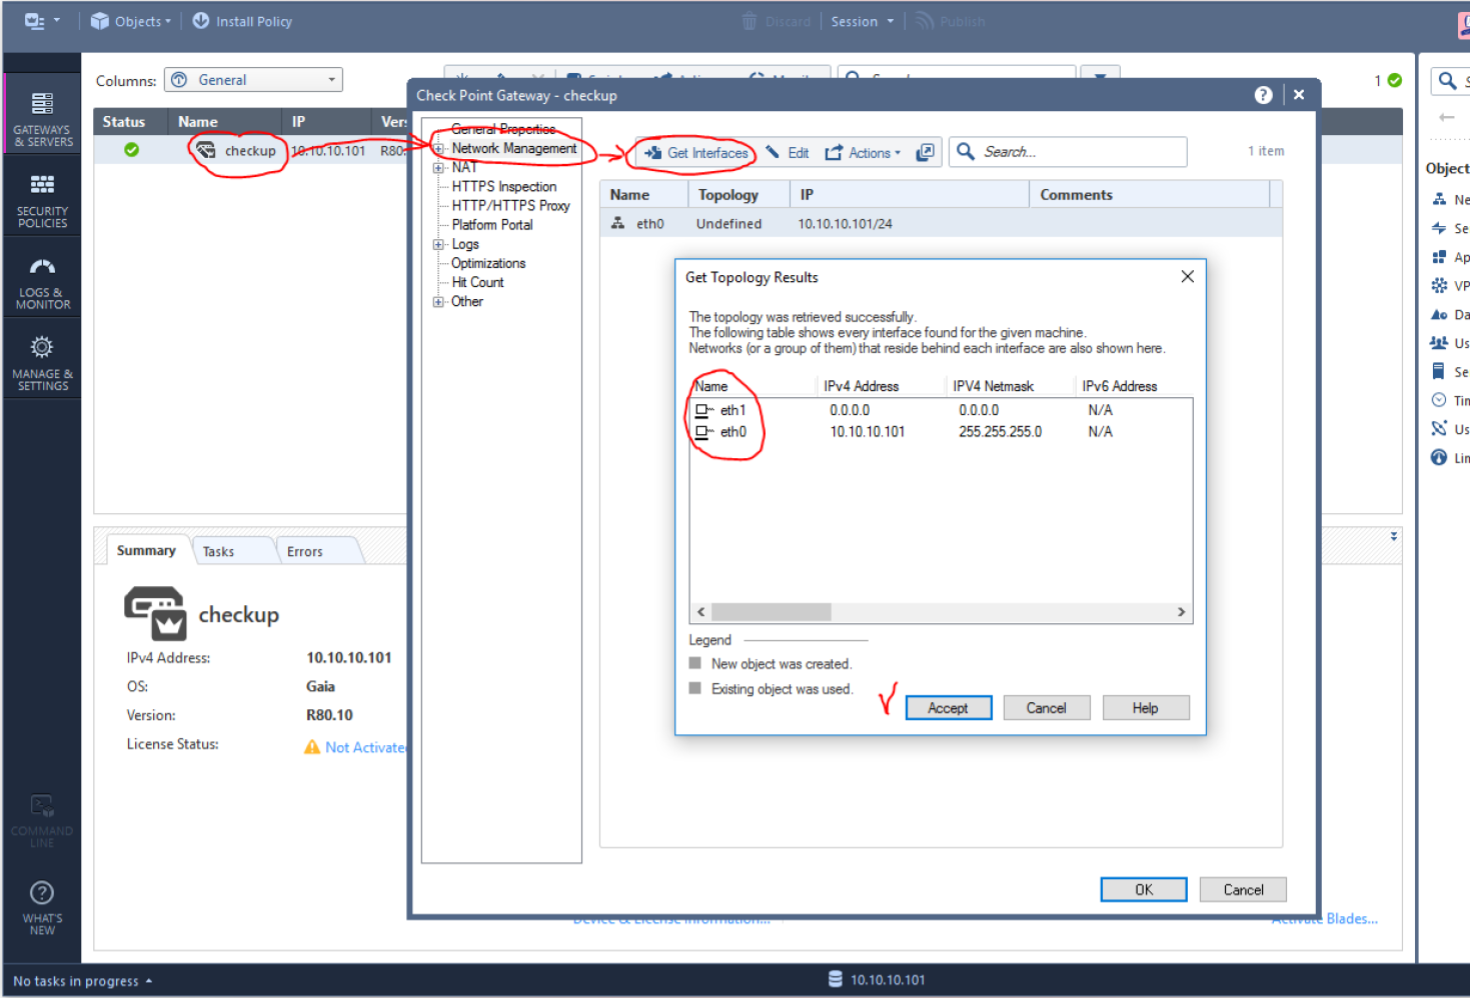
The first step is to correct the network topology, as shown in the figure below. We should have two interfaces.
')
Next, we must define the first interface (which is used to control and access the Internet) as Internal, enable anti-spoofing in detect mode and disable logging (so as not to litter the report):

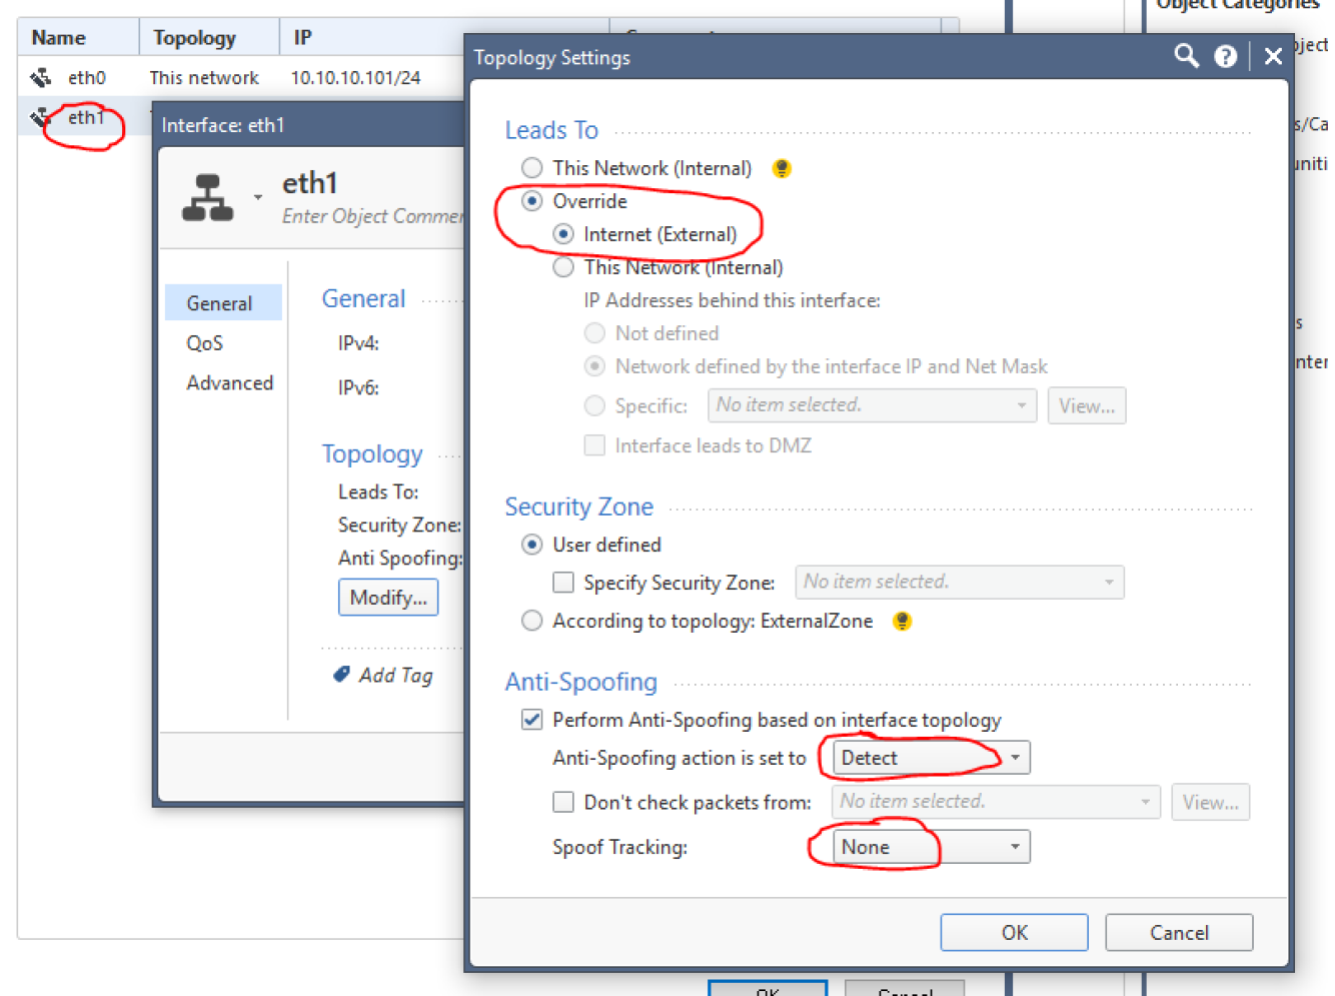
The second interface, we necessarily define as External with the same anti-spoof settings.
The result should be the following:

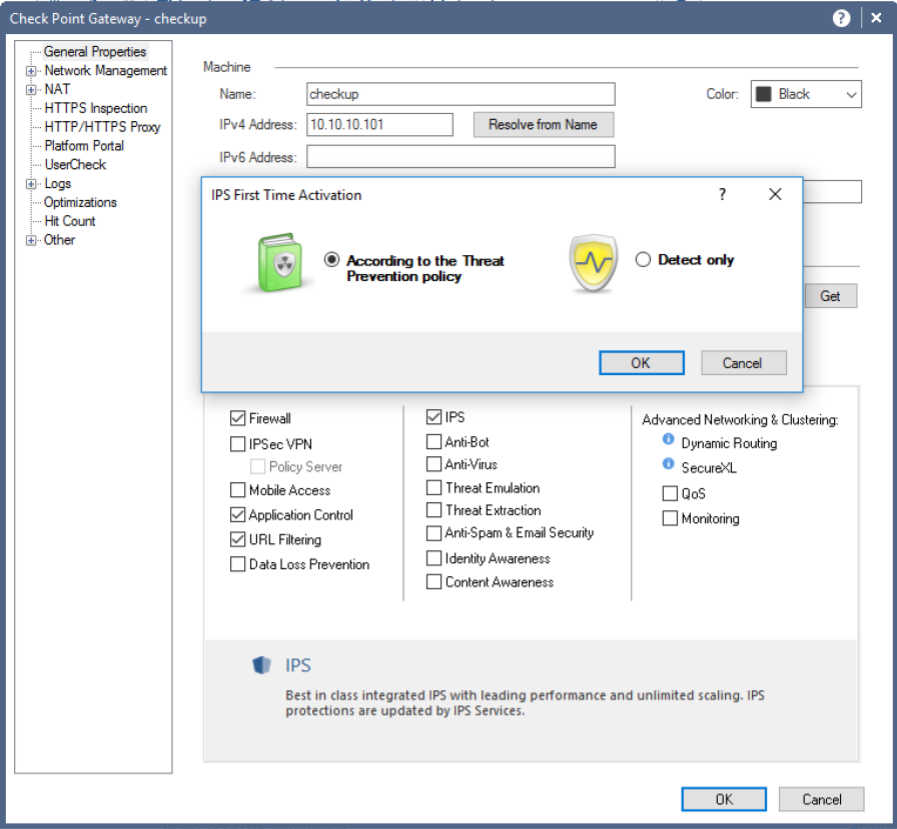
Now you can proceed to the inclusion of blades. To do this, double-click to open the gateway properties and start ticking the necessary blades (Application Control, URL Filtering, IPS ...):
If you try to turn on Threat Emulation
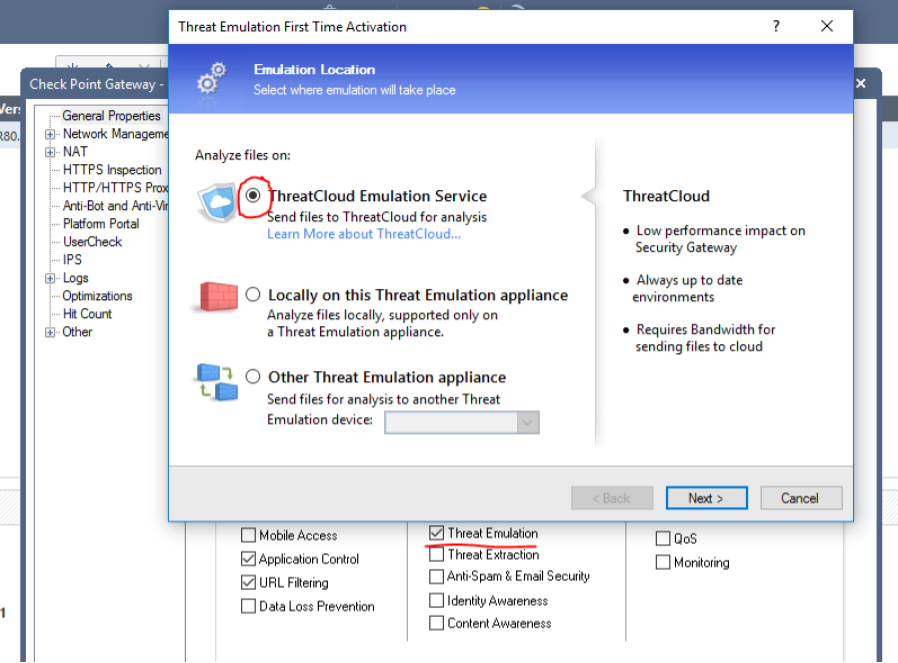
then you find an error:
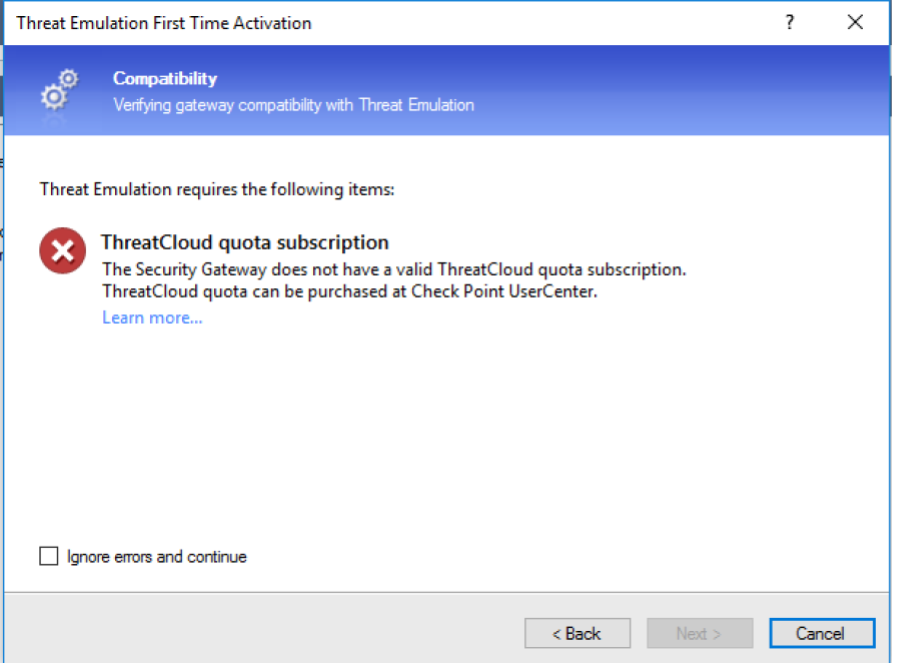
Unfortunately, the Trial mode for 15 days does not include the cloud sandbox function (Threat Emulation). If this feature is very necessary, then you can request a demo license for a month.
To identify users (username, and ip-addresses), you need to configure integration with AD using the Identity Awareness blade
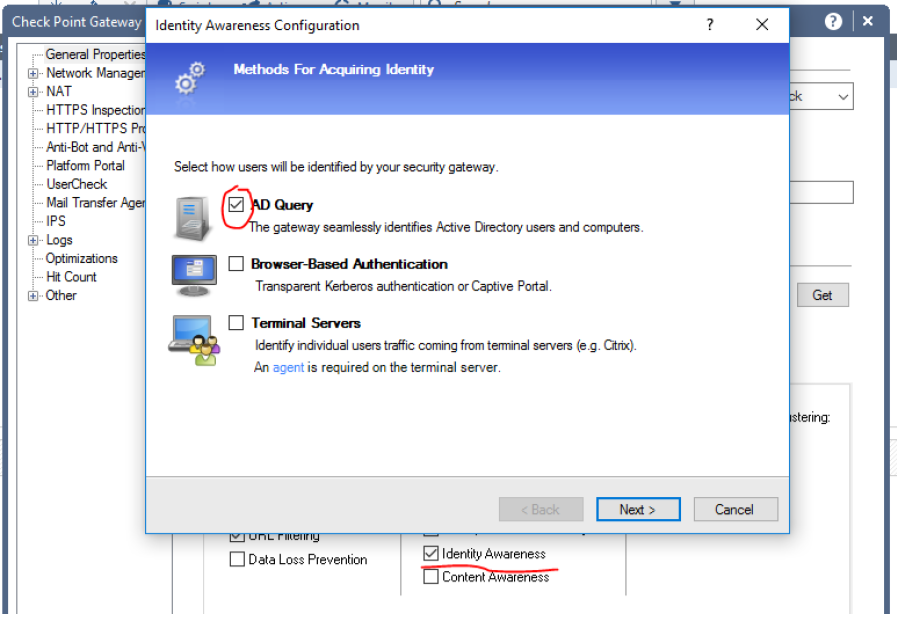
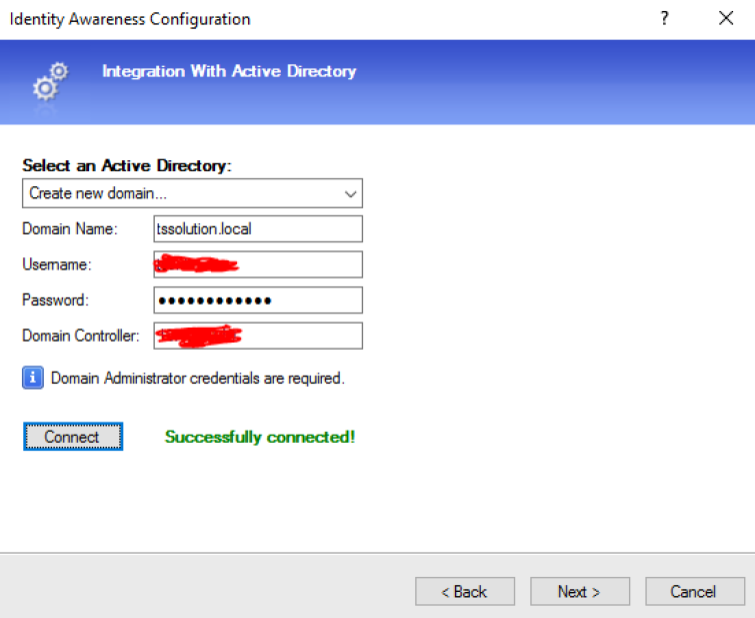
For this account is used with admin rights. In fact, Check Point connects to the AD server and retrieves logs related to user authentication, after which it can match the user and his ip-address. Specifying the domain, credentials and ip-address of the AD server, we must successfully connect:
By enabling the required firewall blades (Network Security), we can go to the Management tab and enable the Smart Event blade:

It is this blade that allows you to generate comprehensive reports.
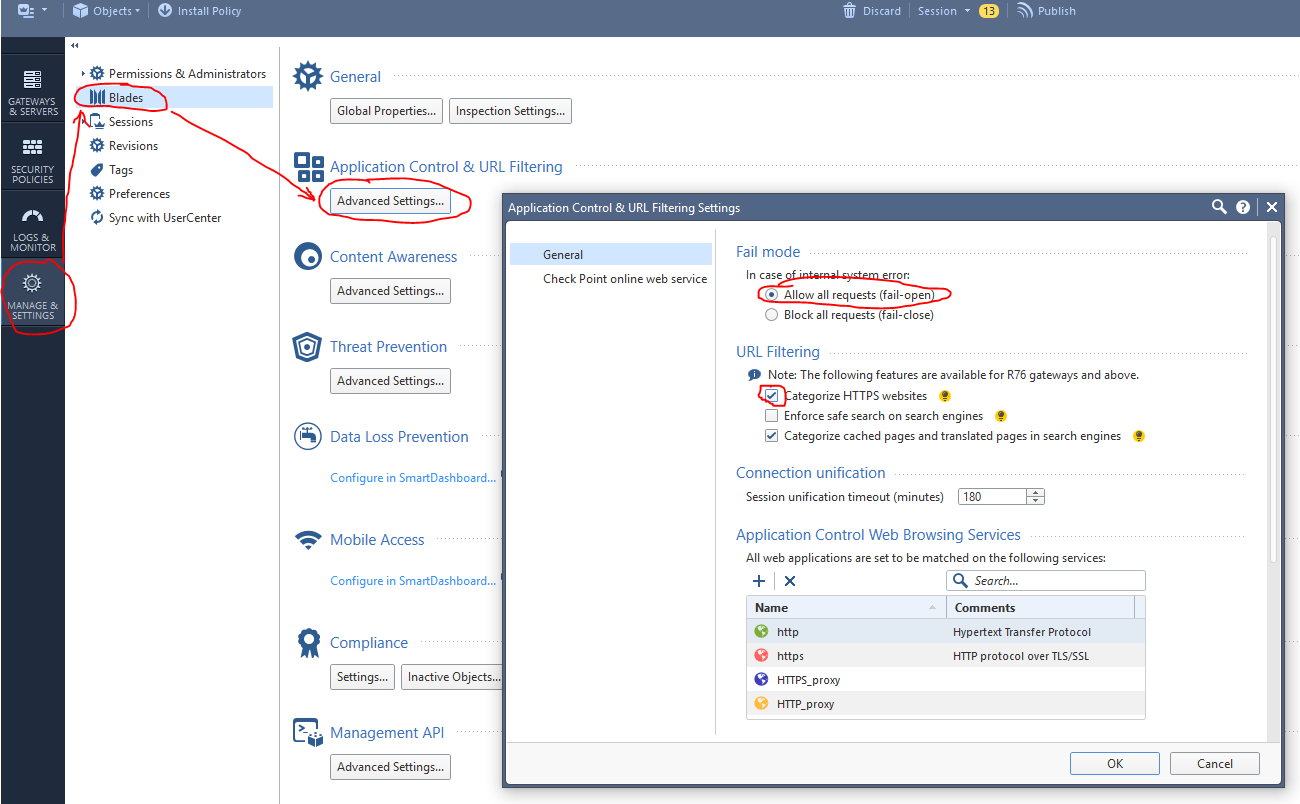
After that, do not forget to click Ok, and not just close the window. Now you can go to the settings of some blades. Let's start with the Application Control. Specify the settings in accordance with the picture below:
Do the same for the Threat Prevention blade:

Now you can go to the settings policy. Let's start with the usual firewall. Naturally allow all traffic and turn off logging. These logs are absolutely not interesting in the report and only increase the load on the device during their processing:

Now Application Control and URL filtering. By default, this policy is absent (unlike R77.30) and in order to fix this, you must first enable them. This is done as follows:

Add a new layer:
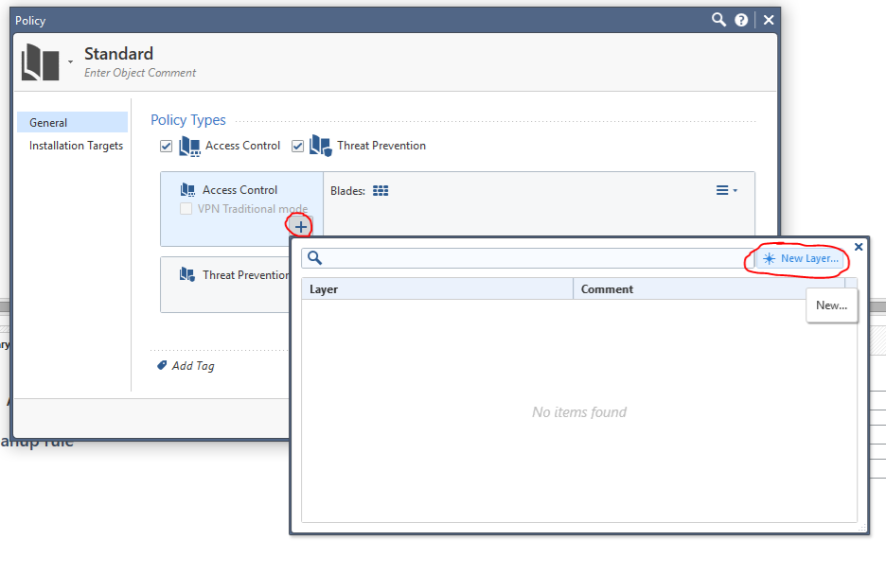
with the name Apllication and mark only one blade:

You should have the following:

Now Application has appeared in the policies. Allow all traffic:

And be sure to include Detaild Log and Accounting:

Then we can try to update the database:
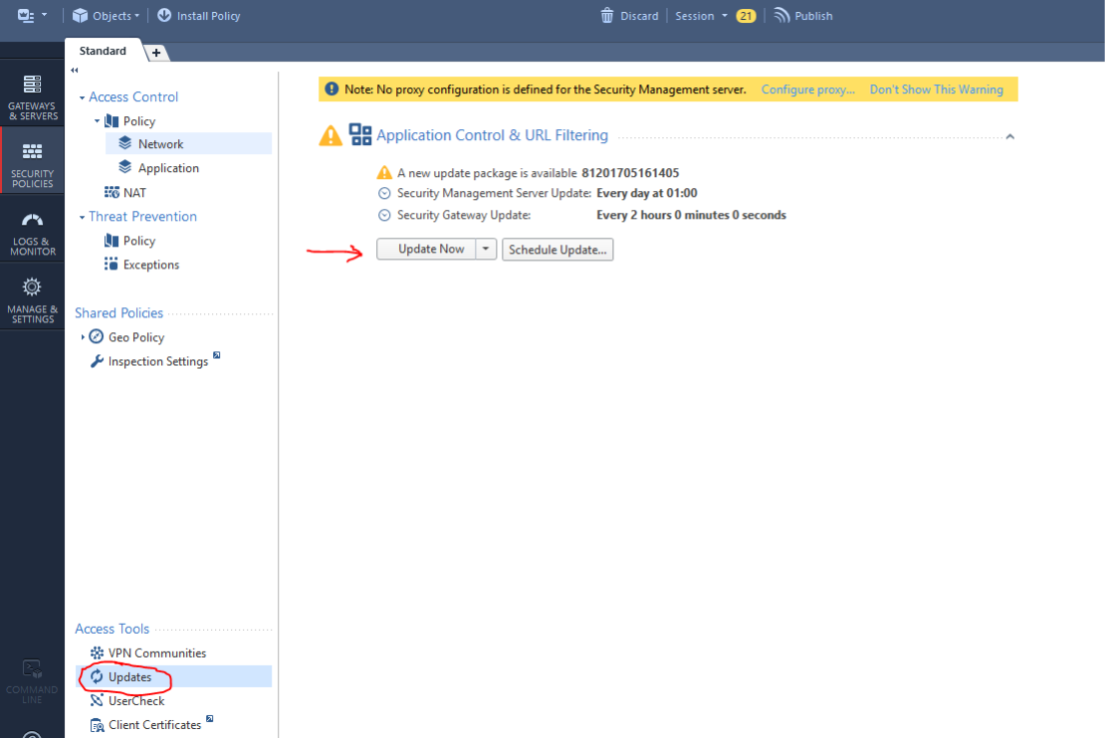
The update process will be displayed in the lower left corner. Wait for it to finish:

Now you can go to the settings for the Threat Prevention policy. The default policy is set with the Optimized profile:

It is necessary to correct the settings. Double-click to open the profile properties and set everything to Detect mode (there is no point in Prevent on a copy of the traffic):

In the settings of Ativirus we enable “deep” scanning and checking archives:

In the Threat Emulation settings (if you received a license), we enable emulation for all supported files:

When you click Ok, we will be offered to save the profile under a new name:

After saving, we set it in the policies of Threat Prevention (right click on the profile):

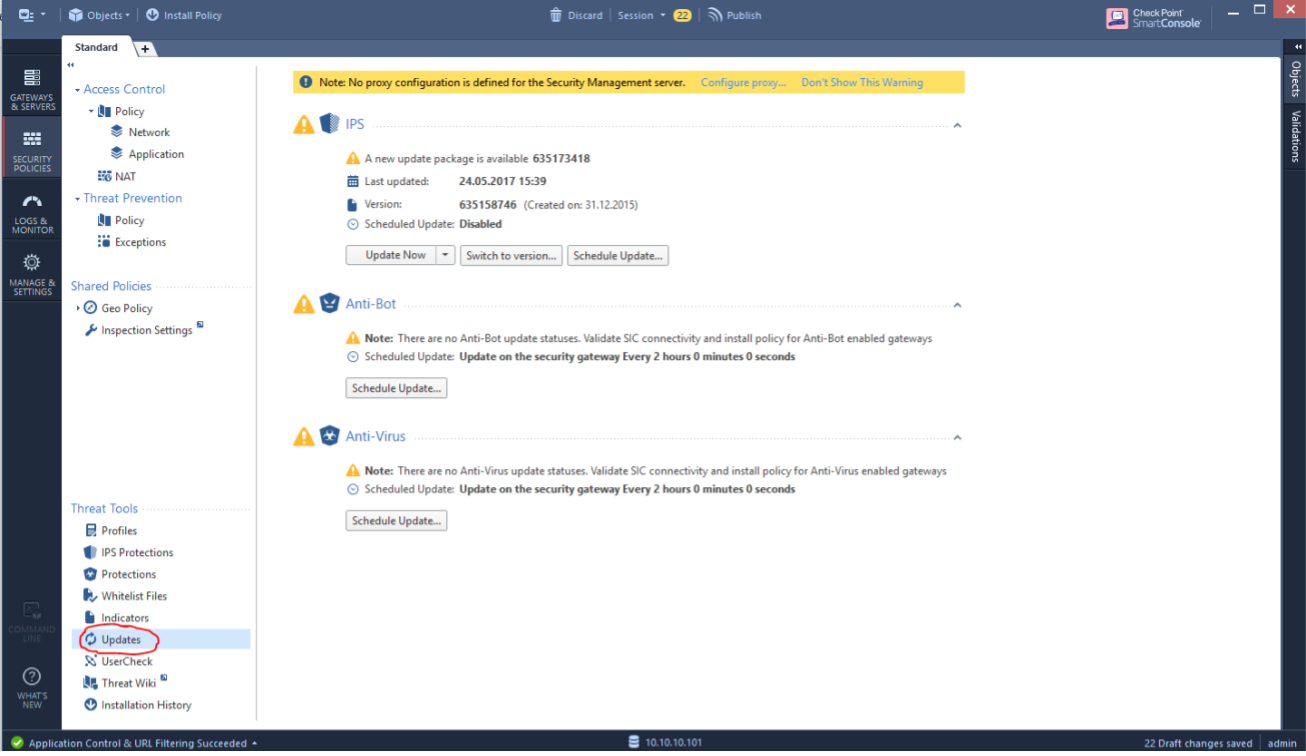
Now you can go to the Updates section and try to update IPS and other blades:
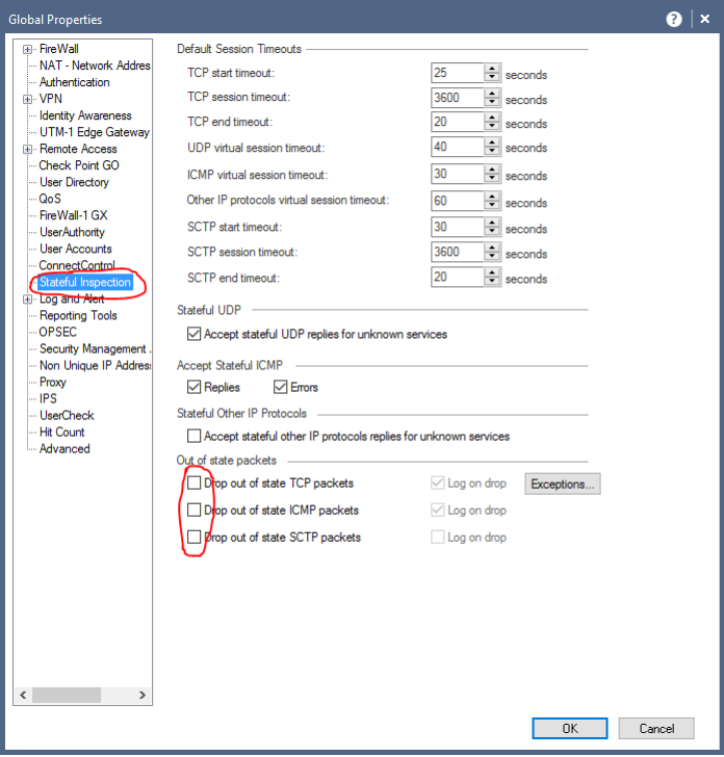
In addition, you need to go to the global properties Check Point:
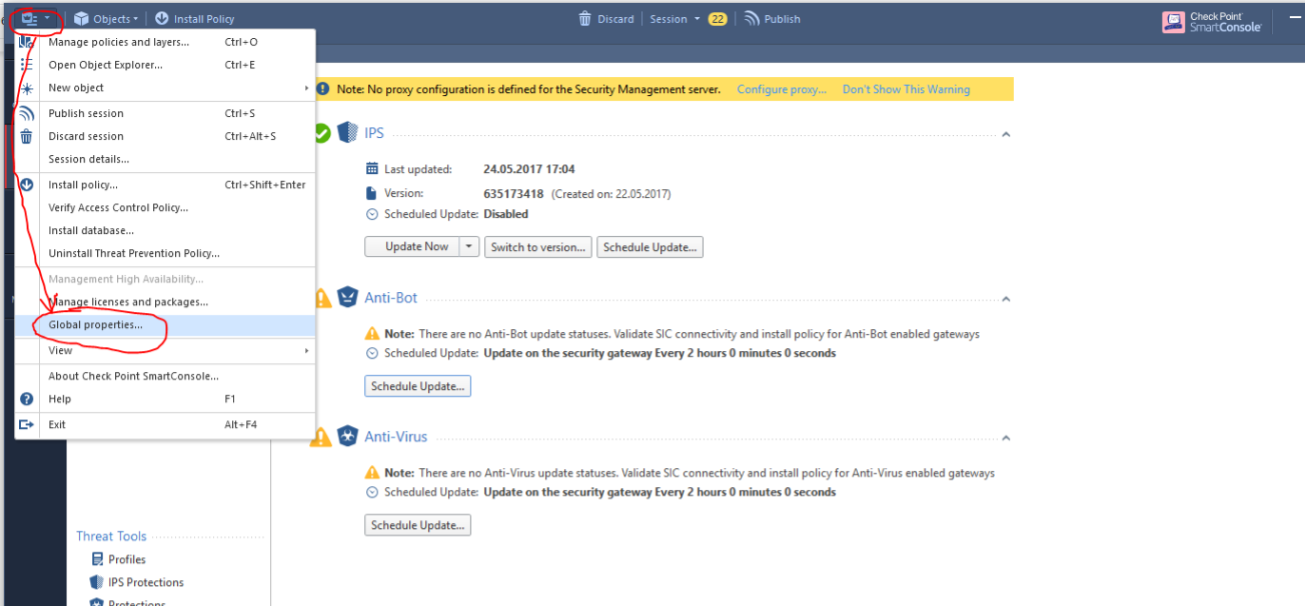
And disable the Drop-s, as in the picture below:
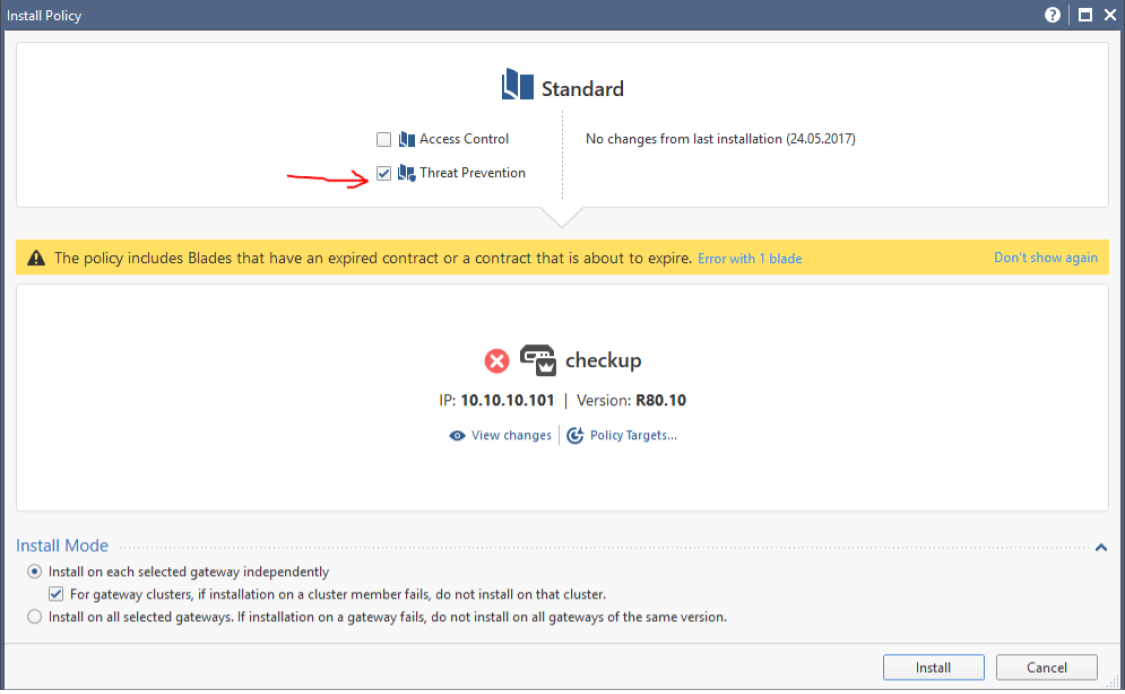
Now you need to install the policy. Click Install Policy:

First, we mark only Access Control (Threat Prevention will not be installed without this policy):

After successful installation, click Install Policy again and select only Threat Prevention:
Done! If you have correctly configured the SPAN port, then Check Point should already start processing traffic. To verify this, you can go to the Logs & Monitor tab and filter logs, for example, by Apllication Control Blade:

If everything is good, then leave the logging for at least one day, after which you can see the statistics by clicking on New Tab - Reports - Security CheckUP Advanced

You should have the following:

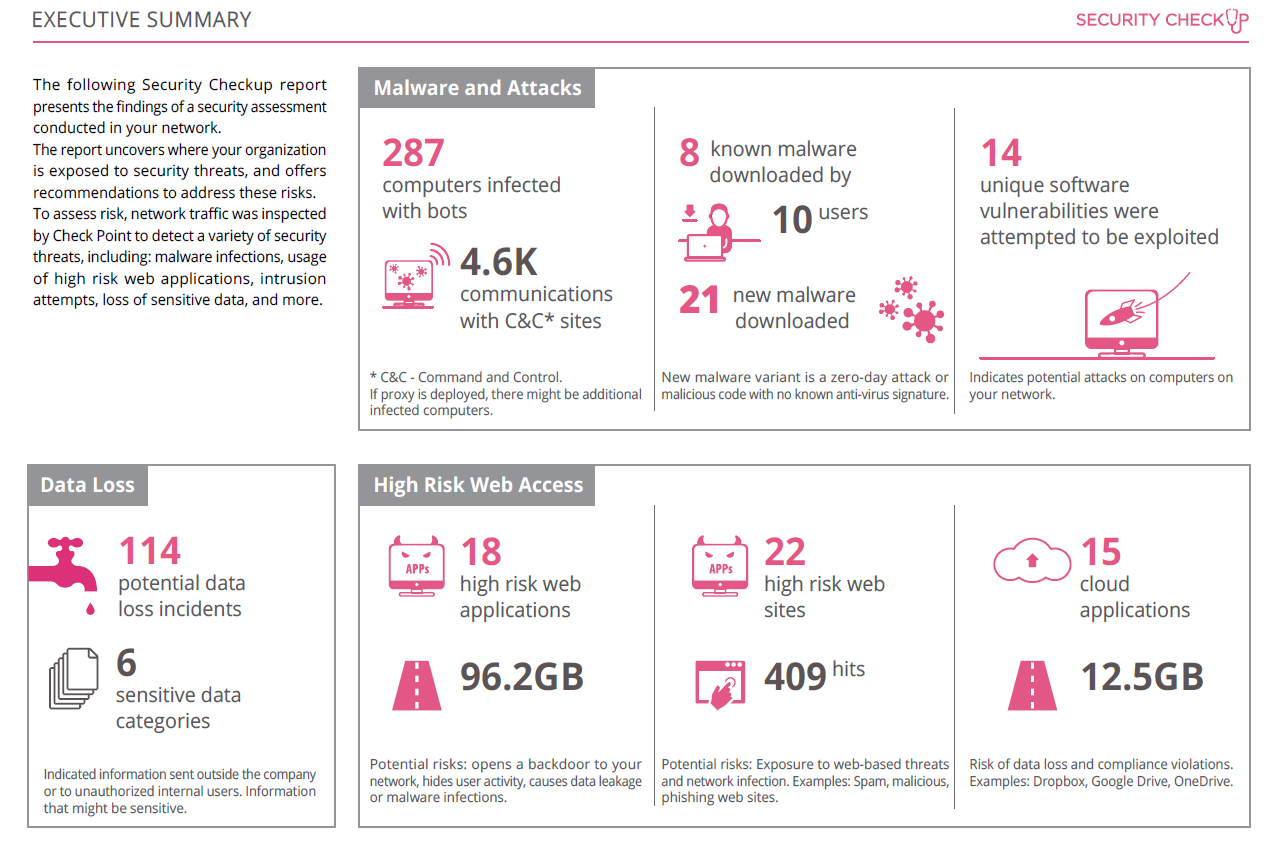
This report can be downloaded in PDF format, while it is possible to make the report anonymous, i.e. exclude parameters by which you can identify your organization.
The desired time to collect statistics is two weeks. An example of the report can be found here .
This is the "simple" way to carry out an express analysis of the security of your network. We sincerely hope that this information will be useful to someone. If you have any questions, feel free to contact us . I repeat, in the near future video instruction will be posted on our channel .
Source: https://habr.com/ru/post/330074/
All Articles