Oracle SystemTap
This year, within the framework of PG Day'17 Russia, there will be a two-day stream of reports on Oracl DB: Yaroslav Kiselev will talk about monitoring and diagnosing application performance from an Oracle DB perspective , Nikolai Kudinov will do a technical education on minimizing expectations log Alexander Khalukhin from Deutsche Bank is preparing an intensive master class on diagnosing the performance of the Oracle Database . For a complete list of performances, see our website !
For specialists interested in commercial databases, we prepared translation of publications from database specialists from CERN. Today's material opens a cycle of several articles on tracing and debugging the performance of Oracle DB using SystemTap.
')
This article focuses on using SystemTap to troubleshoot Oracle DBMS. In particular, you will learn how to explore Oracle processes and their userspace functions. These methods will be useful and exciting for anyone interested in looking under the hood of technologies and increasing their efficiency in troubleshooting, as well as in performance research.
Introduction
Tracing userspace is a very powerful method that can be used to supplement the performance and profiling information available in Oracle, such as V $ views and the 'event 10046' trace files, as well as advanced diagnostics and study of the Oracle core. Such studies have been available for several years mainly on Solaris using DTrace (see, for example, the Tenela blog ).
Dynamic tracing tools that allow you to profile the kernel and userspace are also gaining momentum in the Linux world, thanks to recent additions to the kernel. There are several tools that provide an interface for collecting, aggregating, and outputting dynamic trace data. SystemTap is one of the most advanced, but new tools are constantly emerging, including 2 DTrace ports. To explore this topic, see Brendan Gregg ’s presentation at LinuxCon 2014.
I first learned that SystemTap can be used to trace userspace from Fritz Hoogland (Frits Hoogland), and was very impressed with the possibilities that are available for advanced troubleshooting, namely, how it can help explore Oracle workloads to tune performance and advanced diagnostics.
In addition, I was pleased to learn that the methods described in this article also work under RHEL 6.5, which is great news for me, because it means that I can start using SystemTap on many existing systems without waiting for updates to latest kernel versions.
The SystemTap documentation has additional information on the implementation of userspace probes: with Linux kernels older than version 3.5 (for example, when using RHEL 7.0, OL 7.0 or OL6.5 with UEK3) SystemTap will use the UPROBES module to trace userspace; UTRACE kernel extensions, if available. SystemTap is able to trace userspace with both UTRACE and UPROBES; other dynamic trace tools seem to work only with UPROBES and, therefore, only with later versions of Linux. As Fritz writes in the above article, you will need SystemTap 2.5 and above to trace userspace. At the time of this writing, SystemTap 2.6 has been released.
This is how you can check if the UTRACE extensions are configured:
This is how it is checked whether UPROBES are available:
Below you will find a few examples, ideas, and test code to start using userspace tracing using SystemTap in Oracle. The scripts discussed in this article can be found at this link.
Deep dive: SystemTap reads Oracle standby event interface data and X $ tables
In this section, you will learn how to connect SystemTap to the Oracle wait event interface. This makes it possible to connect two types of tools: data collected using SystemTap probes, and data from the Oracle wait event interface. So we pave the way for more complex research.
The main thing to do is to create SystemTap probe at the “right point” of the Oracle kernel and make it read the information we need.
As discussed in a previous paper on DTrace and Oracle, the Oracle kernel function kskthewt can be used for this purpose. It is called by the Oracle kernel at the end of each wait event, presumably to update the corresponding performance counters. Our first step is to create a probe, which runs after the Oracle executable file enters the kskthewt function. The next step is to get SystemTap to read the information we need. Processor and memory registers are available. Some of the registers are used to pass arguments to a function, as described in the x86 calling conventions convention . In other cases, the CPU registers may contain useful information "remaining" after calls to the parent functions. Reading directly from memory areas and, in particular, from the SGA opens the way for most Oracle instrumentation data.
Additional facts that I recently discovered in collaboration with Fritz Hoagland, helping with the creation of the probe for the Oracle kskthewt function:
If you combine all this, you can write a SystemTap script to collect and display the wait event and the required data v $ session. An example of such a script is shown in the figure. Scripts can be downloaded here as a zip file. Direct links: trace_oracle_events_11204.stp and trace_oracle_events_12102.stp . These scripts were tested on Oracle versions 11.2.0.4 on RHEL6.5 and Oracle 12.1.0.2 on OEL7, respectively.
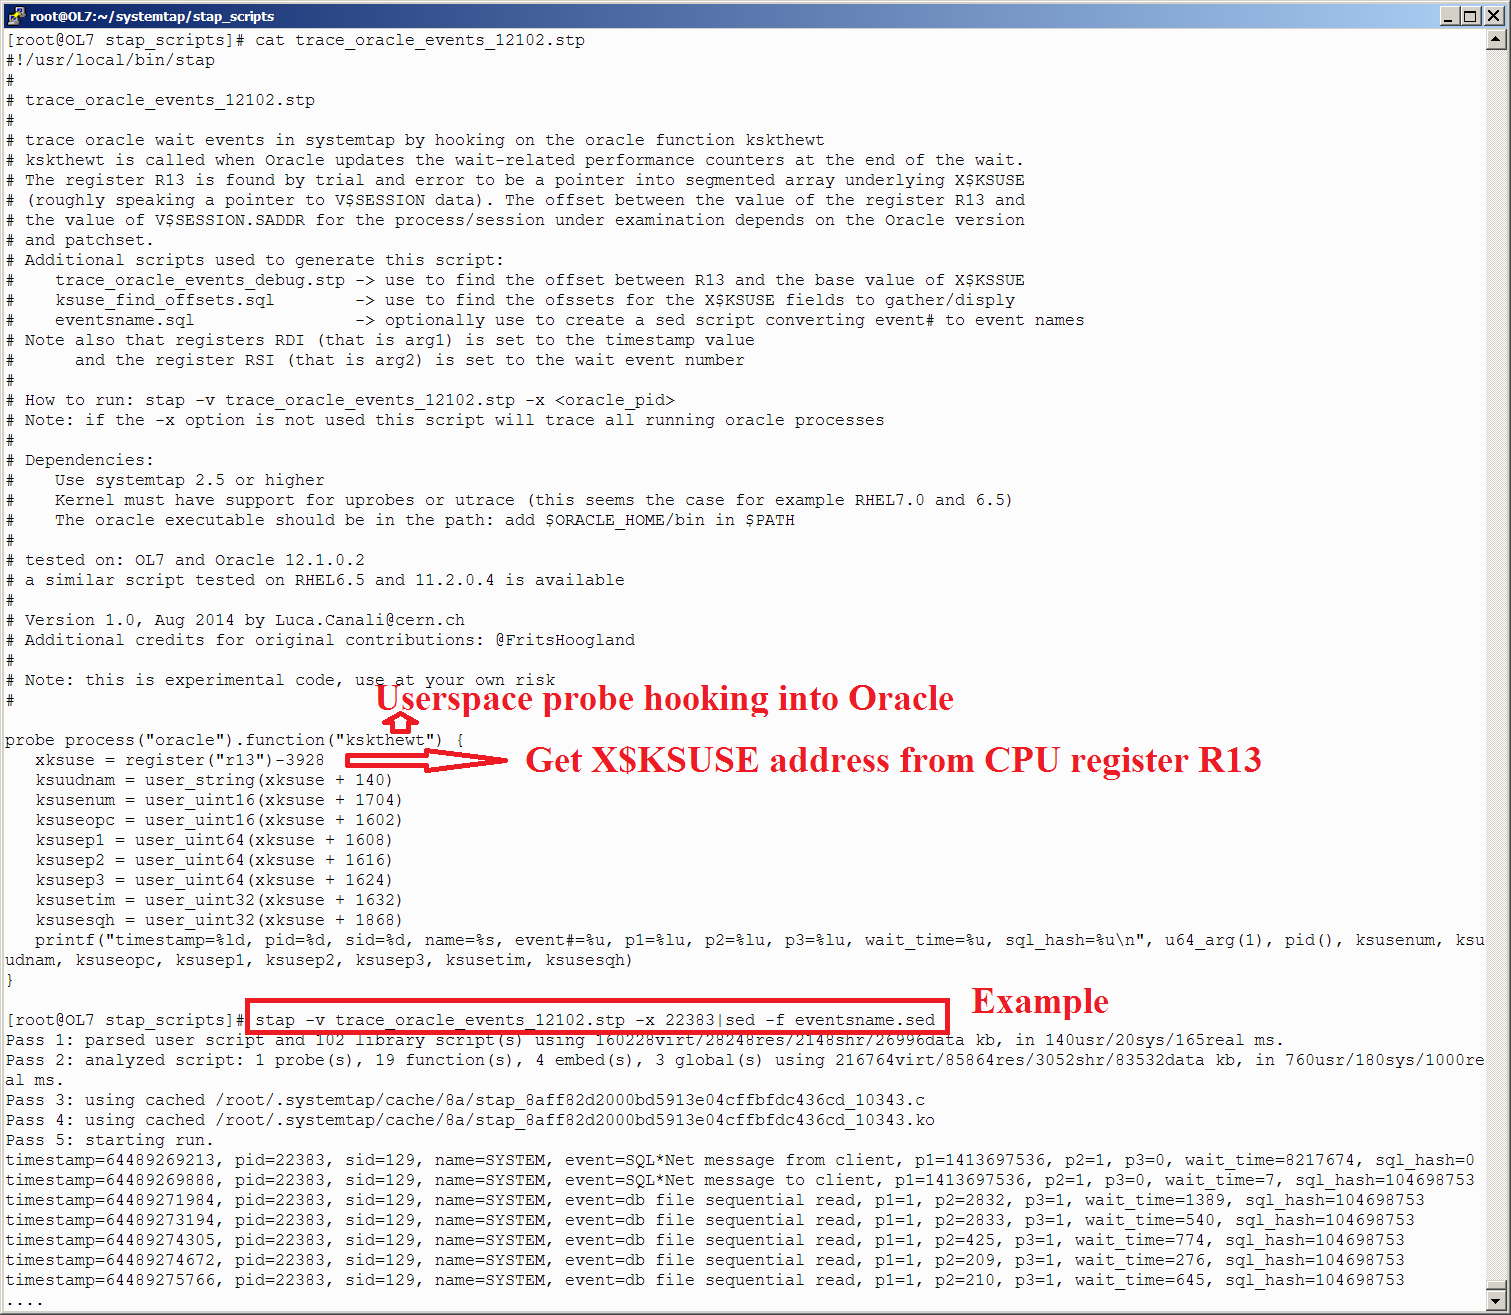
Fig. 1 : Script and sample SystemTap probe output that collects wait events and V $ SESSION details from Oracle core functions and SGA memory.
Note: In the example above, you can see that the SystemTap result is passed to sed -f eventsname.sed . This is needed to convert event identifier numbers to strings. The eventsname.sed file is generated by running the eventsname.sql script.
Aggregation and filtering of event wait data in Systemtap
One of the strengths of SystemTap, inherent in the rest of the dynamic tracing tools, is on-the-fly aggregation and filtering. This helps to reduce the amount of data collected, and thus minimize footprint tracing operations, while maintaining the ability to create meaningful reports and perform tracing in real time. Now, taking as a basis the examples described above for creating SystemTap probes that connect to the wait event interface, you can add aggregations and filters to calculate wait event histograms to a microsecond.
You can easily reproduce one simple and impressive result: write a script, actually porting the functionality of creating microsecond histograms of wait events in 12c. This can be very useful when studying short events such as random disk reads from solid state devices (SSD). Using custom filters, you can aggregate the details of a wait event for a given user or for a specific file, as well as any other selected condition. In general, SystemTap provides more freedom and opportunities in the design of our probes.
Two scripts with examples that can be downloaded from here , direct links: histograms_oracle_events_11204.stp and histograms_oracle_events_12102.stp
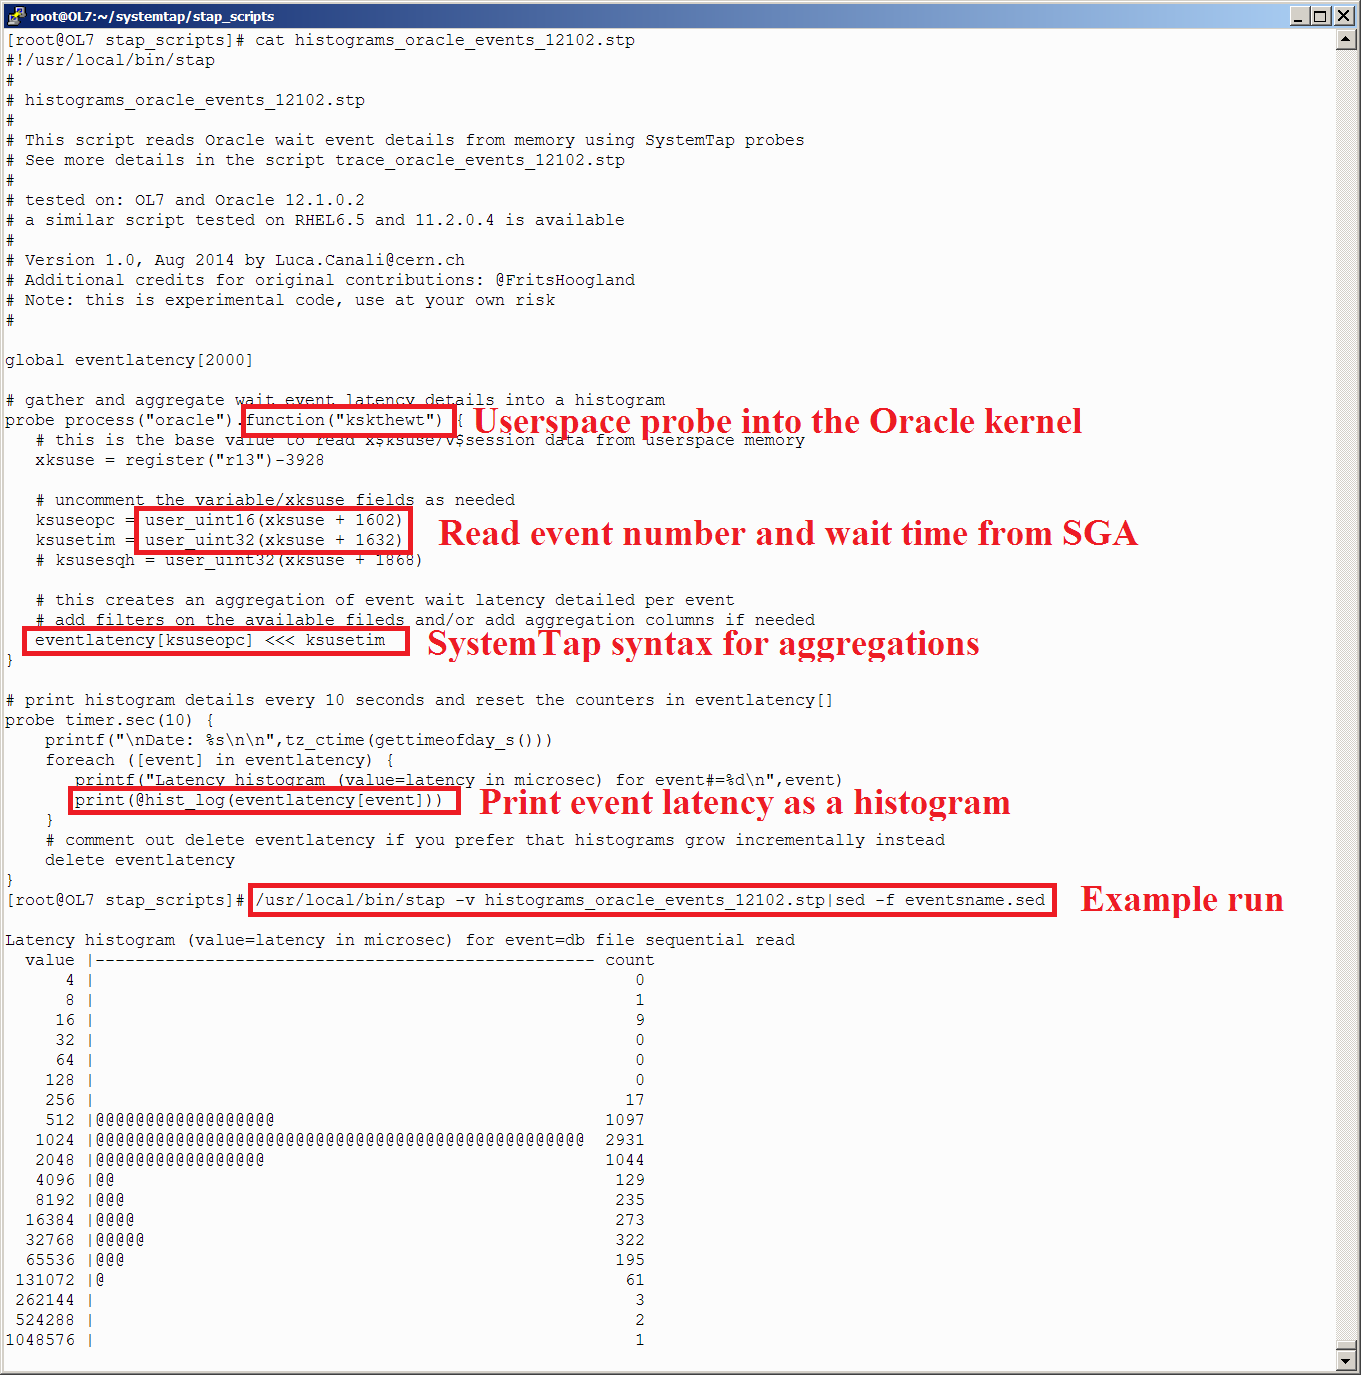
Fig. 2 : Script and sample output of SystemTap probe, which calculates histograms of wait events with microsecond precision.
Consider an alternative way to create SystemTap probes for collecting, as well as aggregating and filtering data about delays in Oracle wait events. To do this, you will need an additional piece of data received after the Oracle kernel function calls: the kews_update_wait_time function is called immediately before kskthewt , setting the CPU RSI register value equal to the wait time in microseconds (the RSI register is available in SystemTap probes as arg2). Look also at the information given in previous work . Thus, you can create a probe that calculates histograms of events regardless of the Oracle version. Example script: histograms_oracle_events_version_independent.stp .
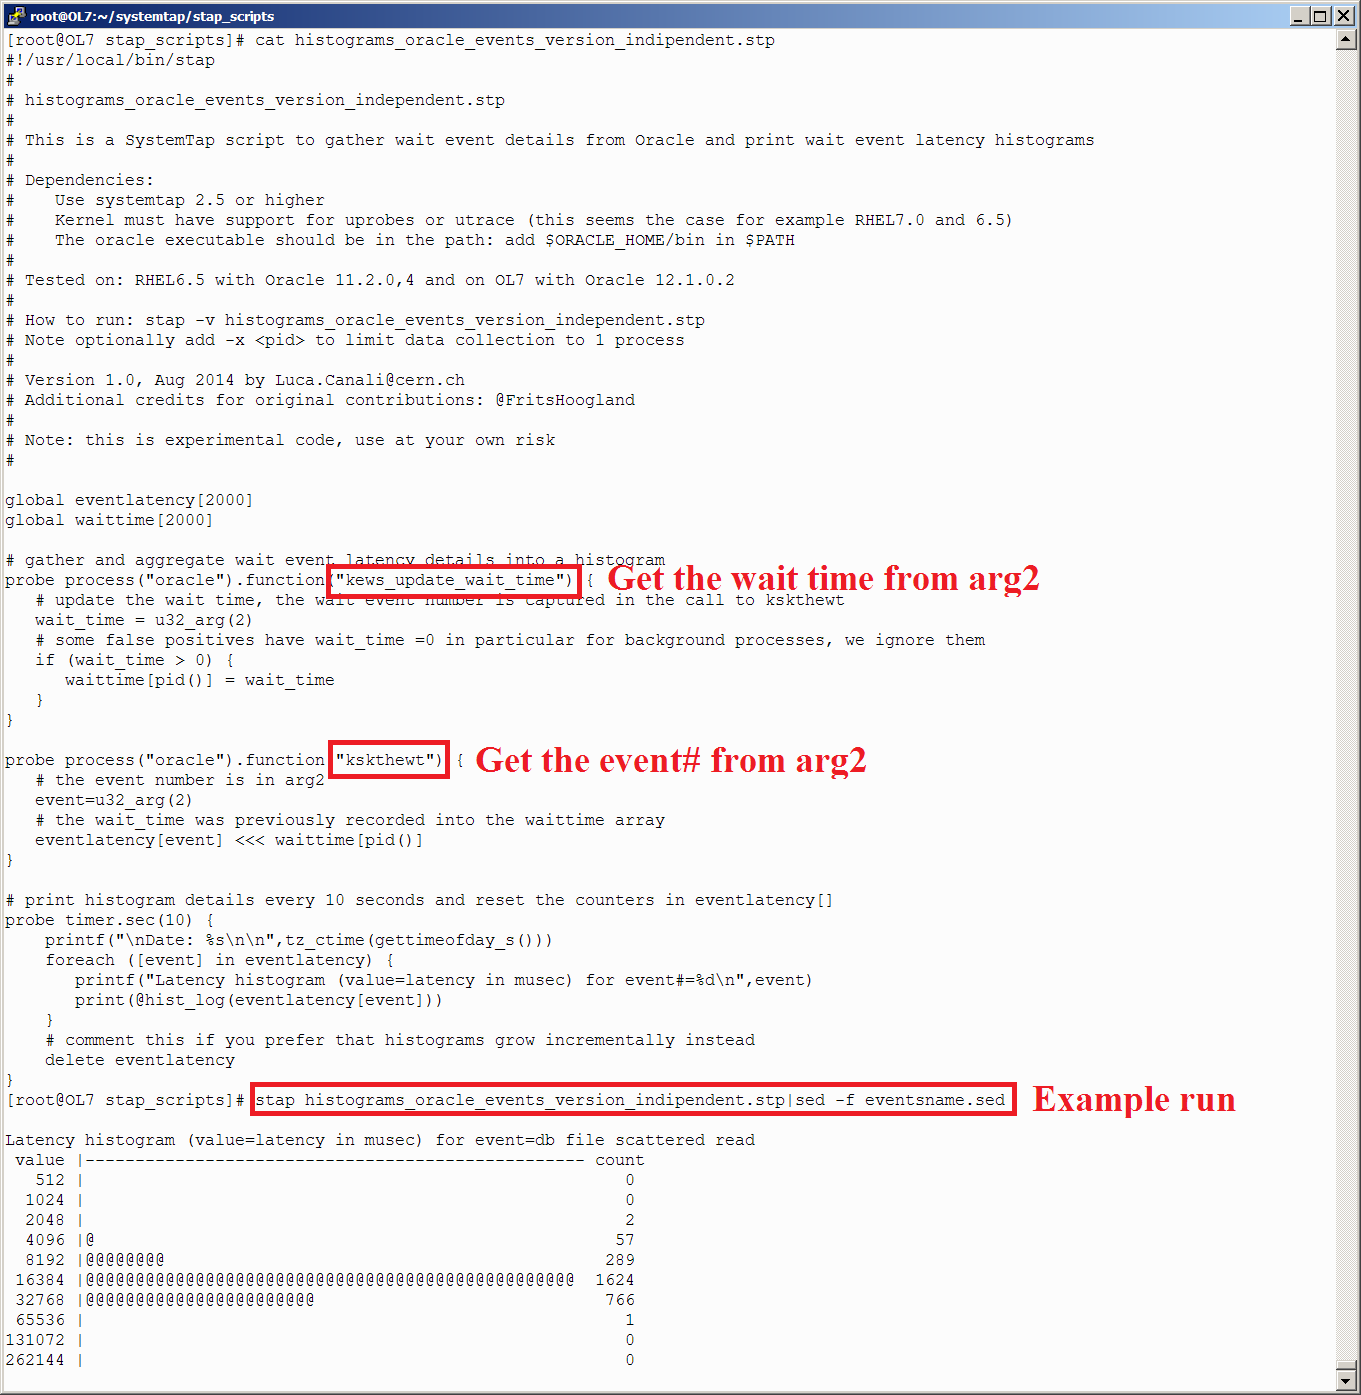
Fig. 3 : Script and sample output of SystemTap probe, which calculates histograms of wait events with microsecond accuracy regardless of the Oracle version.
Oracle logical I / O tracing using SystemTap userspace probes
You can use Systemtap userspace probes including to trace Oracle logical I / O. This probe is based on a study by Tanel Poder (look for a qer_trace.sh script using DTrace) and Alexander Anokhin’s extensive work.
Sticking to the Oracle kernel's kcbgtcr function, we can get information about logical reads or, rather, cache consistent reads, as explained by Alexander Anokhin; kcbgtcr = Kernel Cache Buffer Get Consistent Read, and the first argument of the function being called points to a memory structure with information about the tablespace, relative file number, block number and object number consistent read. We can use all this to create a profiling probes trace_oracle_logical_io_basic.stp .
Based on this, you can also create probes that aggregate and compute statistics for logical reads, for example: trace_oracle_logical_io_count.stp .
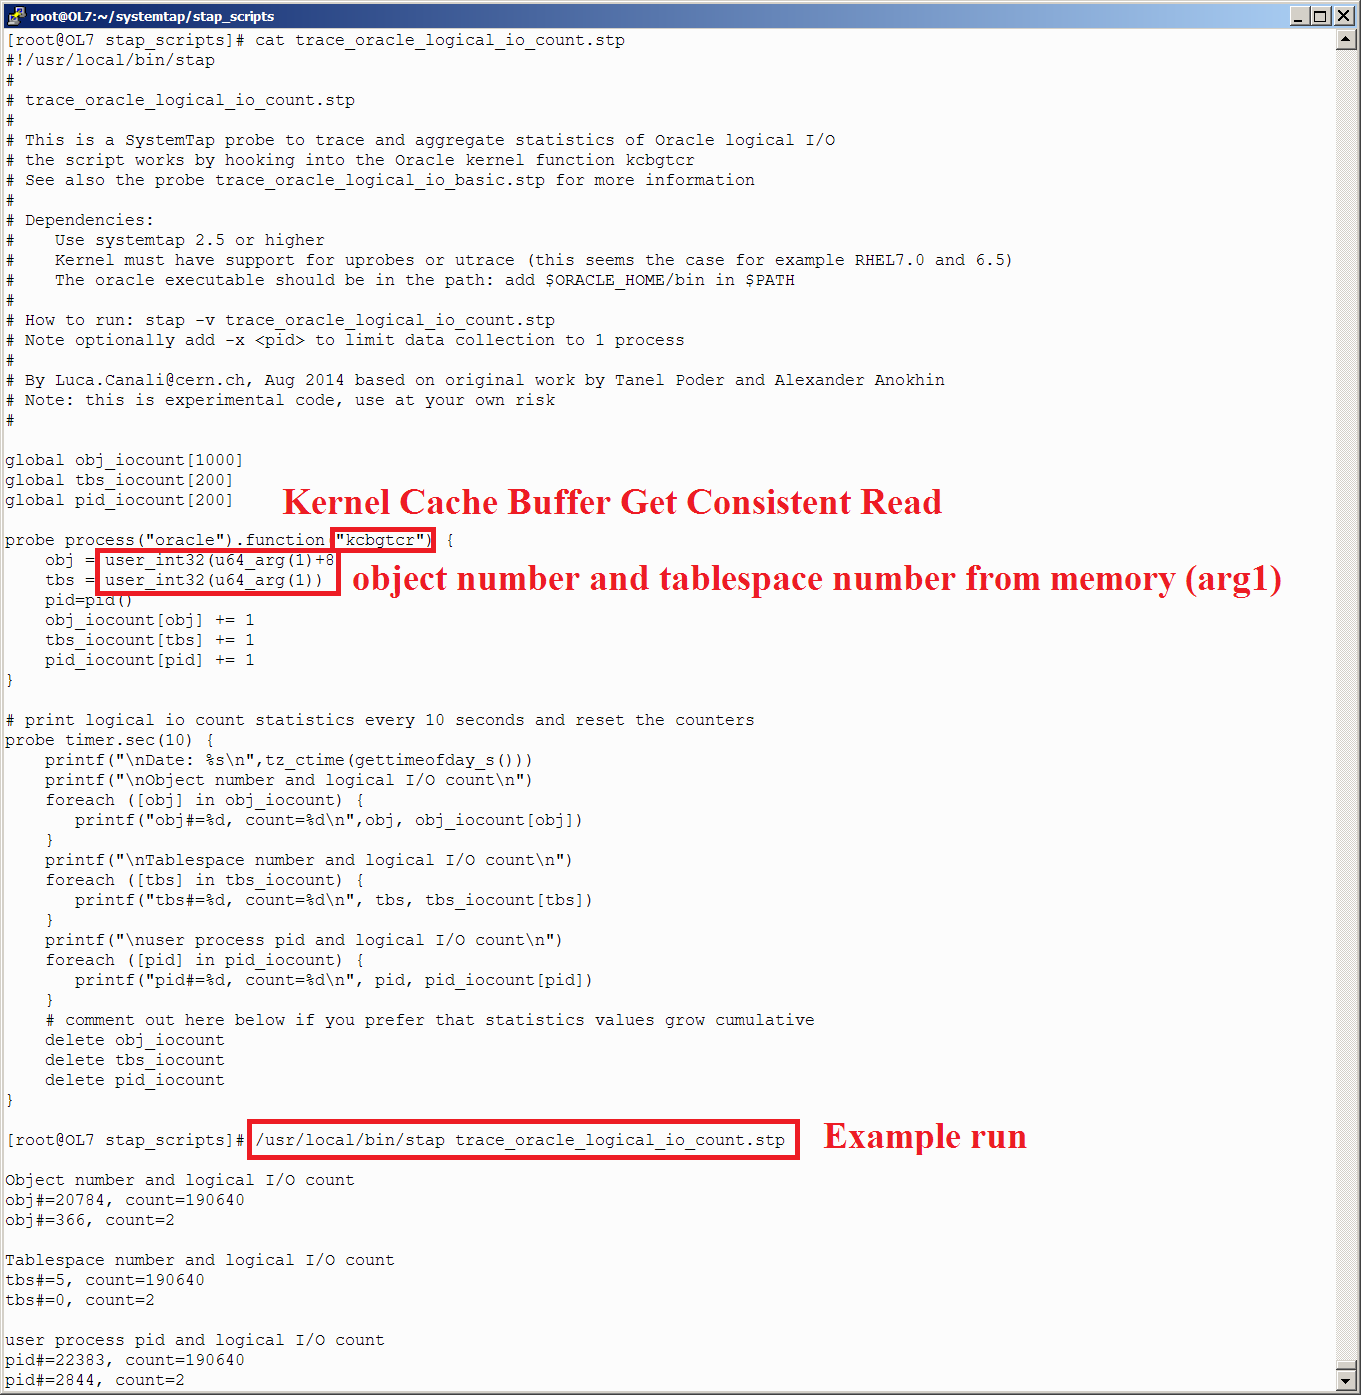
Fig. 4 : Script and sample SystemTap probe output for collecting and aggregating logical I / O information (for the consistent read operation) in Oracle.
Systemtap can integrate Oracle wait event data with OS tracing
Tracking system calls is a strong point and top priority of SystemTap. Using this feature, you can delve into the Oracle tracing process by combining data from the Oracle wait event interface (collected using SystemTap, as shown above) with data coming from SystemTap OS probes.
Below you can find an example based on Oracle using ASM when the storage becomes visible from the OS side as block devices (asmlib is not used in this example). In this case, I / O function calls made by Oracle processes will typically be pread and pwrite for synchronous single-block I / O operations, io_submit and io_getevents for multi-block and / or asynchronous I / O operations. At a lower level, all I / O operations for block devices can be tracked as ioblock requests.
You can start exploring the relationship between Oracle wait events, I / O system calls, and block I / O using the following script: trace_oracle_iocalls_12102.stp .
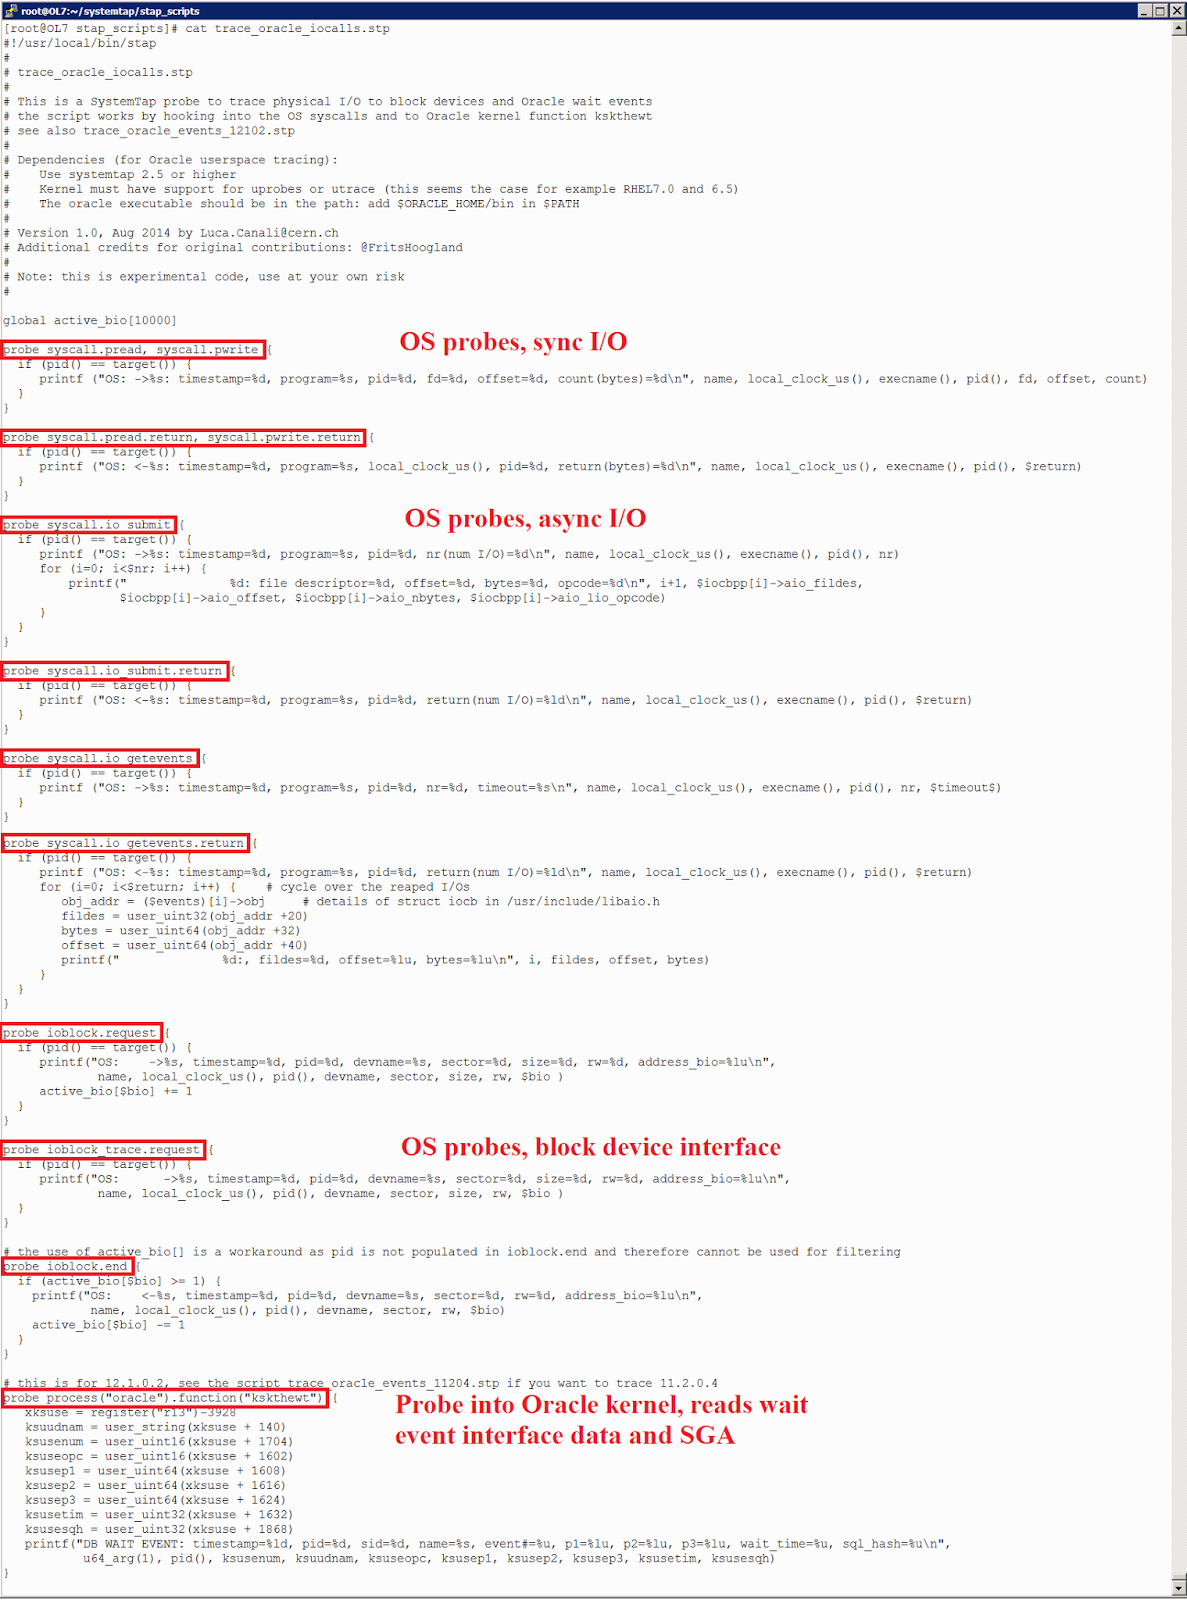
Fig. 5 : SystemTap probes for OS I / O tracing and tracing Oracle wait events. This provides a unified view of the actions underlying the Oracle I / O event and associated OS actions.
In Figure 6, shown below, you can see an example of Oracle I / O tracing, where single-block (synchronous) I / O is done through a pread call to the OS. This is a typical access scenario for Oracle random I / O operations. On the OS side, the pread call is passed to the block device stack as io_block_request . In the Oracle event wait interface, an I / O operation is counted as a db file sequential read wait with file number and block number (p1 and p2 parameters)
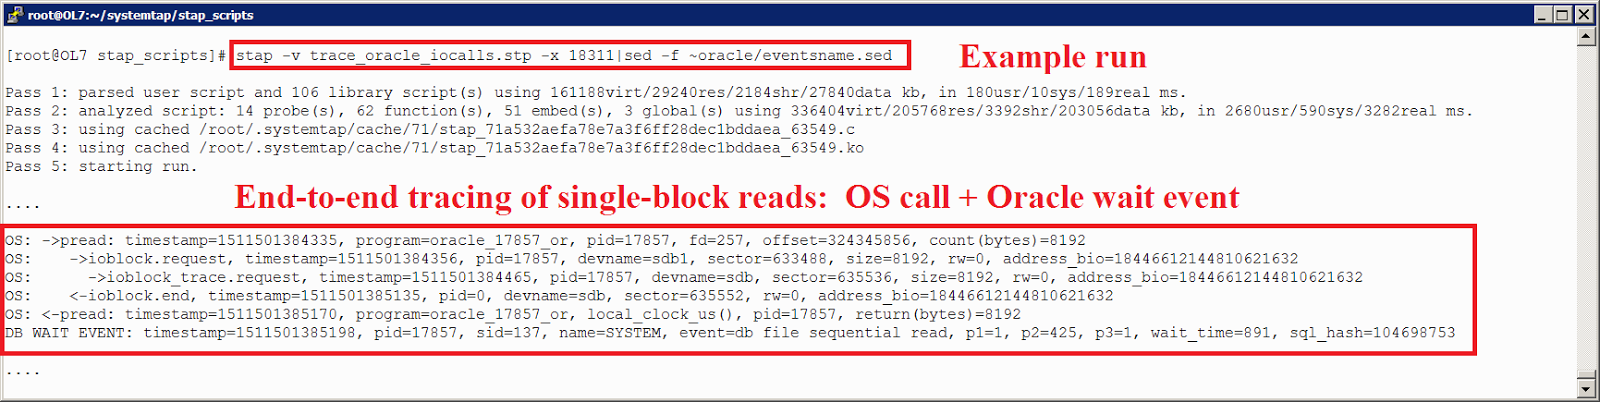
Fig. 6 : Oracle performing single block I / O, profiled using SystemTap probes . This provides an end-to-end trace of the I / O operation: we can see the details of the OS call and the corresponding Oracle wait events.
Linux asynchronous I / O interface is often used by Oracle for multi-block I / O operations. This is done, primarily, for performance reasons and can only be done if allowed by the file system (this is the case in the examples given here, since we use ASM). Exploring Oracle's asynchronous I / O will take us too far away from the main topic, so let's confine ourselves to discussing some basic observations and an example of how you can use SystemTap probes to further explore this issue.
In the case of asynchronous IO, the kernel actually performs I / O , the user process only requests I / O operation and later requests the return of the required information. When examining asynchronous I / O, you need to trace at least two calls: one to send I / O requests (io_submit) and one to get results (io_getevents). I / O requests are then transmitted to the block I / O level. At this stage, they can be divided into several smaller operations, as shown in the examples in Figure 7. Also read the article by Martin Bach on “Increasing the maximum input-output size in Linux” . More information on Oracle's I / O tracing can be found in Fritz Hoogland 's excellent work on Oracle profiling with gdb and his study of multi-block I / O operations.

Fig. 7 : SytemTap probe example, demonstrating Oracle I / O profiling in case of multi-block read, when Oracle decided to perform asynchronous I / O. I / O requests at the OS level are made using io_submit, the results are collected using io_getevents. SystemTap also allows you to see what happens at the block device level when I / O operations are broken up into smaller pieces with a maximum size of 512 KB in the system used for this test.
Setting up the demo stand and documentation
Below you will find tips on setting up a test environment for experimenting with the methods and scripts discussed above:
- Download and install Oracle Virtual Box
- Download OL 7.0 (or OL 6.x), for example, from here https://edelivery.oracle.com/linux
- Also install kernel-devel rpm
If you want to use the probes OS in conjunction with SystemTap , download and install the debuginfo and debuginfo-common packages for the kernel you are using. RPM can be found at https://oss.oracle.com/ol7/debuginfo/ and https://oss.oracle.com/el6/debuginfo/ for OEL 7 and OEL 6, respectively. Similarly, install libaio-debuginfo and libaio-devel if you want to track OS calls for asynchronous I / O.
Note that if you want to run probes only for Oracle userspace functions, you can skip the installation of the kernel and libaio debuginfo packages.
The scripts discussed here require systemtap 2.5 or higher. Consider uninstalling systemtap if you already have an older version.
Download the latest systemtap at https://sourceware.org/systemtap/ftp/releases/ (version 2.6 at the time of this writing).
To install SystemTap from the downloaded source code, run:
As a check after installation, run:
A good start for learning SystemTap documentation is a beginner's guide , as well as a language reference and tapset reference manual .
Download and install Oracle version 12.1.0.2 or 11.2.0.4.
The software can be downloaded here: https://edelivery.oracle.com/
Pre-installed Oracle VMs can be downloaded from OTN (for example, via this link )
Installation guides, in addition to the Oracle documentation, are also available at http://www.oracle-base.com/articles/12c/articles-12c.php and in the racattack wiki .
Conclusion
Dynamic tracing makes it possible to use userpace-level probes in the Oracle kernel and Linux kernel-level probes, which can be used to supplement information on Oracle performance (in particular, data coming from the interface of wait events and statistics counters). These methods can greatly increase the amount of data available to study performance problems and diagnose problems, and, therefore, help the specialist to use systemic approaches to solving problems and remain generally more successful and consistent in their actions.
In this article, you were offered some tips and examples to get started (they can be downloaded from this link or from Github ). Application and improvement of the proposed methods for research and diagnostics of Oracle and other complex platforms is a promising direction with great potential. I plan to highlight some more examples in future publications. I hope that you enjoyed studying the proposed examples, and I wish all readers who were patient enough and got to these lines, success and pleasure from using these methods in their systems!
Thanks
I want to thank the three authors whose original ideas inspired me to write this material: Brendan Gregg , Tanel Poder, and Frits Hoogland. Additional thanks to Fritz Hoagland for checking out this article.

We hope that this release was useful for you. In the next part, we will delve into the subtleties of logical and physical I / O tracing in Oracle, using the capabilities of SystemTap.
For specialists interested in commercial databases, we prepared translation of publications from database specialists from CERN. Today's material opens a cycle of several articles on tracing and debugging the performance of Oracle DB using SystemTap.
')
This article focuses on using SystemTap to troubleshoot Oracle DBMS. In particular, you will learn how to explore Oracle processes and their userspace functions. These methods will be useful and exciting for anyone interested in looking under the hood of technologies and increasing their efficiency in troubleshooting, as well as in performance research.
Introduction
Tracing userspace is a very powerful method that can be used to supplement the performance and profiling information available in Oracle, such as V $ views and the 'event 10046' trace files, as well as advanced diagnostics and study of the Oracle core. Such studies have been available for several years mainly on Solaris using DTrace (see, for example, the Tenela blog ).
Dynamic tracing tools that allow you to profile the kernel and userspace are also gaining momentum in the Linux world, thanks to recent additions to the kernel. There are several tools that provide an interface for collecting, aggregating, and outputting dynamic trace data. SystemTap is one of the most advanced, but new tools are constantly emerging, including 2 DTrace ports. To explore this topic, see Brendan Gregg ’s presentation at LinuxCon 2014.
I first learned that SystemTap can be used to trace userspace from Fritz Hoogland (Frits Hoogland), and was very impressed with the possibilities that are available for advanced troubleshooting, namely, how it can help explore Oracle workloads to tune performance and advanced diagnostics.
In addition, I was pleased to learn that the methods described in this article also work under RHEL 6.5, which is great news for me, because it means that I can start using SystemTap on many existing systems without waiting for updates to latest kernel versions.
The SystemTap documentation has additional information on the implementation of userspace probes: with Linux kernels older than version 3.5 (for example, when using RHEL 7.0, OL 7.0 or OL6.5 with UEK3) SystemTap will use the UPROBES module to trace userspace; UTRACE kernel extensions, if available. SystemTap is able to trace userspace with both UTRACE and UPROBES; other dynamic trace tools seem to work only with UPROBES and, therefore, only with later versions of Linux. As Fritz writes in the above article, you will need SystemTap 2.5 and above to trace userspace. At the time of this writing, SystemTap 2.6 has been released.
This is how you can check if the UTRACE extensions are configured:
# grep CONFIG_UTRACE /boot/config-`uname -r` CONFIG_UTRACE=y This is how it is checked whether UPROBES are available:
# grep CONFIG_UPROB /boot/config-`uname -r` CONFIG_UPROBES=y CONFIG_UPROBE_EVENT=y Below you will find a few examples, ideas, and test code to start using userspace tracing using SystemTap in Oracle. The scripts discussed in this article can be found at this link.
Deep dive: SystemTap reads Oracle standby event interface data and X $ tables
In this section, you will learn how to connect SystemTap to the Oracle wait event interface. This makes it possible to connect two types of tools: data collected using SystemTap probes, and data from the Oracle wait event interface. So we pave the way for more complex research.
The main thing to do is to create SystemTap probe at the “right point” of the Oracle kernel and make it read the information we need.
As discussed in a previous paper on DTrace and Oracle, the Oracle kernel function kskthewt can be used for this purpose. It is called by the Oracle kernel at the end of each wait event, presumably to update the corresponding performance counters. Our first step is to create a probe, which runs after the Oracle executable file enters the kskthewt function. The next step is to get SystemTap to read the information we need. Processor and memory registers are available. Some of the registers are used to pass arguments to a function, as described in the x86 calling conventions convention . In other cases, the CPU registers may contain useful information "remaining" after calls to the parent functions. Reading directly from memory areas and, in particular, from the SGA opens the way for most Oracle instrumentation data.
Additional facts that I recently discovered in collaboration with Fritz Hoagland, helping with the creation of the probe for the Oracle kskthewt function:
- When execution goes to the kskthewt function, the CPU R13 register, it turns out, stores a pointer to the X $ KSUSE memory structure (with offset). R12 seems to point to the same address most of the time, but there have been times when this was not the case, so I prefer to use R13 .
- X $ KSUSE is the “underlying” service table for V $ SESSION and, therefore, contains a lot of interesting information. X $ KSUSE is allocated in memory as a segmented array in the SGA, see the Julian Dyke presentation on the internal SGA device for more details on this fascinating topic.
- V $ SESSION.SADDR - the base address of the current session data in V $ SESSION and X $ KSUSE - can be obtained from the value of R13 by subtracting the offset. The offset value depends on the version of Oracle and the port, and can be found "experimentally" using SystemTap or gdb (see the script: trace_oracle_events_debug.stp for details ).
- The X $ KSUSE fields of interest (that is, the values of the V $ SESSION columns) can be found from the base X $ KSUSE value with an offset calculated using a query from X $ KQFCO and X $ KQFTA (see script: ksuse_find_offsets.sql ).
- It was discovered that the RDI register (which is mapped to the arg1 argument in SystemTap probe) is set to the timestamp value. This is the timestamp of the wait event — the same value that can be seen in the trace file for event 10046 if it is activated.
- The RSI register (arg2 in SystemTap probes) is set to the wait event number.
If you combine all this, you can write a SystemTap script to collect and display the wait event and the required data v $ session. An example of such a script is shown in the figure. Scripts can be downloaded here as a zip file. Direct links: trace_oracle_events_11204.stp and trace_oracle_events_12102.stp . These scripts were tested on Oracle versions 11.2.0.4 on RHEL6.5 and Oracle 12.1.0.2 on OEL7, respectively.
Fig. 1 : Script and sample SystemTap probe output that collects wait events and V $ SESSION details from Oracle core functions and SGA memory.
Note: In the example above, you can see that the SystemTap result is passed to sed -f eventsname.sed . This is needed to convert event identifier numbers to strings. The eventsname.sed file is generated by running the eventsname.sql script.
Aggregation and filtering of event wait data in Systemtap
One of the strengths of SystemTap, inherent in the rest of the dynamic tracing tools, is on-the-fly aggregation and filtering. This helps to reduce the amount of data collected, and thus minimize footprint tracing operations, while maintaining the ability to create meaningful reports and perform tracing in real time. Now, taking as a basis the examples described above for creating SystemTap probes that connect to the wait event interface, you can add aggregations and filters to calculate wait event histograms to a microsecond.
You can easily reproduce one simple and impressive result: write a script, actually porting the functionality of creating microsecond histograms of wait events in 12c. This can be very useful when studying short events such as random disk reads from solid state devices (SSD). Using custom filters, you can aggregate the details of a wait event for a given user or for a specific file, as well as any other selected condition. In general, SystemTap provides more freedom and opportunities in the design of our probes.
Two scripts with examples that can be downloaded from here , direct links: histograms_oracle_events_11204.stp and histograms_oracle_events_12102.stp
Fig. 2 : Script and sample output of SystemTap probe, which calculates histograms of wait events with microsecond precision.
Consider an alternative way to create SystemTap probes for collecting, as well as aggregating and filtering data about delays in Oracle wait events. To do this, you will need an additional piece of data received after the Oracle kernel function calls: the kews_update_wait_time function is called immediately before kskthewt , setting the CPU RSI register value equal to the wait time in microseconds (the RSI register is available in SystemTap probes as arg2). Look also at the information given in previous work . Thus, you can create a probe that calculates histograms of events regardless of the Oracle version. Example script: histograms_oracle_events_version_independent.stp .
Fig. 3 : Script and sample output of SystemTap probe, which calculates histograms of wait events with microsecond accuracy regardless of the Oracle version.
Oracle logical I / O tracing using SystemTap userspace probes
You can use Systemtap userspace probes including to trace Oracle logical I / O. This probe is based on a study by Tanel Poder (look for a qer_trace.sh script using DTrace) and Alexander Anokhin’s extensive work.
Sticking to the Oracle kernel's kcbgtcr function, we can get information about logical reads or, rather, cache consistent reads, as explained by Alexander Anokhin; kcbgtcr = Kernel Cache Buffer Get Consistent Read, and the first argument of the function being called points to a memory structure with information about the tablespace, relative file number, block number and object number consistent read. We can use all this to create a profiling probes trace_oracle_logical_io_basic.stp .
probe process("oracle").function("kcbgtcr") { printf("tbs#=%d, rfile=%d, block#=%d, obj#=%d\n",user_int32(u64_arg(1)), user_int32(u64_arg(1)+4) >> 22 & 0x003FFFFF, user_int32(u64_arg(1)+4) & 0x003FFFFF, user_int32(u64_arg(1)+8)) } Based on this, you can also create probes that aggregate and compute statistics for logical reads, for example: trace_oracle_logical_io_count.stp .
Fig. 4 : Script and sample SystemTap probe output for collecting and aggregating logical I / O information (for the consistent read operation) in Oracle.
Systemtap can integrate Oracle wait event data with OS tracing
Tracking system calls is a strong point and top priority of SystemTap. Using this feature, you can delve into the Oracle tracing process by combining data from the Oracle wait event interface (collected using SystemTap, as shown above) with data coming from SystemTap OS probes.
Below you can find an example based on Oracle using ASM when the storage becomes visible from the OS side as block devices (asmlib is not used in this example). In this case, I / O function calls made by Oracle processes will typically be pread and pwrite for synchronous single-block I / O operations, io_submit and io_getevents for multi-block and / or asynchronous I / O operations. At a lower level, all I / O operations for block devices can be tracked as ioblock requests.
You can start exploring the relationship between Oracle wait events, I / O system calls, and block I / O using the following script: trace_oracle_iocalls_12102.stp .
Fig. 5 : SystemTap probes for OS I / O tracing and tracing Oracle wait events. This provides a unified view of the actions underlying the Oracle I / O event and associated OS actions.
In Figure 6, shown below, you can see an example of Oracle I / O tracing, where single-block (synchronous) I / O is done through a pread call to the OS. This is a typical access scenario for Oracle random I / O operations. On the OS side, the pread call is passed to the block device stack as io_block_request . In the Oracle event wait interface, an I / O operation is counted as a db file sequential read wait with file number and block number (p1 and p2 parameters)
Fig. 6 : Oracle performing single block I / O, profiled using SystemTap probes . This provides an end-to-end trace of the I / O operation: we can see the details of the OS call and the corresponding Oracle wait events.
Linux asynchronous I / O interface is often used by Oracle for multi-block I / O operations. This is done, primarily, for performance reasons and can only be done if allowed by the file system (this is the case in the examples given here, since we use ASM). Exploring Oracle's asynchronous I / O will take us too far away from the main topic, so let's confine ourselves to discussing some basic observations and an example of how you can use SystemTap probes to further explore this issue.
In the case of asynchronous IO, the kernel actually performs I / O , the user process only requests I / O operation and later requests the return of the required information. When examining asynchronous I / O, you need to trace at least two calls: one to send I / O requests (io_submit) and one to get results (io_getevents). I / O requests are then transmitted to the block I / O level. At this stage, they can be divided into several smaller operations, as shown in the examples in Figure 7. Also read the article by Martin Bach on “Increasing the maximum input-output size in Linux” . More information on Oracle's I / O tracing can be found in Fritz Hoogland 's excellent work on Oracle profiling with gdb and his study of multi-block I / O operations.
Fig. 7 : SytemTap probe example, demonstrating Oracle I / O profiling in case of multi-block read, when Oracle decided to perform asynchronous I / O. I / O requests at the OS level are made using io_submit, the results are collected using io_getevents. SystemTap also allows you to see what happens at the block device level when I / O operations are broken up into smaller pieces with a maximum size of 512 KB in the system used for this test.
Setting up the demo stand and documentation
Below you will find tips on setting up a test environment for experimenting with the methods and scripts discussed above:
- Download and install Oracle Virtual Box
- Download OL 7.0 (or OL 6.x), for example, from here https://edelivery.oracle.com/linux
- Also install kernel-devel rpm
If you want to use the probes OS in conjunction with SystemTap , download and install the debuginfo and debuginfo-common packages for the kernel you are using. RPM can be found at https://oss.oracle.com/ol7/debuginfo/ and https://oss.oracle.com/el6/debuginfo/ for OEL 7 and OEL 6, respectively. Similarly, install libaio-debuginfo and libaio-devel if you want to track OS calls for asynchronous I / O.
Note that if you want to run probes only for Oracle userspace functions, you can skip the installation of the kernel and libaio debuginfo packages.
The scripts discussed here require systemtap 2.5 or higher. Consider uninstalling systemtap if you already have an older version.
Download the latest systemtap at https://sourceware.org/systemtap/ftp/releases/ (version 2.6 at the time of this writing).
To install SystemTap from the downloaded source code, run:
./configure # configure , ; , make make install As a check after installation, run:
stap --help A good start for learning SystemTap documentation is a beginner's guide , as well as a language reference and tapset reference manual .
Download and install Oracle version 12.1.0.2 or 11.2.0.4.
The software can be downloaded here: https://edelivery.oracle.com/
Pre-installed Oracle VMs can be downloaded from OTN (for example, via this link )
Installation guides, in addition to the Oracle documentation, are also available at http://www.oracle-base.com/articles/12c/articles-12c.php and in the racattack wiki .
Conclusion
Dynamic tracing makes it possible to use userpace-level probes in the Oracle kernel and Linux kernel-level probes, which can be used to supplement information on Oracle performance (in particular, data coming from the interface of wait events and statistics counters). These methods can greatly increase the amount of data available to study performance problems and diagnose problems, and, therefore, help the specialist to use systemic approaches to solving problems and remain generally more successful and consistent in their actions.
In this article, you were offered some tips and examples to get started (they can be downloaded from this link or from Github ). Application and improvement of the proposed methods for research and diagnostics of Oracle and other complex platforms is a promising direction with great potential. I plan to highlight some more examples in future publications. I hope that you enjoyed studying the proposed examples, and I wish all readers who were patient enough and got to these lines, success and pleasure from using these methods in their systems!
Thanks
I want to thank the three authors whose original ideas inspired me to write this material: Brendan Gregg , Tanel Poder, and Frits Hoogland. Additional thanks to Fritz Hoagland for checking out this article.
We hope that this release was useful for you. In the next part, we will delve into the subtleties of logical and physical I / O tracing in Oracle, using the capabilities of SystemTap.
Source: https://habr.com/ru/post/330024/
All Articles