Analysis of changes in the game
One of the main characteristics of a successful mobile game is its constant operation: this is the processing of existing content, and the addition of a new one. But there is a downside to the coin - you need to constantly assess the risks of changes in the next version of the application. It is necessary to present in advance how changes in the update will affect the performance of the project. Otherwise, you may find yourself in a situation when during a planned update the balance suddenly breaks down and you need to urgently raise the entire development team to release a hotfix.
Even before building a new production build, we need to understand what indicators the innovation will affect. Indeed, in the new versions of the game there can be many changes in the balance. Without preliminary planning, one of such questions will inevitably arise: “What has increased ARPU in Canada — local events in honor of a national holiday or a general increase in the complexity of a group of some levels; and maybe just the stars so matched? ". Of course, after the release of the update, a comprehensive analysis of the results is performed, but it is necessary to understand the nature of the changes in advance.

Before introducing new features into the game, we try to answer a number of questions:
')
When we answered the most important questions, there are still a couple. For example, how will we add changes to the game? There are two options:
AB-tests are written a lot of good and different, but we will write a little more.
If you decide to check the changes using the AB test, the main thing is to highlight the key points, otherwise the test will be useless either because of its lack of evidence or because of misinterpretation. In any case, we do not need a useless test. Therefore, this is what we look at when we are planning an AB test:
Even if you distribute the players in groups in equal proportions, inside they can get into different conditions. For example, those who came into the game and entered the test at the beginning of the month may have a greater ARPU than those who came at the end of the test. The choice of methodology - this may be a cohort approach or the calculation of ARPU Daily (ARPDAU) - depends on the specific objectives at the planning stage and on the players distributed to the test on a regular basis.
In a cohort assessment of the result, it is necessary to take into account that the players, distributed closer to the end of the test, could not yet reach the “conversion points”. It is necessary either to cut off part of the “last” cohorts in the analysis, or to wait for the right time after stopping the distribution of players in the test.
Also, it is possible to approach the analysis of group totals in different ways. We use two main approaches:
Let's take as an example a few tests on the Township project. There, using the Bayesian approach instead of the frequency approach has improved the accuracy.
In the first test, we changed the amount of paid currency, the so-called. cache that a player can get from one particular source. We planned that this could lead to a slight improvement in monetization. As a result, we have established the difference:
Thus, we were able to raise the accuracy to acceptable without changing the size of the groups of participants.
In another test, we changed the ad display settings for a specific group of players in a region with poor monetization. At that time, we already found out that for some well-chosen groups of players, advertising could not only not spoil, but even improve conversion or ARPU, and wanted to test this approach on a wider group.

Regardless of the final choice of approach to the assessment of results, we obtain information about the difference between the control and test groups. If we consider the result to be positive for the project, then we include the change for all users. Even before the full implementation of changes in the game, we have an idea of how they can affect our players.
Of course, in some cases for the new content we can not conduct an AB test, if the effect of the changes is predictable. For example, when adding new match-3 levels to the game. For these changes, we use a posteriori control of key metrics. As in the case of the AB-test, the data for this is collected and processed from the events that came from users in automatic mode.
We have our own dashboard, an internal development based on the Cubes opensource solution. It is used not only by analysts, but also by game designers, managers, producers and other members of our friendly development team. With this dashboard (more precisely, a set of dashboards) for each project, both key indicators and their internal metrics, such as, for example, the complexity of match-3 levels, are tracked. Data for dashboards is prepared in the format of olap-cubes, which, in turn, contain aggregated data from the database of raw-events. Thanks to the choice of additive models for each graph, it is possible to perform a drilldown (decomposition into components) into the necessary categories. If desired, you can group or ungroup users to apply filters when rendering metrics. For example, you can do a drilldown by application version, level setting version, region and solvency, leaving only paying players from Australia with game version 1.8 and level 4 tuning version.
Of course, the most interesting combination of the default is the latest version of the game and the latest version of the levels, which are compared with the previous version. This allows the level designers to continuously monitor the current state of the project complexity curve, abstracting from the global analysis of the update, and quickly respond to deviations of indicators from the planned course.
Even before building a new production build, we need to understand what indicators the innovation will affect. Indeed, in the new versions of the game there can be many changes in the balance. Without preliminary planning, one of such questions will inevitably arise: “What has increased ARPU in Canada — local events in honor of a national holiday or a general increase in the complexity of a group of some levels; and maybe just the stars so matched? ". Of course, after the release of the update, a comprehensive analysis of the results is performed, but it is necessary to understand the nature of the changes in advance.
Development of changes
Before introducing new features into the game, we try to answer a number of questions:
')
- Where are we going to look? - on which metrics ( both generally accepted KPIs and internal quality criteria ) the change will presumably affect what effect we will consider successful for the project.
- Who will we look at? - for whom the change is intended ( for whales, for new players, for players from China, for players stuck on a particular group of levels, etc.) .
- Why we will look? - what are the associated risks ( harder levels → more monetization and more dumps (churn); easier levels → less monetization and less dumps) .
- Is there anything to watch? - Is all the necessary information tracked in the game?
When we answered the most important questions, there are still a couple. For example, how will we add changes to the game? There are two options:
- AB test. We conduct AB-tests for new features or strong changes to the current balance and gameplay. Whenever possible, a preliminary AB test is preferable to us.
- Immediately into the game. Adding new content to a game without an AB test is possible when we either technically cannot conduct an AB test, or do not consider content to be fundamentally new (new set of levels, new decorations, etc.).
AB-tests are written a lot of good and different, but we will write a little more.
AB Test Planning
If you decide to check the changes using the AB test, the main thing is to highlight the key points, otherwise the test will be useless either because of its lack of evidence or because of misinterpretation. In any case, we do not need a useless test. Therefore, this is what we look at when we are planning an AB test:
- The choice of values for evaluation.
Example: it is assumed that the changes should “tighten the screws” and encourage players to pay to pass the level. What we need to evaluate: conversion, ARPU, retention, dumps, level complexity, use of boosts. We need to be sure that increasing revenue through increased conversion is worth the potential loss of users. Moreover, some of the users who have fallen off could start watching advertisements and generate income in the future. You must also be sure that the level is made well, that it is not too random, that there is no “silver bullet” in the form of one boost that guarantees passage. Will these controlled metrics be enough or should I add more? - Calculation of the required required sample to obtain a meaningful result.
Example: the model predicts a guaranteed lack of conversion for about 2000 people in the group with level-up at the selected level on the selected day. How many days to run the predictions so that the results of the test will produce meaningful results with an increase in the display of commercials for this group? - Formalization of test launch conditions.
Example: to run a large scale test, you need to find a country with a good conversion rate. In this case, recruit only experienced players who do not speak English. How to formalize this for the dynamic distribution of players in the test? - Understanding which mechanisms are provided for data collection and analysis of results.
Example: can we, in parallel, carry out several tests on different groups of levels and use a convenient tool to divide the influence of one and the other on players participating in two tests at once? - Formalization of criteria for making decisions about the completion of the test.
Example: is it worth stopping a test ahead of time if metrics have dropped dramatically? Or is this a temporary effect, characteristic of a cohort, and is it worth the wait? - Formalization of criteria for making decisions about the introduction of changes in the game. Let's talk about it in the next section of the article!
Making the right decisions on the test results
Even if you distribute the players in groups in equal proportions, inside they can get into different conditions. For example, those who came into the game and entered the test at the beginning of the month may have a greater ARPU than those who came at the end of the test. The choice of methodology - this may be a cohort approach or the calculation of ARPU Daily (ARPDAU) - depends on the specific objectives at the planning stage and on the players distributed to the test on a regular basis.
In a cohort assessment of the result, it is necessary to take into account that the players, distributed closer to the end of the test, could not yet reach the “conversion points”. It is necessary either to cut off part of the “last” cohorts in the analysis, or to wait for the right time after stopping the distribution of players in the test.
Also, it is possible to approach the analysis of group totals in different ways. We use two main approaches:
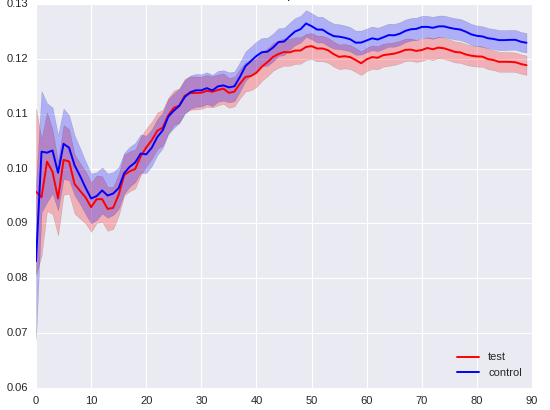
- Frequency approach - a classic approach to evaluating results. We formulate the null hypothesis of the absence of a significant difference between groups and an alternative hypothesis that negates the null. The outcome of the study will be a decision about the validity of any of the two hypotheses for the entire population. Select the alpha level (1 - alpha = significance level) and perform the test using the statistical criterion (z-criterion, t-criterion). Next, we build confidence intervals for the control and test groups. If these intervals do not overlap, then the result is reliable with probability 1 - alpha. In fact, the chosen value of alpha is the probability of an error of the first kind, i.e. the probability that an alternative hypothesis will be adopted according to the results of the experiment, although the null hypothesis is true for the general population.
Pros: a guaranteed result of determining a significant difference with a sufficiently large sample.
Disadvantages: sample size - the higher the selected level of confidence, the more recruited group members. And the more critical the change being tested, the higher the level of significance that we set by the threshold value. - The Bayesian approach is a less common method, which is based on the principle of calculating conditional probability. It allows us to consider the probability of an event, provided that the population is distributed in a certain way. From the point of view of practice, the use of the Bayesian approach makes it possible to reduce for a number of metrics the requirements for the number of sample elements (participants in the AB test). This works, because at a certain point, while optimizing the distribution parameters, the density built does not approach the actual results in the test.
The approach is based on the principle of calculation of conditional probability. If at the time of analyzing the results we know what kind of distribution the general population has, we can restore the probability density by optimizing the parameters of this distribution.
If the random variable does not correspond to one type of typical distributions, then the desired distribution can be obtained by combining several typical distributions using the principle of joint probability of events. For example, for ARPPU, we combine the distribution of income from the user with the distribution of paying users (optimizing the parameters of the work). We describe the final distribution model for a random variable and compare two samples within the framework of the constructed model. Next, using the statistical criterion, we check that both samples correspond to the distribution described in the model and have different parameters.
Pros: in case of successful model selection and successful optimization of parameters, accuracy and reliability of estimates can be improved and in some cases decisions can be made by recruiting small groups of users for the test.
Disadvantages: there may not be a successful model, or it can be quite complicated for application.
Let's take as an example a few tests on the Township project. There, using the Bayesian approach instead of the frequency approach has improved the accuracy.
In the first test, we changed the amount of paid currency, the so-called. cache that a player can get from one particular source. We planned that this could lead to a slight improvement in monetization. As a result, we have established the difference:
- DPU (Daily Paying Users) - test group is 1% larger than the control group with a probability of 87% when using the Bayesian approach, whereas the same group divergence when using the frequency approach is true with a 50% probability.
- ARPU Daily (ARPDAU) - the test is more than the control one by 2.55%, the Bayesian approach is 94%, the frequency approach is 74%.
- ARPPU Daily - test more by 1.8%, Bayesian - 89%, frequency - 61%.
Thus, we were able to raise the accuracy to acceptable without changing the size of the groups of participants.
In another test, we changed the ad display settings for a specific group of players in a region with poor monetization. At that time, we already found out that for some well-chosen groups of players, advertising could not only not spoil, but even improve conversion or ARPU, and wanted to test this approach on a wider group.
- The conversion in the control group was higher than in the test group, with a Bayesian approach with a probability of 97%, this was clear for 50,000 players, and for a private one - with a 95% probability for 75,000 players.
- The difference in ARPU in favor of the control group by the Bayesian approach was estimated by the total with a 97% probability per month, while in the frequency approach the confidence intervals were not diverged.
Regardless of the final choice of approach to the assessment of results, we obtain information about the difference between the control and test groups. If we consider the result to be positive for the project, then we include the change for all users. Even before the full implementation of changes in the game, we have an idea of how they can affect our players.
Metrics monitoring
Of course, in some cases for the new content we can not conduct an AB test, if the effect of the changes is predictable. For example, when adding new match-3 levels to the game. For these changes, we use a posteriori control of key metrics. As in the case of the AB-test, the data for this is collected and processed from the events that came from users in automatic mode.
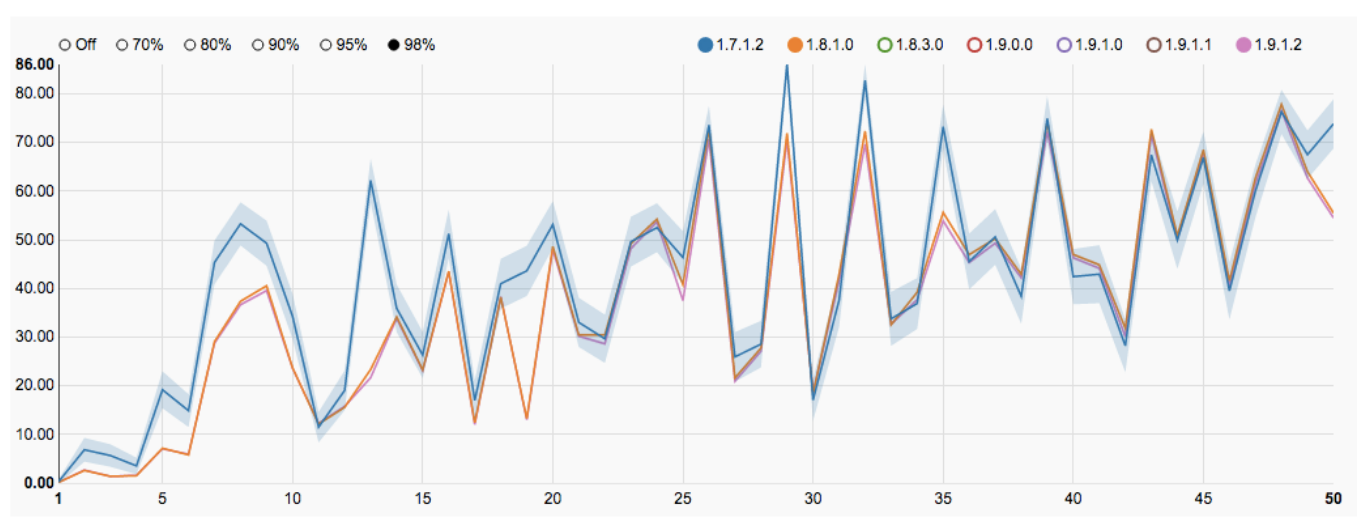
We have our own dashboard, an internal development based on the Cubes opensource solution. It is used not only by analysts, but also by game designers, managers, producers and other members of our friendly development team. With this dashboard (more precisely, a set of dashboards) for each project, both key indicators and their internal metrics, such as, for example, the complexity of match-3 levels, are tracked. Data for dashboards is prepared in the format of olap-cubes, which, in turn, contain aggregated data from the database of raw-events. Thanks to the choice of additive models for each graph, it is possible to perform a drilldown (decomposition into components) into the necessary categories. If desired, you can group or ungroup users to apply filters when rendering metrics. For example, you can do a drilldown by application version, level setting version, region and solvency, leaving only paying players from Australia with game version 1.8 and level 4 tuning version.
Of course, the most interesting combination of the default is the latest version of the game and the latest version of the levels, which are compared with the previous version. This allows the level designers to continuously monitor the current state of the project complexity curve, abstracting from the global analysis of the update, and quickly respond to deviations of indicators from the planned course.
Source: https://habr.com/ru/post/329910/
All Articles