Once again about storing logs in Zabbix

The topic of collecting and storing logs in Zabbix has been raised more than once . And not two . If you do not take into account that this is not a completely correct approach, seriously loading the base, such methods have another major drawback - they keep the logs in their entirety. And if in the case of the logs of routers or Linux you can somehow come to terms with this, then the event-log Windows starts to cause a lot of suffering, both to the Zabbix server and to the system administrator who decides to collect and store it. Below is about solving this problem.
Lyrical digression
All techies are already waiting in the next room, and we will pause for a while, take a breath, emerge from our cozy fluffy IT world with unicorns and try to determine whether the game is worth the candle. After all, there are specialized solutions, best practices and other words that completely kill the imagination and love of their collective farms with crutches. I am sincerely happy for people who have a full ELK stack, shards, fault tolerance and millions of log lines per second. These demigods rarely condescend from their radiant heights to us mere mortals. And because they do not understand the simple desire to monitor all their infrastructure and not be strangled by a toad. And monitoring includes not only numerical indicators. For example, the Windows Server security subsystem manipulates virtually only logs. And if there is no need to shoot a gun on sparrows, and there is already an established monitoring based on Zabbix, then why not expand its capabilities? I may say banality now, but monitoring the infrastructure is the cornerstone of a timely response to incidents, so the need to have such a tool as a collector and log analyzer compatible with Zabbix and consuming minimal resources in the arsenal should not be discussed.
')
For the cause!
Usually when processing an Event-log, the following scheme is followed.
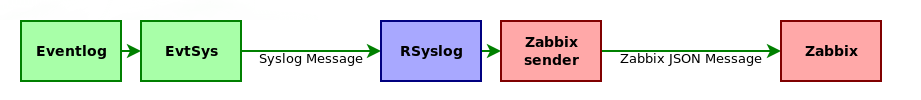
EvtSys is a tiny service that converts EventLog messages to Syslog standard.
This bundle has at least 2 drawbacks:
- Microsoft does not particularly stand on ceremony with the size of the log messages, often exceeding 4 kb, in which there is an error message, help information for the solution, and links to a deployed solution, horses, gypsies, and bears ... And so on. And this is despite the fact that, apart from the message itself, nothing else is needed. As a result, we store tons of useless information in the database, and the place on the disks is non-rubber.
- For each new message, RSyslog creates a new fork for zabbix_sender and with a large amount of incoming data, you can easily preempt yourself a server for collecting logs, which is also unpleasant.
That is why we uncover our bike builder and begin to sculpt our brave new world.
General concept
Our new vehicle will have a
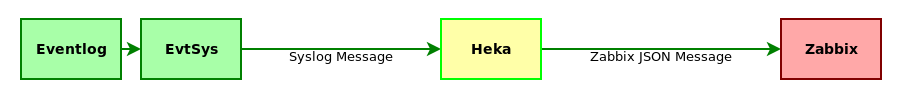
Heka is the heart of our pepelats. It is almost like Logstash, only the pipe is lower and the smoke is thinner. But without JRuby, and, therefore, not so demanding on resources and, moreover, amazingly bright. Quietly digests and processes several thousand log lines per second. Like that:

At the same time it is easily and naturally expanded with the help of plug-ins, which will be done in the future. The general logic of the system is as follows. Incoming messages EvtSys leads to the Syslog format and sends to Heka for processing. That parses the syslog message, selects the inside of the message (payload) and then parses the regular expression, creating a new log line. This string is transmitted directly to Zabbix using a self-written plug-in. Everything necessary is placed on a Zabbix server, on a separate machine or, as in our case, on a Zabbix proxy. This approach to the operation of the system eliminates both previously voiced deficiencies. We will understand in more detail how everything is arranged inside.
Configure EvtSys
I will not dwell on the configuration of EvtSys, it was repeatedly done before me, for example, here . I will note only the main points important for the work of the decision. EvtSys version must be at least 4.5. This is due to the fact that the installation will use the key -t. It is recommended to take the LP version, because it can send messages more than 2 kb, which is important for us. EvtSys installation command:
evtsys -i -h <heka_host> -p <heka_port> -f 17 -t <zabbix_host> For Windows logs, I use the facility local1, but you can use what suits you best. Special attention should be given to the -t parameter. It is necessary to specify the name of the network node exactly as it is indicated in Zabbix. This Heka field can be used to send messages to the right hosts in Zabbix.
Configuring Message Processing Pipeline
So we got to the most interesting and tasty part of our solution. I will not describe the Heka installation either, it is trivial to the horror and is well documented in the official documentation. Therefore, simply accept that Heka is already installed and proceed directly to its configuration. As in Logstash, a tag-based log conversion pipeline is implemented in Heka. The general path that the processed line passes is as follows:

Splitter and Filter may not be in the pipeline. In the end we will have it. Which path will go through the log line, through which filters and how it will appear as a result, is determined by conditions based on the fields of the internal presentation of the message in Heka. You can read more about this in the documentation , and now we need to form the following Heka work algorithm.
- Accept syslog message via UDP port.
- Decode syslog message, select an additional tag.
- Parse the text of the log line (payload) and select key parameters and values from it.
- Generate a new informative log line based on the selected values.
- Encode the log line as a json message for Zabbix.
- Send a coded message in Zabbix.
To implement the algorithm, we construct the functional blocks of the Heka conveyor as follows:

Separate explanations deserves MultiDecoder. It is a container for decoders that can be executed either all sequentially (this way is configured in the syslog-decoder), and before the first successful decoding (in the events-decoder). Now let's see how this is implemented in the Heka config. In order not to litter the main config, we place the whole configuration in a separate file. I have this /etc/heka/conf.d/20-eventlog.toml.
Heka config
Consider the settings of each component separately.
[eventlog] type = "UdpInput" address = ":10514" decoder = "syslog-decoder" Here in the settings we indicate that we will listen on all interfaces and take the port more than 1024, in order not to have problems with port access rights. This port must be specified in EvtSys as the port of the syslog server. We also immediately indicate the decoder to which we will transmit received messages.
[syslog-decoder] type = "MultiDecoder" subs = ["rsyslog-decoder", "events-decoder"] cascade_strategy = "all" #log_sub_errors = true As already stated above, this decoder is a container for other decoders with two types of behavior (execute all decoders or execute before the first successful decoding). The type of behavior is set by the cascade_strategy parameter and in this case it indicates that all decoders should be executed in the order specified in the subs parameter. To debug a multi-decoder, it is useful to use the log_sub_errors = true option. When instructed, Heka will write the decoding errors of the sub-decoders to its log.
[events-decoder] type = "MultiDecoder" subs = ["event-4624-decoder", "event-4625-decoder", "event-4724-decoder", "event-4738-decoder", "event-4740-decoder"] cascade_strategy = "first-wins" #log_sub_errors = true The Events-decoder is itself a multi-decoder, but its behavior strategy is different - first-wins. It causes the decoder to execute until one of the internal decoders returns successfully decoded data. This helps to process data in several patterns, as will be demonstrated later.
[rsyslog-decoder] type = "SandboxDecoder" filename = "lua_decoders/rsyslog.lua" [rsyslog-decoder.config] type = "RSYSLOG_TraditionalForwardFormat" template = '<%PRI%>%TIMESTAMP% %HOSTNAME% %HOSTNAME% %syslogtag:1:32%%msg:::sp-if-no-1st-sp%%msg%' tz = "Europe/Moscow" One of the standard decoders that is included in the Heka distribution, according to the author, supports log templates from RSyslog. But it seemed to me that not completely. Note the double parameter% HOSTNAME% in the log template. This is not a typo, I just could not configure the template so that the parameter passed through -t to EvtSys does not stick with the text of the message. And so we get practically what we need, except for one small kickshaw - at the end of the host name is a colon. We will remove it when encoding a message. You ask: what about the value of the Hostname field? And it's very simple - the new value just overwrites the old one.
Event decoders are all alike, like twin brothers, so I’ll only consider one. The differences in the rest relate only to regexpl for parsing and the output log line.
[event-4624-decoder] type = "PayloadRegexDecoder" match_regex = '^(?P<EventID>4624):(?:[^:]+:){10}\s(?P<Account>[^\s]+)[^:]+:\s(?P<Domain>[^\s]+)(?:[^:]+:){8}\s(?P<IP>[^\s]+)' [event-4624-decoder.message_fields] Type = "windows.eventlog" Key = 'eventlog.%EventID%' Value = ' %Domain%\%Account% %IP%.' This decoder runs the string through a regular expression and at the same time highlights its individual parts, which can be used to create additional message fields. Such fields will then be useful to us for creating the output message. The type of messages is also set here (Type field) in order to direct them to the corresponding output (associated with the corresponding encoder).
[ZabbixEncoder] type = "SandboxEncoder" filename = "lua_encoders/zabbix_trapper.lua" And now the jewel of our collection is a self-written plug-in for Lua. I will consider his work in due time (downstream of the text). It’s enough to write here that it encodes the message for Zabbix.
[event-out-zabbix] type = "TcpOutput" message_matcher = "Type == 'windows.eventlog'" address = "127.0.0.1:10051" encoder = "ZabbixEncoder" reconnect_after = 1 Logout for forwarding messages in Zabbix. It does not pass through everything, but only messages with the corresponding value in the Type field. Each message passes through the Encoder, which we described above.
I recommend paying special attention to the reconnect_after = 1 parameter. This is a very important parameter. The fact is that TcpOutput contains a bug and cannot support a TCP session for a long time. It looks like this: at a certain point Zabbix instead of full-fledged log messages starts to receive some sort of tweaks, and then it stops. If you look at the exchange between Heka and Zabbix via Wireshark, you can see that TcpOutput is starting to hit the packets and the connection is broken. As a result, to prevent this from happening, the above parameter is set, which causes TcpOutput to reconnect after each message sent to Zabbix. Yes, naturally, this creates an overhead, but I did not notice any significant increase in the load on the host with Heka, and on Zabbix-proxy. Maybe I just send a little message? ;)
Debugging Message Processing
To debug a pipeline, I recommend two things: RstEncoder and output to a file. RstEncoder encodes each message field with a text string, which allows you to see what fields the message consists of and how they are equal. Outputting to a file helps to keep track of what is encoded and what is being skipped and how it is encoded. You can organize output to a file like this:
[event-out-file] type = "FileOutput" message_matcher = "Type == 'windows.eventlog'" path = "/tmp/events.log" perm = "666" flush_count = 100 flush_operator = "OR" encoder = "RstEncoder" All parameters are clear here, I will explain only the purpose of the parameter flush_operator = “OR”. It indicates that new message portions should be added to the already existing log file. By changing the encoder, you can check the format of the recorded messages, and the message_matcher helps to make sure that the messages are of the correct type. Turning it off, we start recording everything. Sometimes it helps to detect an error in the message_matcher filter or that no messages are being generated.
Zabbix trapper
And here we come to the description of how the custom encoder works. All additional plugins should be in / usr / share / heka /. Since we have this encoder, we put it here - /usr/share/heka/lua_encoders/zabbix_trapper.lua. Let's see what kind of gears spinning inside him.
Zabbix Trapper Module for Heka
require "os" require "string" require "table" -- JSON. -- https://www.kyne.com.au/~mark/software/lua-cjson.php local cjson = require("cjson") function process_message() -- Zabbix. local host = read_message("Hostname") -- . local key = read_message("Fields[Key]") -- . local value = read_message("Fields[Value]") -- JSON-. local message = {} -- , syslog . message["host"] = string.sub(host, 1, -2) message["key"] = key message["value"] = value local buffer = {message} local zabbix_message = {} zabbix_message["request"] = "sender data" zabbix_message["data"] = buffer -- payload , , JSON. inject_payload("json", "Payload", cjson.encode(zabbix_message)) return 0 end The CJSON library should be in a place accessible by Lua, so I placed it in /usr/share/heka/lua_modules/cjson.so.
Zabbix Template
From the features of the template, it should be noted that the data elements should be of the Zabbix Trapper type, with the “Log (log)” information type and keys of the eventlog.1102 type.
Zabbix template
<?xml version="1.0" encoding="UTF-8"?> <zabbix_export> <version>3.0</version> <date>2016-10-01T13:30:30Z</date> <groups> <group> <name> </name> </group> </groups> <templates> <template> <template>Template Windows Users Audit</template> <name>Template Windows Users Audit</name> <description>, , .</description> <groups> <group> <name> </name> </group> </groups> <applications> <application> <name> </name> </application> <application> <name></name> </application> </applications> <items> <item> <name> .</name> <type>2</type> <snmp_community/> <multiplier>0</multiplier> <snmp_oid/> <key>eventlog.1102</key> <delay>0</delay> <history>1</history> <trends>0</trends> <status>0</status> <value_type>2</value_type> <allowed_hosts/> <units/> <delta>0</delta> <snmpv3_contextname/> <snmpv3_securityname/> <snmpv3_securitylevel>0</snmpv3_securitylevel> <snmpv3_authprotocol>0</snmpv3_authprotocol> <snmpv3_authpassphrase/> <snmpv3_privprotocol>0</snmpv3_privprotocol> <snmpv3_privpassphrase/> <formula>1</formula> <delay_flex/> <params/> <ipmi_sensor/> <data_type>0</data_type> <authtype>0</authtype> <username/> <password/> <publickey/> <privatekey/> <port/> <description> .</description> <inventory_link>0</inventory_link> <applications> <application> <name></name> </application> </applications> <valuemap/> <logtimefmt/> </item> <item> <name> .</name> <type>2</type> <snmp_community/> <multiplier>0</multiplier> <snmp_oid/> <key>eventlog.4624</key> <delay>0</delay> <history>1</history> <trends>0</trends> <status>0</status> <value_type>2</value_type> <allowed_hosts/> <units/> <delta>0</delta> <snmpv3_contextname/> <snmpv3_securityname/> <snmpv3_securitylevel>0</snmpv3_securitylevel> <snmpv3_authprotocol>0</snmpv3_authprotocol> <snmpv3_authpassphrase/> <snmpv3_privprotocol>0</snmpv3_privprotocol> <snmpv3_privpassphrase/> <formula>1</formula> <delay_flex/> <params/> <ipmi_sensor/> <data_type>0</data_type> <authtype>0</authtype> <username/> <password/> <publickey/> <privatekey/> <port/> <description> .</description> <inventory_link>0</inventory_link> <applications> <application> <name></name> </application> </applications> <valuemap/> <logtimefmt/> </item> <item> <name> .</name> <type>2</type> <snmp_community/> <multiplier>0</multiplier> <snmp_oid/> <key>eventlog.4625</key> <delay>0</delay> <history>1</history> <trends>0</trends> <status>0</status> <value_type>2</value_type> <allowed_hosts/> <units/> <delta>0</delta> <snmpv3_contextname/> <snmpv3_securityname/> <snmpv3_securitylevel>0</snmpv3_securitylevel> <snmpv3_authprotocol>0</snmpv3_authprotocol> <snmpv3_authpassphrase/> <snmpv3_privprotocol>0</snmpv3_privprotocol> <snmpv3_privpassphrase/> <formula>1</formula> <delay_flex/> <params/> <ipmi_sensor/> <data_type>0</data_type> <authtype>0</authtype> <username/> <password/> <publickey/> <privatekey/> <port/> <description> .</description> <inventory_link>0</inventory_link> <applications> <application> <name></name> </application> </applications> <valuemap/> <logtimefmt/> </item> <item> <name> .</name> <type>2</type> <snmp_community/> <multiplier>0</multiplier> <snmp_oid/> <key>eventlog.4720</key> <delay>0</delay> <history>1</history> <trends>0</trends> <status>0</status> <value_type>2</value_type> <allowed_hosts/> <units/> <delta>0</delta> <snmpv3_contextname/> <snmpv3_securityname/> <snmpv3_securitylevel>0</snmpv3_securitylevel> <snmpv3_authprotocol>0</snmpv3_authprotocol> <snmpv3_authpassphrase/> <snmpv3_privprotocol>0</snmpv3_privprotocol> <snmpv3_privpassphrase/> <formula>1</formula> <delay_flex/> <params/> <ipmi_sensor/> <data_type>0</data_type> <authtype>0</authtype> <username/> <password/> <publickey/> <privatekey/> <port/> <description> .</description> <inventory_link>0</inventory_link> <applications> <application> <name></name> </application> </applications> <valuemap/> <logtimefmt/> </item> <item> <name> .</name> <type>2</type> <snmp_community/> <multiplier>0</multiplier> <snmp_oid/> <key>eventlog.4724</key> <delay>0</delay> <history>1</history> <trends>0</trends> <status>0</status> <value_type>2</value_type> <allowed_hosts/> <units/> <delta>0</delta> <snmpv3_contextname/> <snmpv3_securityname/> <snmpv3_securitylevel>0</snmpv3_securitylevel> <snmpv3_authprotocol>0</snmpv3_authprotocol> <snmpv3_authpassphrase/> <snmpv3_privprotocol>0</snmpv3_privprotocol> <snmpv3_privpassphrase/> <formula>1</formula> <delay_flex/> <params/> <ipmi_sensor/> <data_type>0</data_type> <authtype>0</authtype> <username/> <password/> <publickey/> <privatekey/> <port/> <description> .</description> <inventory_link>0</inventory_link> <applications> <application> <name></name> </application> </applications> <valuemap/> <logtimefmt/> </item> <item> <name> .</name> <type>2</type> <snmp_community/> <multiplier>0</multiplier> <snmp_oid/> <key>eventlog.4725</key> <delay>0</delay> <history>1</history> <trends>0</trends> <status>0</status> <value_type>2</value_type> <allowed_hosts/> <units/> <delta>0</delta> <snmpv3_contextname/> <snmpv3_securityname/> <snmpv3_securitylevel>0</snmpv3_securitylevel> <snmpv3_authprotocol>0</snmpv3_authprotocol> <snmpv3_authpassphrase/> <snmpv3_privprotocol>0</snmpv3_privprotocol> <snmpv3_privpassphrase/> <formula>1</formula> <delay_flex/> <params/> <ipmi_sensor/> <data_type>0</data_type> <authtype>0</authtype> <username/> <password/> <publickey/> <privatekey/> <port/> <description> .</description> <inventory_link>0</inventory_link> <applications> <application> <name></name> </application> </applications> <valuemap/> <logtimefmt/> </item> <item> <name> .</name> <type>2</type> <snmp_community/> <multiplier>0</multiplier> <snmp_oid/> <key>eventlog.4726</key> <delay>0</delay> <history>1</history> <trends>0</trends> <status>0</status> <value_type>2</value_type> <allowed_hosts/> <units/> <delta>0</delta> <snmpv3_contextname/> <snmpv3_securityname/> <snmpv3_securitylevel>0</snmpv3_securitylevel> <snmpv3_authprotocol>0</snmpv3_authprotocol> <snmpv3_authpassphrase/> <snmpv3_privprotocol>0</snmpv3_privprotocol> <snmpv3_privpassphrase/> <formula>1</formula> <delay_flex/> <params/> <ipmi_sensor/> <data_type>0</data_type> <authtype>0</authtype> <username/> <password/> <publickey/> <privatekey/> <port/> <description> .</description> <inventory_link>0</inventory_link> <applications> <application> <name></name> </application> </applications> <valuemap/> <logtimefmt/> </item> <item> <name> .</name> <type>2</type> <snmp_community/> <multiplier>0</multiplier> <snmp_oid/> <key>eventlog.4731</key> <delay>0</delay> <history>1</history> <trends>0</trends> <status>0</status> <value_type>2</value_type> <allowed_hosts/> <units/> <delta>0</delta> <snmpv3_contextname/> <snmpv3_securityname/> <snmpv3_securitylevel>0</snmpv3_securitylevel> <snmpv3_authprotocol>0</snmpv3_authprotocol> <snmpv3_authpassphrase/> <snmpv3_privprotocol>0</snmpv3_privprotocol> <snmpv3_privpassphrase/> <formula>1</formula> <delay_flex/> <params/> <ipmi_sensor/> <data_type>0</data_type> <authtype>0</authtype> <username/> <password/> <publickey/> <privatekey/> <port/> <description> .</description> <inventory_link>0</inventory_link> <applications> <application> <name> </name> </application> </applications> <valuemap/> <logtimefmt/> </item> <item> <name> .</name> <type>2</type> <snmp_community/> <multiplier>0</multiplier> <snmp_oid/> <key>eventlog.4732</key> <delay>0</delay> <history>1</history> <trends>0</trends> <status>0</status> <value_type>2</value_type> <allowed_hosts/> <units/> <delta>0</delta> <snmpv3_contextname/> <snmpv3_securityname/> <snmpv3_securitylevel>0</snmpv3_securitylevel> <snmpv3_authprotocol>0</snmpv3_authprotocol> <snmpv3_authpassphrase/> <snmpv3_privprotocol>0</snmpv3_privprotocol> <snmpv3_privpassphrase/> <formula>1</formula> <delay_flex/> <params/> <ipmi_sensor/> <data_type>0</data_type> <authtype>0</authtype> <username/> <password/> <publickey/> <privatekey/> <port/> <description> .</description> <inventory_link>0</inventory_link> <applications> <application> <name> </name> </application> </applications> <valuemap/> <logtimefmt/> </item> <item> <name> .</name> <type>2</type> <snmp_community/> <multiplier>0</multiplier> <snmp_oid/> <key>eventlog.4733</key> <delay>0</delay> <history>1</history> <trends>0</trends> <status>0</status> <value_type>2</value_type> <allowed_hosts/> <units/> <delta>0</delta> <snmpv3_contextname/> <snmpv3_securityname/> <snmpv3_securitylevel>0</snmpv3_securitylevel> <snmpv3_authprotocol>0</snmpv3_authprotocol> <snmpv3_authpassphrase/> <snmpv3_privprotocol>0</snmpv3_privprotocol> <snmpv3_privpassphrase/> <formula>1</formula> <delay_flex/> <params/> <ipmi_sensor/> <data_type>0</data_type> <authtype>0</authtype> <username/> <password/> <publickey/> <privatekey/> <port/> <description> .</description> <inventory_link>0</inventory_link> <applications> <application> <name> </name> </application> </applications> <valuemap/> <logtimefmt/> </item> <item> <name> .</name> <type>2</type> <snmp_community/> <multiplier>0</multiplier> <snmp_oid/> <key>eventlog.4734</key> <delay>0</delay> <history>1</history> <trends>0</trends> <status>0</status> <value_type>2</value_type> <allowed_hosts/> <units/> <delta>0</delta> <snmpv3_contextname/> <snmpv3_securityname/> <snmpv3_securitylevel>0</snmpv3_securitylevel> <snmpv3_authprotocol>0</snmpv3_authprotocol> <snmpv3_authpassphrase/> <snmpv3_privprotocol>0</snmpv3_privprotocol> <snmpv3_privpassphrase/> <formula>1</formula> <delay_flex/> <params/> <ipmi_sensor/> <data_type>0</data_type> <authtype>0</authtype> <username/> <password/> <publickey/> <privatekey/> <port/> <description> .</description> <inventory_link>0</inventory_link> <applications> <application> <name> </name> </application> </applications> <valuemap/> <logtimefmt/> </item> <item> <name> .</name> <type>2</type> <snmp_community/> <multiplier>0</multiplier> <snmp_oid/> <key>eventlog.4735</key> <delay>0</delay> <history>1</history> <trends>0</trends> <status>0</status> <value_type>2</value_type> <allowed_hosts/> <units/> <delta>0</delta> <snmpv3_contextname/> <snmpv3_securityname/> <snmpv3_securitylevel>0</snmpv3_securitylevel> <snmpv3_authprotocol>0</snmpv3_authprotocol> <snmpv3_authpassphrase/> <snmpv3_privprotocol>0</snmpv3_privprotocol> <snmpv3_privpassphrase/> <formula>1</formula> <delay_flex/> <params/> <ipmi_sensor/> <data_type>0</data_type> <authtype>0</authtype> <username/> <password/> <publickey/> <privatekey/> <port/> <description> .</description> <inventory_link>0</inventory_link> <applications> <application> <name> </name> </application> </applications> <valuemap/> <logtimefmt/> </item> <item> <name> .</name> <type>2</type> <snmp_community/> <multiplier>0</multiplier> <snmp_oid/> <key>eventlog.4738</key> <delay>0</delay> <history>1</history> <trends>0</trends> <status>0</status> <value_type>2</value_type> <allowed_hosts/> <units/> <delta>0</delta> <snmpv3_contextname/> <snmpv3_securityname/> <snmpv3_securitylevel>0</snmpv3_securitylevel> <snmpv3_authprotocol>0</snmpv3_authprotocol> <snmpv3_authpassphrase/> <snmpv3_privprotocol>0</snmpv3_privprotocol> <snmpv3_privpassphrase/> <formula>1</formula> <delay_flex/> <params/> <ipmi_sensor/> <data_type>0</data_type> <authtype>0</authtype> <username/> <password/> <publickey/> <privatekey/> <port/> <description> .</description> <inventory_link>0</inventory_link> <applications> <application> <name></name> </application> </applications> <valuemap/> <logtimefmt/> </item> <item> <name> .</name> <type>2</type> <snmp_community/> <multiplier>0</multiplier> <snmp_oid/> <key>eventlog.4740</key> <delay>0</delay> <history>1</history> <trends>0</trends> <status>0</status> <value_type>2</value_type> <allowed_hosts/> <units/> <delta>0</delta> <snmpv3_contextname/> <snmpv3_securityname/> <snmpv3_securitylevel>0</snmpv3_securitylevel> <snmpv3_authprotocol>0</snmpv3_authprotocol> <snmpv3_authpassphrase/> <snmpv3_privprotocol>0</snmpv3_privprotocol> <snmpv3_privpassphrase/> <formula>1</formula> <delay_flex/> <params/> <ipmi_sensor/> <data_type>0</data_type> <authtype>0</authtype> <username/> <password/> <publickey/> <privatekey/> <port/> <description> .</description> <inventory_link>0</inventory_link> <applications> <application> <name></name> </application> </applications> <valuemap/> <logtimefmt/> </item> <item> <name> .</name> <type>2</type> <snmp_community/> <multiplier>0</multiplier> <snmp_oid/> <key>eventlog.4781</key> <delay>0</delay> <history>1</history> <trends>0</trends> <status>0</status> <value_type>2</value_type> <allowed_hosts/> <units/> <delta>0</delta> <snmpv3_contextname/> <snmpv3_securityname/> <snmpv3_securitylevel>0</snmpv3_securitylevel> <snmpv3_authprotocol>0</snmpv3_authprotocol> <snmpv3_authpassphrase/> <snmpv3_privprotocol>0</snmpv3_privprotocol> <snmpv3_privpassphrase/> <formula>1</formula> <delay_flex/> <params/> <ipmi_sensor/> <data_type>0</data_type> <authtype>0</authtype> <username/> <password/> <publickey/> <privatekey/> <port/> <description> .</description> <inventory_link>0</inventory_link> <applications> <application> <name></name> </application> </applications> <valuemap/> <logtimefmt/> </item> </items> <discovery_rules/> <macros/> <templates/> <screens/> </template> </templates> <triggers> <trigger> <expression>{Template Windows Users Audit:eventlog.4732.nodata(120)}=0</expression> <name>{HOST.NAME}: .</name> <url/> <status>0</status> <priority>4</priority> <description>{HOST.NAME}: . {ITEM.LASTVALUE}</description> <type>0</type> <dependencies/> </trigger> <trigger> <expression>{Template Windows Users Audit:eventlog.1102.nodata(120)}=0</expression> <name>{HOST.NAME}: .</name> <url/> <status>0</status> <priority>4</priority> <description>{HOST.NAME}: . {ITEM.LASTVALUE}</description> <type>0</type> <dependencies/> </trigger> <trigger> <expression>{Template Windows Users Audit:eventlog.4740.nodata(120)}=0</expression> <name>{HOST.NAME}: .</name> <url/> <status>0</status> <priority>3</priority> <description>{HOST.NAME}: . {ITEM.LASTVALUE}</description> <type>0</type> <dependencies/> </trigger> <trigger> <expression>{Template Windows Users Audit:eventlog.4735.nodata(120)}=0</expression> <name>{HOST.NAME}: .</name> <url/> <status>0</status> <priority>4</priority> <description>{HOST.NAME}: . {ITEM.LASTVALUE}</description> <type>0</type> <dependencies/> </trigger> <trigger> <expression>{Template Windows Users Audit:eventlog.4738.nodata(120)}=0</expression> <name>{HOST.NAME}: .</name> <url/> <status>0</status> <priority>4</priority> <description>{HOST.NAME}: . {ITEM.LASTVALUE}</description> <type>0</type> <dependencies/> </trigger> <trigger> <expression>{Template Windows Users Audit:eventlog.4781.nodata(120)}=0</expression> <name>{HOST.NAME}: .</name> <url/> <status>0</status> <priority>4</priority> <description>{HOST.NAME}: . {ITEM.LASTVALUE}</description> <type>0</type> <dependencies/> </trigger> <trigger> <expression>{Template Windows Users Audit:eventlog.4725.nodata(120)}=0</expression> <name>{HOST.NAME}: .</name> <url/> <status>0</status> <priority>4</priority> <description>{HOST.NAME}: . {ITEM.LASTVALUE}</description> <type>0</type> <dependencies/> </trigger> <trigger> <expression>{Template Windows Users Audit:eventlog.4724.nodata(120)}=0</expression> <name>{HOST.NAME}: .</name> <url/> <status>0</status> <priority>4</priority> <description>{HOST.NAME}: . {ITEM.LASTVALUE}</description> <type>0</type> <dependencies/> </trigger> <trigger> <expression>{Template Windows Users Audit:eventlog.4731.nodata(120)}=0</expression> <name>{HOST.NAME}: .</name> <url/> <status>0</status> <priority>4</priority> <description>{HOST.NAME}: . {ITEM.LASTVALUE}</description> <type>0</type> <dependencies/> </trigger> <trigger> <expression>{Template Windows Users Audit:eventlog.4720.nodata(120)}=0</expression> <name>{HOST.NAME}: .</name> <url/> <status>0</status> <priority>4</priority> <description>{HOST.NAME}: . {ITEM.LASTVALUE}</description> <type>0</type> <dependencies/> </trigger> <trigger> <expression>{Template Windows Users Audit:eventlog.4734.nodata(120)}=0</expression> <name>{HOST.NAME}: .</name> <url/> <status>0</status> <priority>3</priority> <description>{HOST.NAME}: . {ITEM.LASTVALUE}</description> <type>0</type> <dependencies/> </trigger> <trigger> <expression>{Template Windows Users Audit:eventlog.4726.nodata(120)}=0</expression> <name>{HOST.NAME}: .</name> <url/> <status>0</status> <priority>3</priority> <description>{HOST.NAME}: . {ITEM.LASTVALUE}</description> <type>0</type> <dependencies/> </trigger> <trigger> <expression>{Template Windows Users Audit:eventlog.4733.nodata(120)}=0</expression> <name>{HOST.NAME}: .</name> <url/> <status>0</status> <priority>3</priority> <description>{HOST.NAME}: . {ITEM.LASTVALUE}</description> <type>0</type> <dependencies/> </trigger> <trigger> <expression>{Template Windows Users Audit:eventlog.4624.nodata(10)}=0</expression> <name>{HOST.NAME}: .</name> <url/> <status>0</status> <priority>1</priority> <description>{HOST.NAME}: . {ITEM.LASTVALUE}</description> <type>0</type> <dependencies/> </trigger> <trigger> <expression>{Template Windows Users Audit:eventlog.4625.nodata(120)}=0</expression> <name>{HOST.NAME}: .</name> <url/> <status>0</status> <priority>2</priority> <description>{HOST.NAME}: . {ITEM.LASTVALUE}</description> <type>0</type> <dependencies/> </trigger> </triggers> </zabbix_export> Probably, you have already paid attention to the strange device of triggers. Since we do not have a threshold value, and the incoming data is not constant, such a construction of triggers seemed to me the most correct. The trigger burns for 2 minutes, while at the high importance the corresponding notifications are sent and the event is not lost.
And what is the result?
The system turned out of the set up and forget. He has been working hard in the field of operation for several months without requiring any maintenance. Of course, like any good system, it has the potential for expansion. From what is planned in the future:
- A wide range of events.
- Template optimization.
- Support for sending events in batches (will be fine with a large flow).
- More optimal opening and closing of TCP connections (reduce overhead).
Well, and under the curtain a bit of analytics - graphics of the Zabbix-server queue at direct logging to the database and after optimization.

A pathetic attempt to enable direct logging - you can see how the queue is growing without limit, and then Zabbix cracks in half, the patient was barely able to save. One host was logged with a rather high load on the security log.
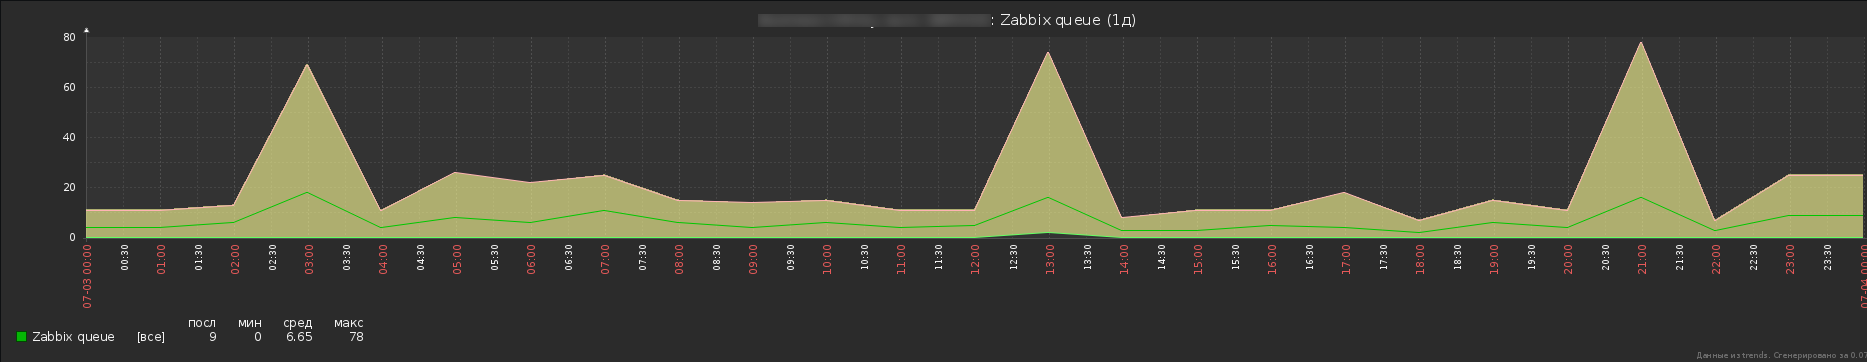
So already more like the truth. Yes, a number of messages are still stuck in the queue, but this is not a problem with Windows logs, and in general, the performance gain can be estimated from the total queue length. In addition, two hosts are monitored here, there are no fewer messages, but the load of this particular monitoring subsystem is successfully lost against the general background.
PSNot claiming anything, it was interesting to share my decision. If someone knows the alternative, I will be glad to your comments.
Source: https://habr.com/ru/post/329794/
All Articles