Meine Überwachung-2: technology and technology
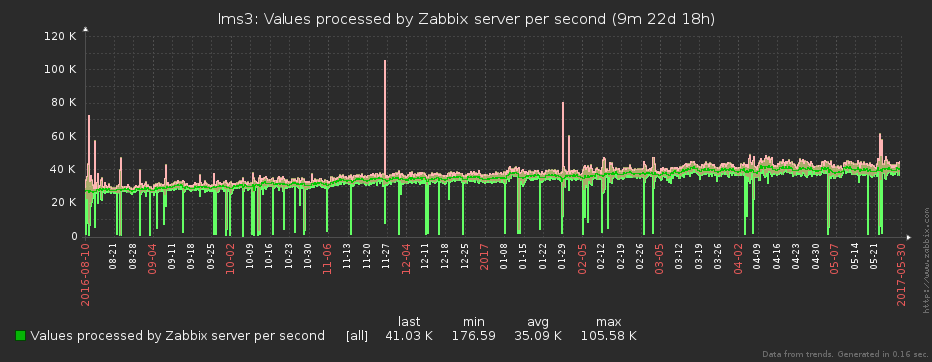
In the first part of the article about our monitoring system, we told you what organizational and technical problems led us to expand the functionality of Zabbix. In this one, we will show exactly how we manage to “digest” millions of samples taken every second and turn them into 40K + values-per-second without losing key information.
One of the “patients” of monitoring is its potential incompleteness. In especially clinical cases, you can have a deployed server, services configured and running on it, and ... find out about some problems on it solely upon the fact that the service-consumer has fallen, because monitoring knows about all this good "absolutely nothing."
In order to avoid such situations, in addition to official instructions, we tried to make the most of the technical means of monitoring the situation.
')
When admins deploy a new server, they connect it to Spacewalk (a free alternative to the Red Hat Network Satellite). This useful thing deploys configs and software on the server, including everything needed for monitoring. This includes installing our sbis3mon-discovery-scripts package, a lightweight Python utility that runs “kroon” every hour, scans the server and sends the data about the found services to the Discovery Registry .
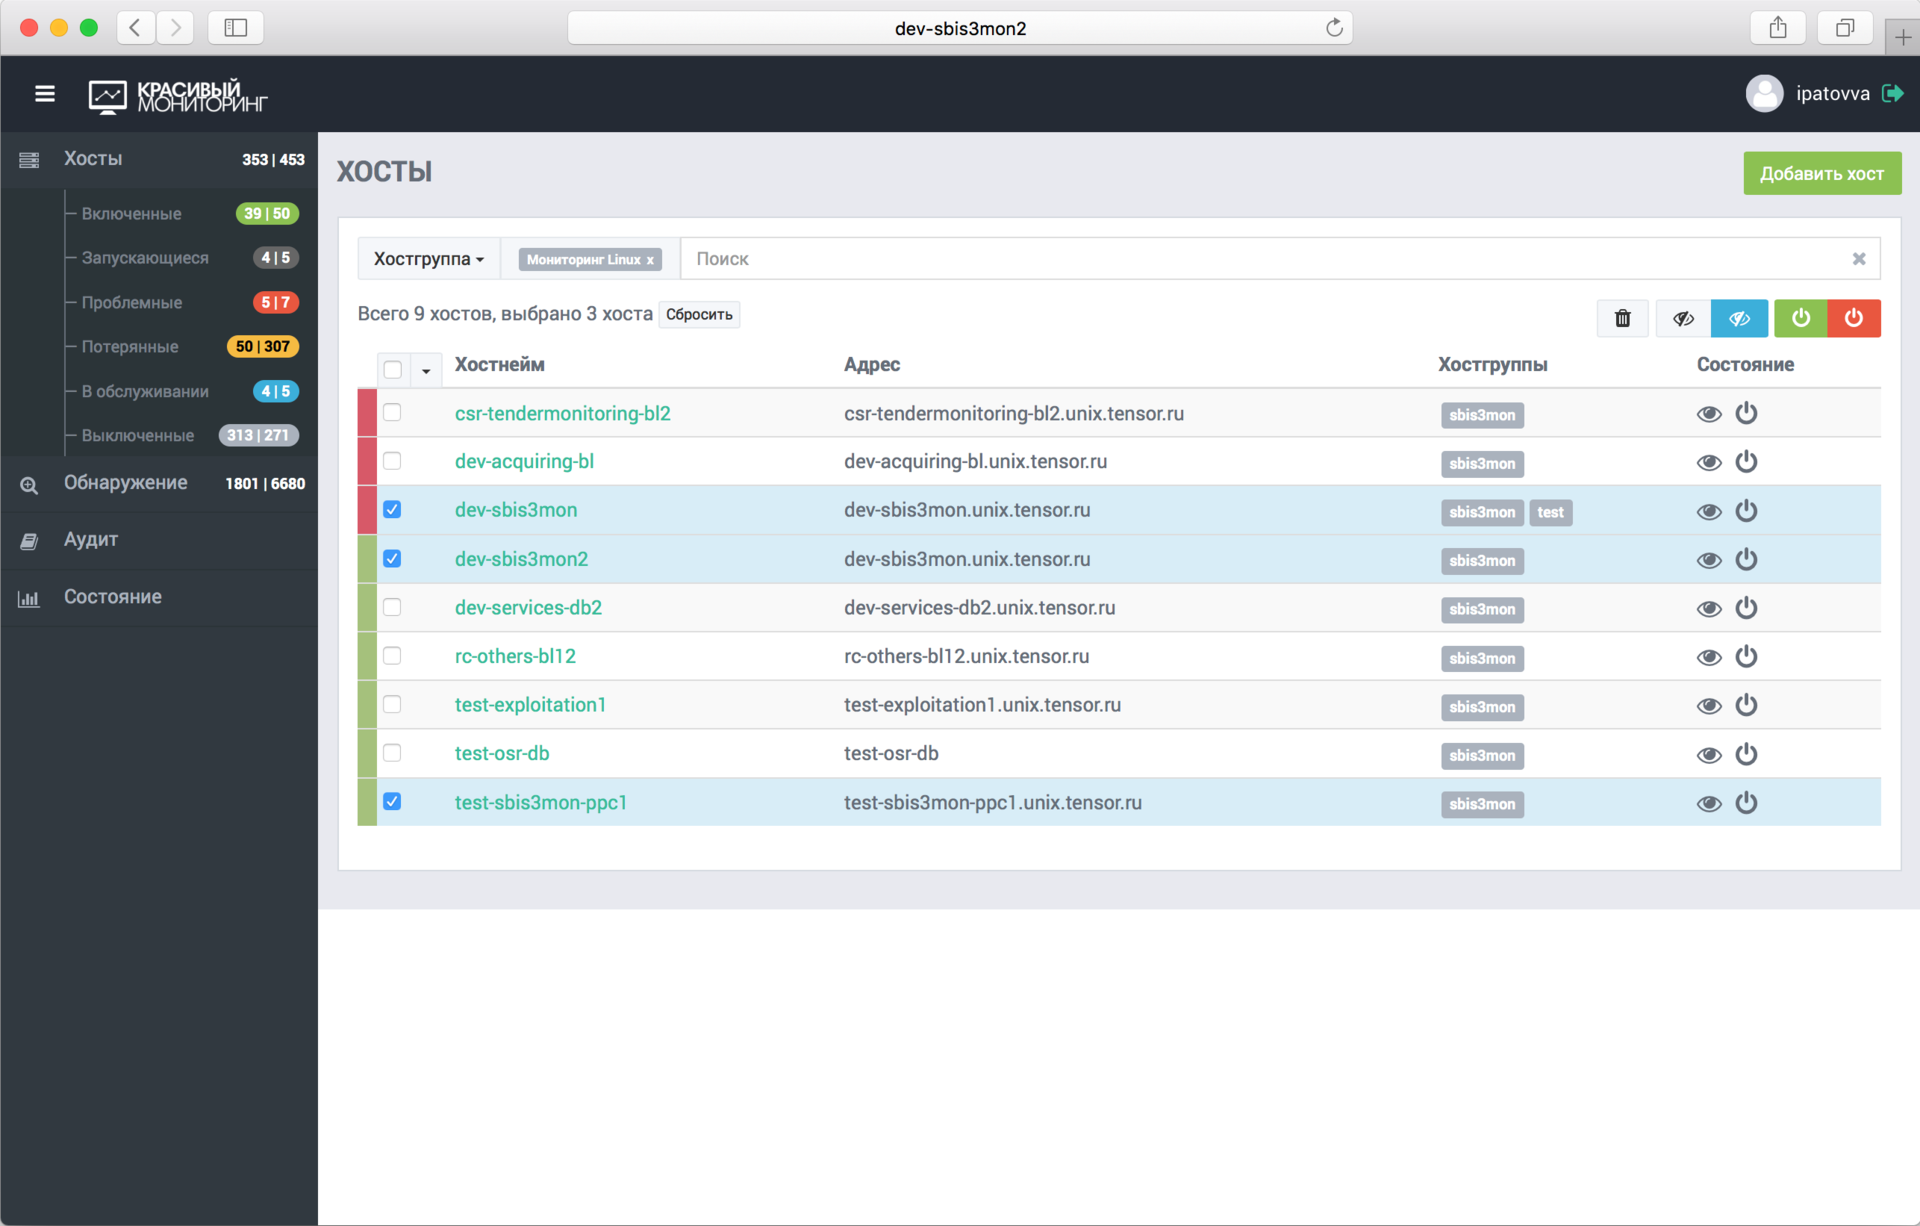
Thus, sbis3mon has the ability to query from the registry data about servers and services that can be monitored. Now you can enable monitoring of the server and its services in one click, simply by selecting it from the list in the admin panel.
The image is clickable and opens in the current tab of the web browser.
Automatically picked up all the services found. If in the future another service will be deployed on this server, it will also be added to monitoring already without the participation of admins.
Of course, it is possible to add a server manually or by cloning.
At that moment, when the administrator added a server or connected a new service to monitor, the corresponding plug-ins are launched and the control transport connections are established:
In most cases, this connection is the only one installed to the service, and it lives either until disconnecting or until the first error. In the latter case, an attempt to reconnect occurs automatically at a specified interval.
We try to use the available native service interfaces to get statistics. With the exception of monitoring Windows and IIS, we do not use agents. Although now there is an idea how to get rid of them.
After the connection is established, the plugin receives a configuration from the service: a list of its entities (a list of databases, a list of mounted drives, or active network interfaces, ...).
The image is clickable and opens in the current tab of the web browser.
The plugin sends the list of entities to the zabbixSync module, which is responsible for creating or synchronizing the “host” and the structures described by the plugin in Zabbix: items, graphs, screenshots (dashboards) and triggers. Yes, all the visualization and logic of the triggers are also part of the code.
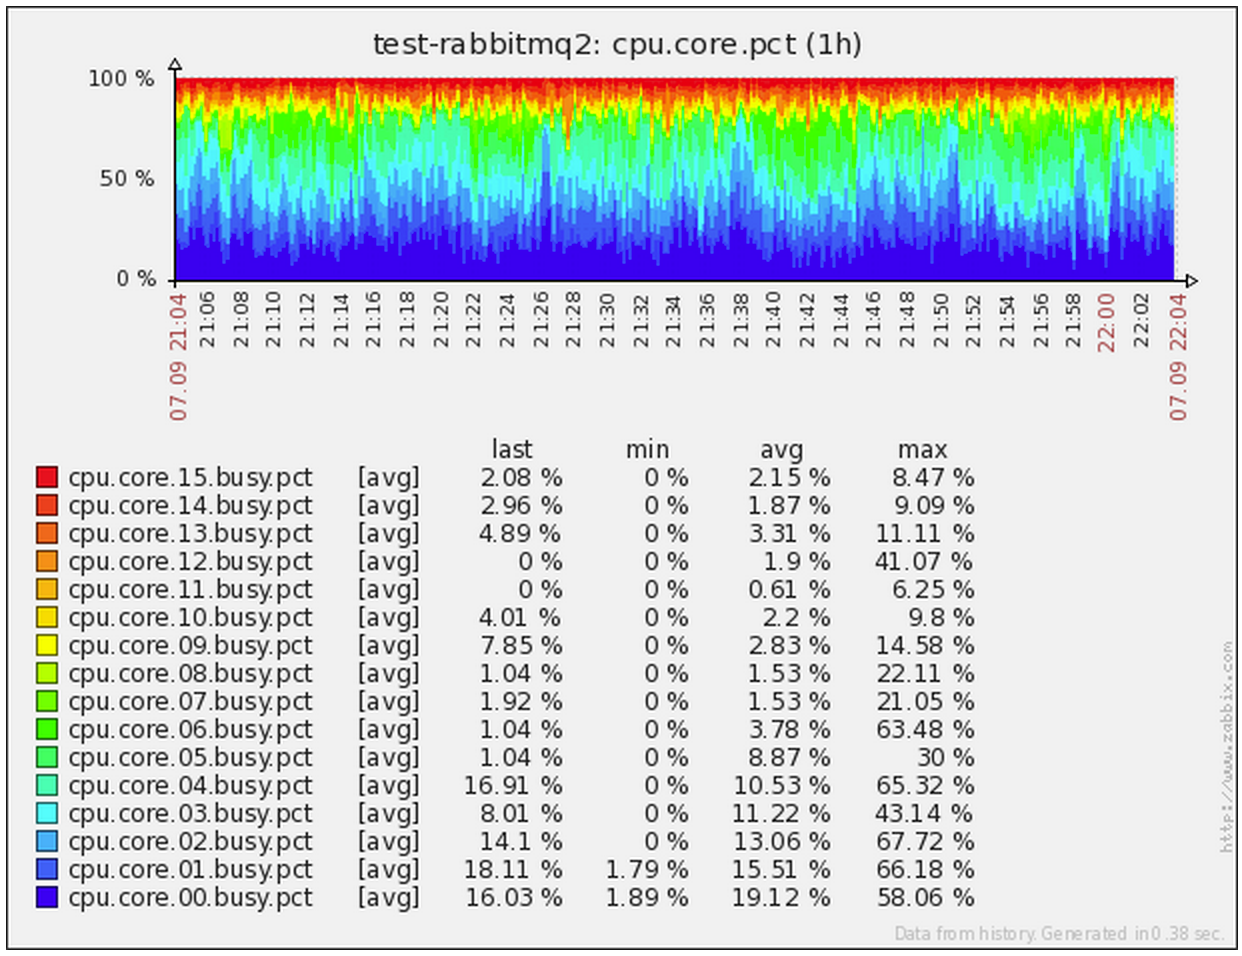
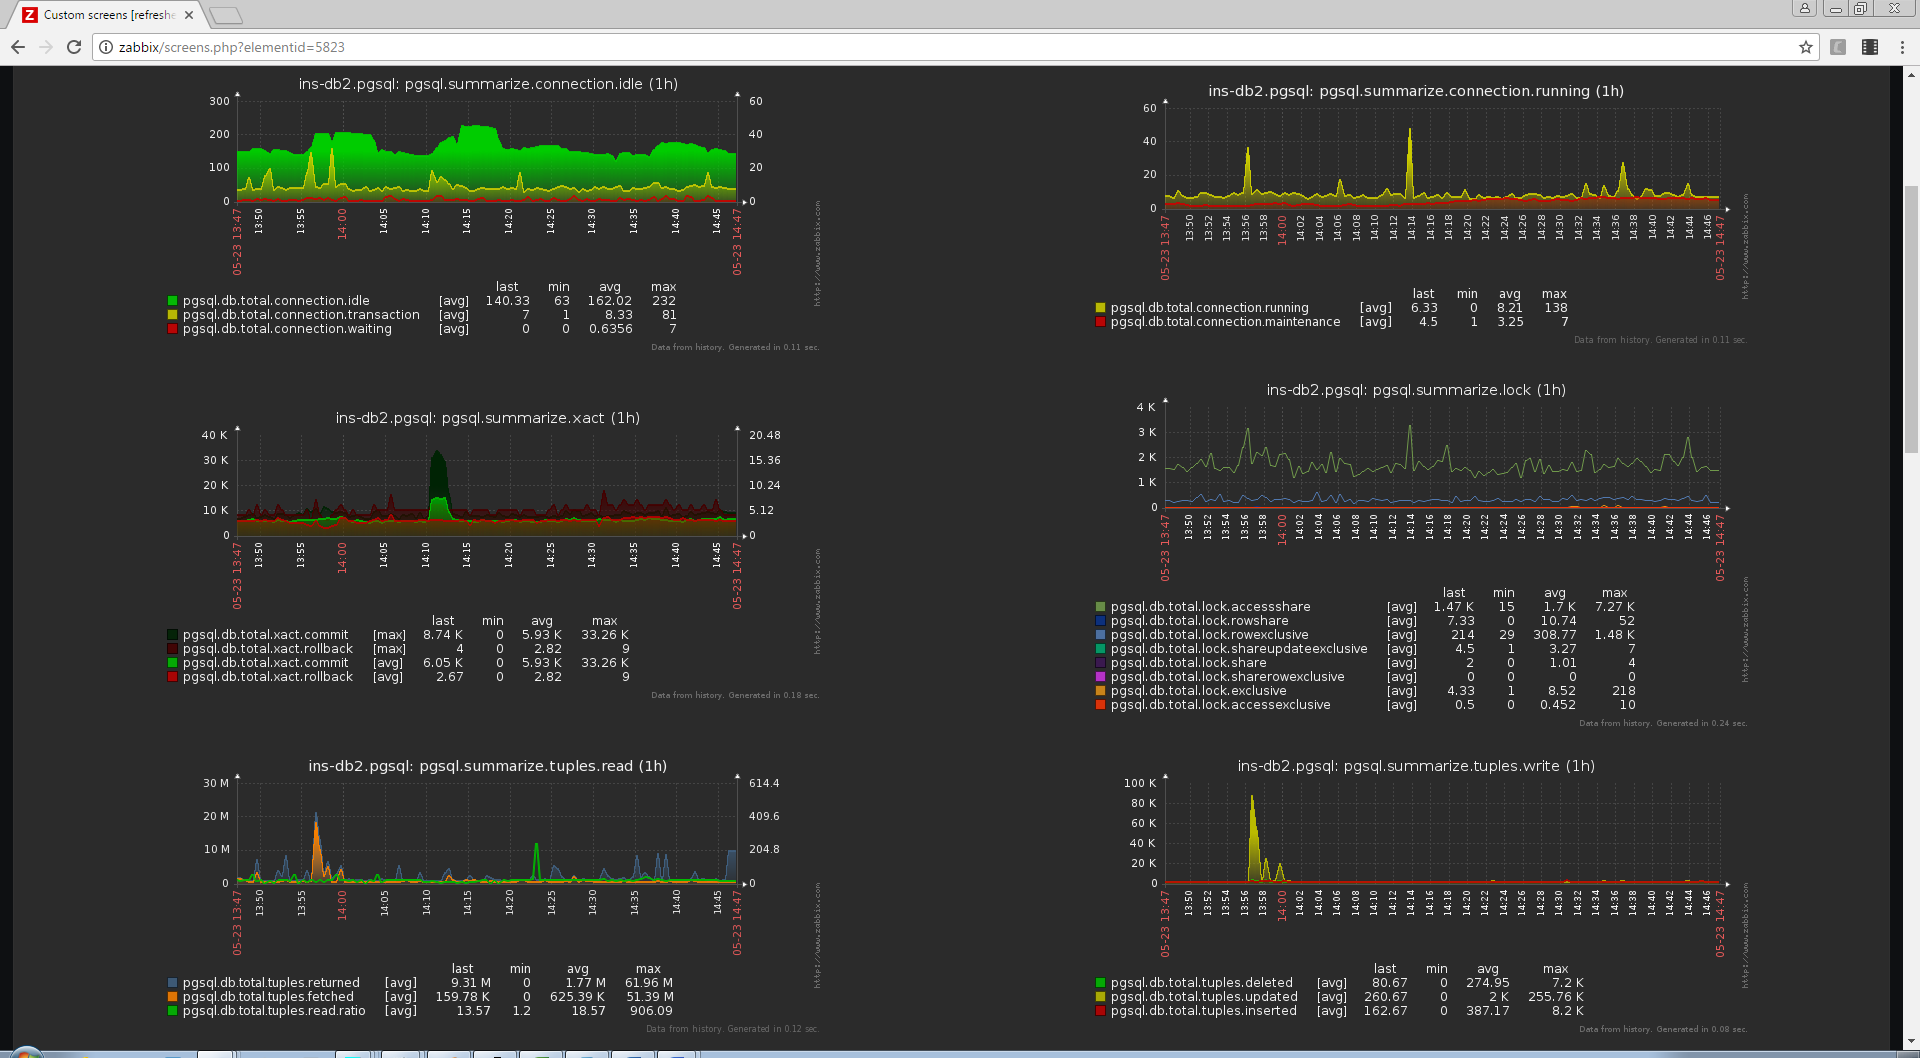
Each entity generates its own complex screen, which allows you to immediately visually assess the presence of problems or anomalies. Sometimes also summary screens are created on which information on a group of entities may be reflected - for example, statistics for all databases in a specific PostgreSQL instance or CPU load on each of the business logic units serving one service.
In general, we succeeded in developing, what exactly and why we want to shoot, how it can be done most effectively, how to bring it all out “beautifully and clearly”, time is spent on each plug-in even more than on the implementation of data collection itself. .
The image is clickable and opens in the current tab of the web browser.
Simultaneously with synchronization with Zabbix, at predetermined intervals, polling of the specified services begins. For each of the corresponding plug-ins, the coordinator creates and sends a task for execution.
The plugin can process, aggregate and convert the received information in various ways before sending it further - it all depends on the logic embedded in it.
For example, the linux server monitoring plugin is structured like this:
Usually, I’ll eat the metrics in almost every system using the “asked - learned” principle, and it’s important that you have the opportunity to ask what you need. When you have a high-load system, everything changes radically.
Therefore, in particularly critical cases, we read the data even with a minimum quantum of 1 second . Due to this, we don’t miss the problems that arose between neighboring shoots at a lower frequency.
We try to keep the load on target servers to a minimum, so we are already parsing the answers on the side of the monitoring collector. In this case, for one request, we immediately get the maximum of the required data, which also gives the synchronism of the metrics in time. But the main thing is not to force the target system to do too much, which is not really required.
We have chosen NodeJS as the core of our system - and this is no accident . In addition to the ease of development, an active community and a library of modules for all occasions , it has a big and fat plus in the form of asynchrony “out of the box”, ideally suited to our tasks.
From the description of our data acquisition technique, it is clear that most of the time each plugin does not do anything, waiting for a new piece of data from the source to be received in the active connection. It turns out that within one process we can simultaneously efficiently serve a large number of such connections. And the asynchronous kernel allows us to do it easily and conveniently!
Of course, in order not to overload the eventloop of the collector process , we also constantly monitor it (just like in this article ), and redistribute tasks in accordance with the load.
The image is clickable and opens in the current tab of the web browser.
Ultimately, the received data is sent further - to the approximation module.
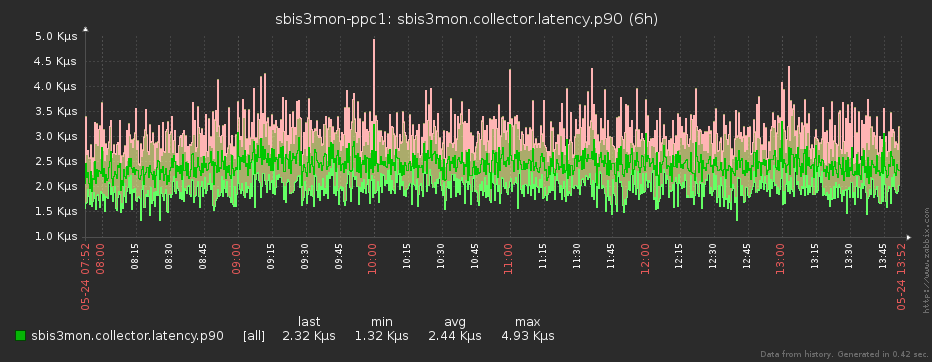
It is clear that even if we remove data in seconds, then neither Zabbix, nor the person looking at it, there is no happiness at all. One will "fall" under load (we remember that data is being removed from several thousand servers), the other "eyes will flow out" from the leapfrog on the graph.
To make it easier for everyone, before sending to Zabbix, we “compress” the resulting array of source samples to the interval specified in the plugin for a specific metric. But this is not just an averaging of values - with it we would irretrievably lose information about maxima and minima over the interval. Everything is a little trickier.
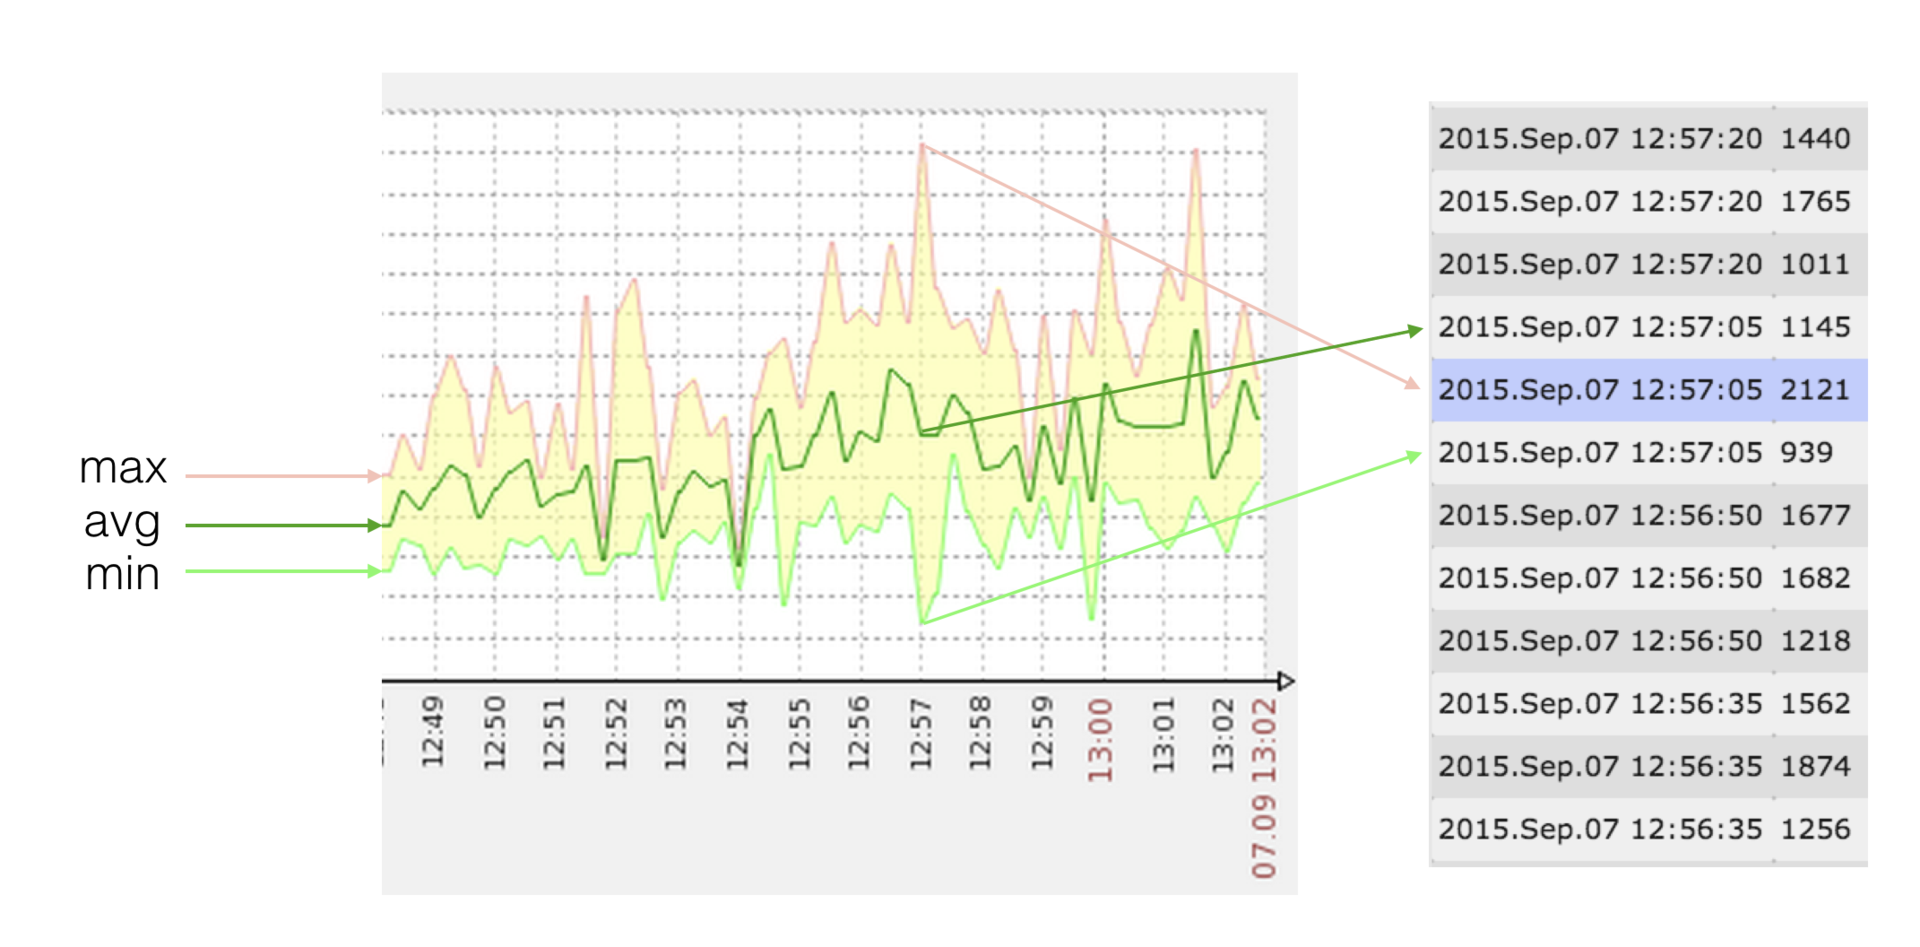
Since Zabbix allows min / max / avg values of a metric to be displayed on its graphs, and there can be several values at each point (timestamp), this is what we used.
The image is clickable and opens in the current tab of the web browser.
Suppose we have a rarely changing metric (the amount of used disk space), which we remove per minute, and we want to see one value per hour:
Now let's take the CPU load, which we are shooting off every second, and we only want to see the new points once every 10 seconds:
What is the difficulty?
We have to send a set of values to Zabbix such that {min, max, avg} (zabbix) = {min, max, avg} (source) . If with min / max everything is simple and clear, then the “target” avg sometimes has to be “picked up” as a solution to the equation:
Initialize the result array:
Thus, we will not miss a strong deviation of the value from the average, since we can hang the trigger at max or min, and the graph from avg will look visually the same as if we sent the raw data.
While the existing solution allows us to significantly save disk resources and reduce the load on the storage system and Zabbix itself, we are trying to figure out how to apply any stream approximation algorithm. If you have ideas - share in the comments.
Many of the first part of the article have already guessed that all our metrics are of type trapper , since we collect and send the data for them via the zabbix sender protocol .
To reduce the “non-core” load (opening the connection, starting the parser, ...) while processing the received values, we group the samples into packets - by timer, in order to prevent a strong lag from realtime, and by quantity (approximately 1000), so as not to “plug” "Trapper-process processing for a long time.
Since, within the framework of a single nodejs process, we have many plug-ins delivering data at once, their data is very conveniently packaged and sent in one stream. It turns out that the number of independent “senders” pulling at zabbix is also quite small.
Thanks to the use of such a scheme, we have long forgotten what nodata- “holes” on the charts are caused by Zabbix overload - after all, all the trappers must be busy.
When a new collector is connected to the collection cluster or when it leaves it (either regularly or as a result of an accident), tasks are automatically redistributed by the master process in accordance with the specified weights of the instances.
The master does not work with the traffic that collectors receive or generate, therefore there are no losses on the bottleneck or the gap in performing active tasks if the coordinator fails. As a result, we got the effect of “real” linear scaling.
Now we have only 2 collection instances with a load of about 25%.
When used as a NodeJS core, it becomes very convenient to develop an effective front-end on “hipster” tools: React + Redux, ES6, Babel, Webpack, ...
We love our users, so we try to make the process of their work with the system as simple and convenient as possible. After all, if it is difficult to interact with the system, the role of the human factor increases, the probability of making a mistake increases.
We do not like mistakes and therefore made some useful chips:
The image is clickable and opens in the current tab of the web browser.
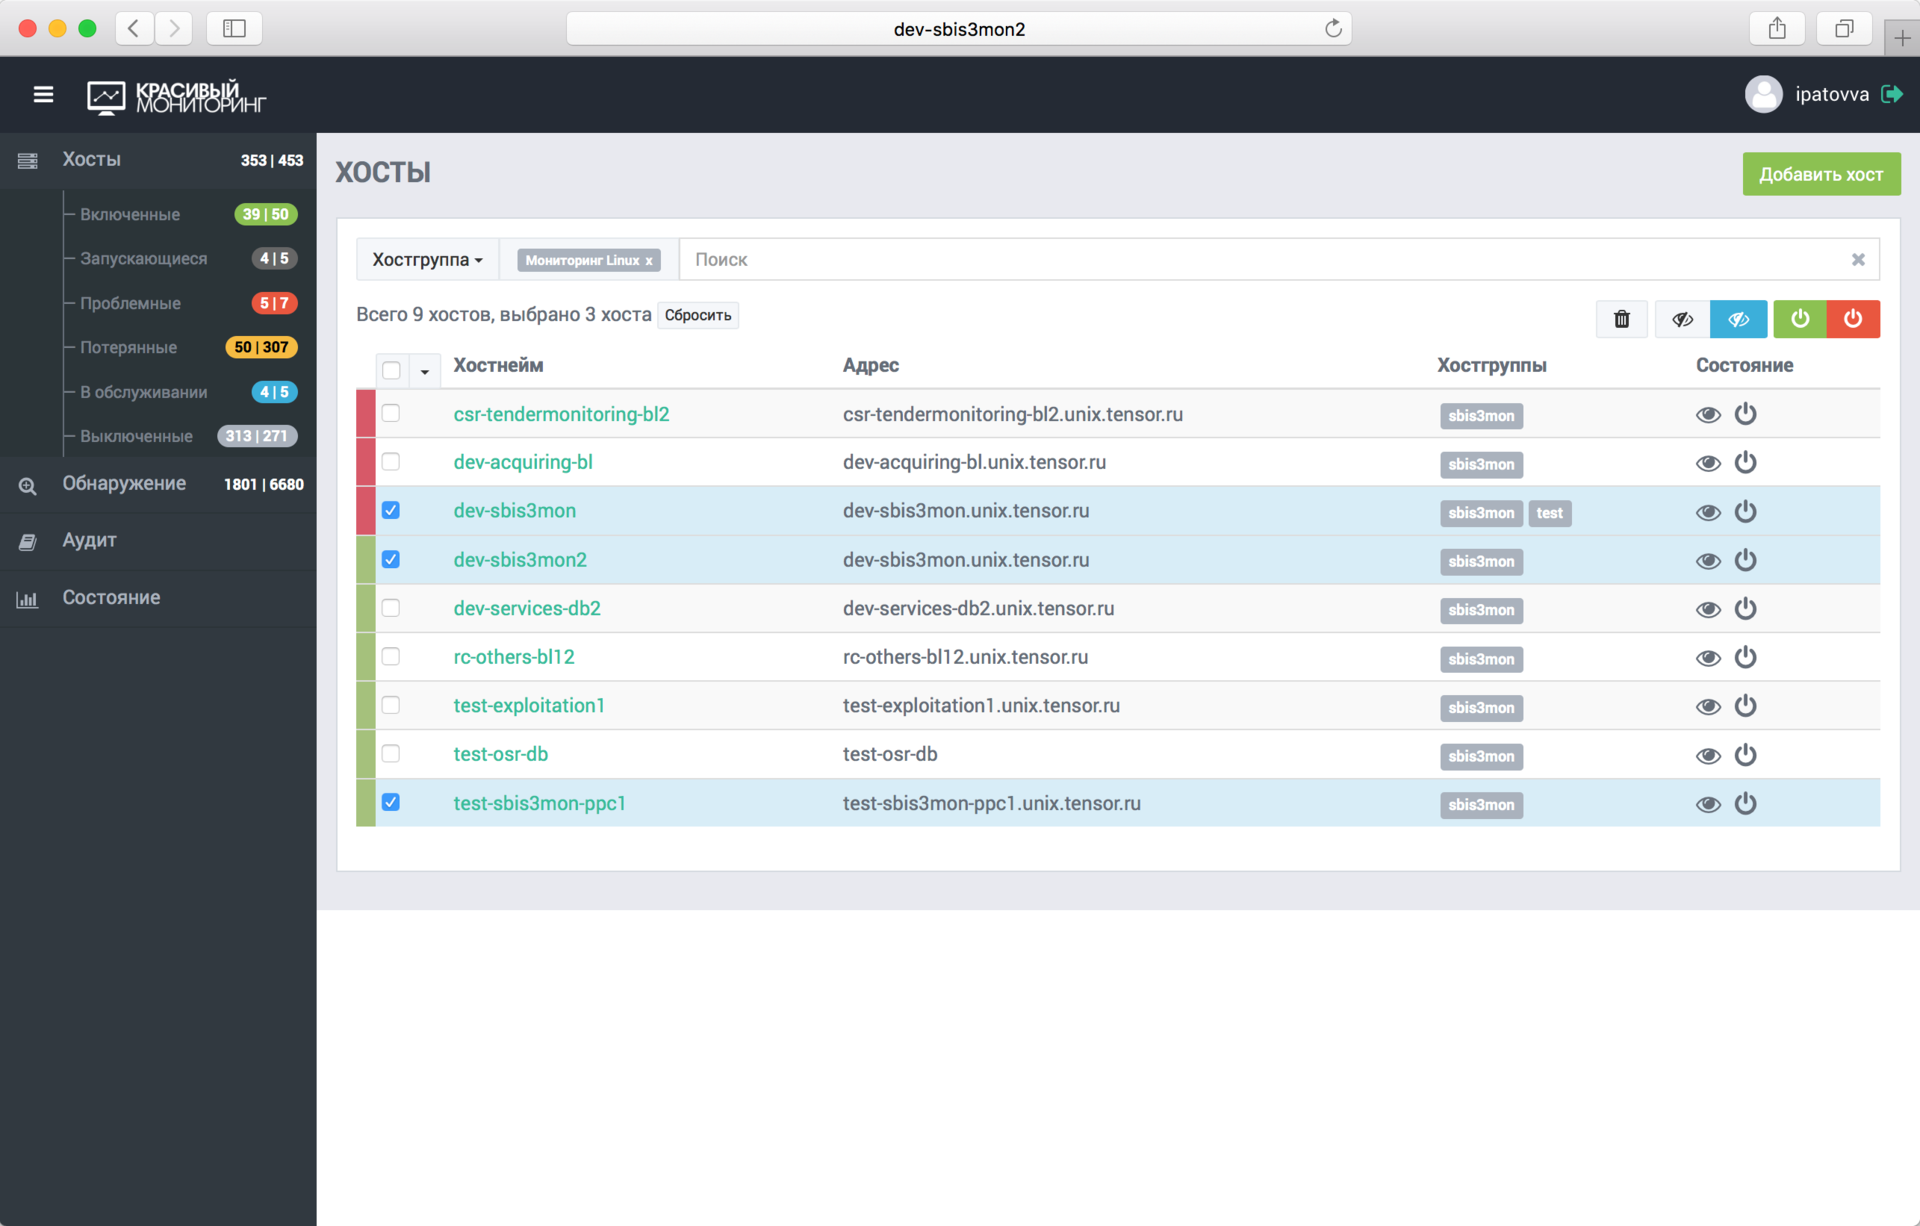
Through the admin panel, users add and remove hosts and services, display them for maintenance (when data continues to go, and alerts are disabled). All monitoring errors are displayed here (incorrect access details, inability to “reach” the server, ...). There is also an audit log (similar to Zabbix), in which all user actions are recorded, which can be useful for flight analysis.
In fact, the admin Zabbix itself is used here only in some atypical situations, but not in operational work.
Thus, with the help of sbis3mon, we solved many painful problems, while not injuring the users and keeping the Zabbix, which is usual for them.

Now we can monitor a huge number of hosts and services. Most of the work is automated. We got our hands on a fairly flexible tool that has proven itself in work and helps to catch most of the known (and not so) problems to us.
To make the presentation of the system clearer, I attach a link to the record of the 2015 seminar . Since then, much has changed, but the essence remains.
Now we are working to make the system more flexible, not tied to our infrastructure, regulations and habits, and to share it with the community, laying out in open access.
Follow the news on our blog. For now, read the continuation of this article.
Authors: kilor (Kirill Borovikov) and vadim_ipatov (Vadim Ipatov)
New server? Automatic
One of the “patients” of monitoring is its potential incompleteness. In especially clinical cases, you can have a deployed server, services configured and running on it, and ... find out about some problems on it solely upon the fact that the service-consumer has fallen, because monitoring knows about all this good "absolutely nothing."
In order to avoid such situations, in addition to official instructions, we tried to make the most of the technical means of monitoring the situation.
')
When admins deploy a new server, they connect it to Spacewalk (a free alternative to the Red Hat Network Satellite). This useful thing deploys configs and software on the server, including everything needed for monitoring. This includes installing our sbis3mon-discovery-scripts package, a lightweight Python utility that runs “kroon” every hour, scans the server and sends the data about the found services to the Discovery Registry .
Thus, sbis3mon has the ability to query from the registry data about servers and services that can be monitored. Now you can enable monitoring of the server and its services in one click, simply by selecting it from the list in the admin panel.
The image is clickable and opens in the current tab of the web browser.
Automatically picked up all the services found. If in the future another service will be deployed on this server, it will also be added to monitoring already without the participation of admins.
Of course, it is possible to add a server manually or by cloning.
Turn on!
At that moment, when the administrator added a server or connected a new service to monitor, the corresponding plug-ins are launched and the control transport connections are established:
- ssh is for collecting data from Linux;
- postgresql - performs a direct connection to the databases via the native protocol;
- redis - to redis;
- … etc.
In most cases, this connection is the only one installed to the service, and it lives either until disconnecting or until the first error. In the latter case, an attempt to reconnect occurs automatically at a specified interval.
We try to use the available native service interfaces to get statistics. With the exception of monitoring Windows and IIS, we do not use agents. Although now there is an idea how to get rid of them.
Plugin - the basis of configuration
After the connection is established, the plugin receives a configuration from the service: a list of its entities (a list of databases, a list of mounted drives, or active network interfaces, ...).
The image is clickable and opens in the current tab of the web browser.
The plugin sends the list of entities to the zabbixSync module, which is responsible for creating or synchronizing the “host” and the structures described by the plugin in Zabbix: items, graphs, screenshots (dashboards) and triggers. Yes, all the visualization and logic of the triggers are also part of the code.
Each entity generates its own complex screen, which allows you to immediately visually assess the presence of problems or anomalies. Sometimes also summary screens are created on which information on a group of entities may be reflected - for example, statistics for all databases in a specific PostgreSQL instance or CPU load on each of the business logic units serving one service.
In general, we succeeded in developing, what exactly and why we want to shoot, how it can be done most effectively, how to bring it all out “beautifully and clearly”, time is spent on each plug-in even more than on the implementation of data collection itself. .
The image is clickable and opens in the current tab of the web browser.
Light, camera ... plugin again!
Simultaneously with synchronization with Zabbix, at predetermined intervals, polling of the specified services begins. For each of the corresponding plug-ins, the coordinator creates and sends a task for execution.
The plugin can process, aggregate and convert the received information in various ways before sending it further - it all depends on the logic embedded in it.
For example, the linux server monitoring plugin is structured like this:
- when a server is deployed via spacewalk, the sbis3mon key for SSH access is immediately “poured” onto it;
- when monitoring is activated, the collector receives the task for the linux-plugin * the plugin establishes an SSH connection using the NodeJS module ssh2 ;
- in the established session, we launch a command to execute, which itself will give us all the data with the required frequency:
watch -n 1 cat /proc/meminfo # ,
Removal rules. Sbis3mon method
Usually, I’ll eat the metrics in almost every system using the “asked - learned” principle, and it’s important that you have the opportunity to ask what you need. When you have a high-load system, everything changes radically.
For example, we had a situation where at some point the virtual machine on which the base lived “under a real highload”, critical to the time it took to complete each millisecond request, “got up a stake” for 2-3 seconds. Removing the data on the CPU every 15 seconds, we simply did not observe these problems - they "slipped" between counts.
Therefore, in particularly critical cases, we read the data even with a minimum quantum of 1 second . Due to this, we don’t miss the problems that arose between neighboring shoots at a lower frequency.
We try to keep the load on target servers to a minimum, so we are already parsing the answers on the side of the monitoring collector. In this case, for one request, we immediately get the maximum of the required data, which also gives the synchronism of the metrics in time. But the main thing is not to force the target system to do too much, which is not really required.
For example, initially we monitored the status and number of network connections via netstat . And everything was fine, until servers with tens and hundreds of thousands of active connections started to appear - dispatchers on Nginx, a message bus on RabbitMQ, ... At some point we saw that executing the "for monitoring" command drops CPU a few times relative to the applied load ! I had to urgently redo the removal of data through ss .
"And instead of the heart - a fiery motor!"
We have chosen NodeJS as the core of our system - and this is no accident . In addition to the ease of development, an active community and a library of modules for all occasions , it has a big and fat plus in the form of asynchrony “out of the box”, ideally suited to our tasks.
From the description of our data acquisition technique, it is clear that most of the time each plugin does not do anything, waiting for a new piece of data from the source to be received in the active connection. It turns out that within one process we can simultaneously efficiently serve a large number of such connections. And the asynchronous kernel allows us to do it easily and conveniently!
Of course, in order not to overload the eventloop of the collector process , we also constantly monitor it (just like in this article ), and redistribute tasks in accordance with the load.
The image is clickable and opens in the current tab of the web browser.
Data compression
Ultimately, the received data is sent further - to the approximation module.
It is clear that even if we remove data in seconds, then neither Zabbix, nor the person looking at it, there is no happiness at all. One will "fall" under load (we remember that data is being removed from several thousand servers), the other "eyes will flow out" from the leapfrog on the graph.
To make it easier for everyone, before sending to Zabbix, we “compress” the resulting array of source samples to the interval specified in the plugin for a specific metric. But this is not just an averaging of values - with it we would irretrievably lose information about maxima and minima over the interval. Everything is a little trickier.
Since Zabbix allows min / max / avg values of a metric to be displayed on its graphs, and there can be several values at each point (timestamp), this is what we used.
The image is clickable and opens in the current tab of the web browser.
Suppose we have a rarely changing metric (the amount of used disk space), which we remove per minute, and we want to see one value per hour:
[12345,12345, ..., 12345] → {min = 12345, avg = 12345, max = 12345} → zabbix = [12345]
in this case, we need only one value at the point
Now let's take the CPU load, which we are shooting off every second, and we only want to see the new points once every 10 seconds:
[10,20,30,40,50,50,40,30,20,10] → {min = 10, avg = 30, max = 50} → zabbix = [10,30,50]
in this case, we need only 3 values instead of 10
What is the difficulty?
We have to send a set of values to Zabbix such that {min, max, avg} (zabbix) = {min, max, avg} (source) . If with min / max everything is simple and clear, then the “target” avg sometimes has to be “picked up” as a solution to the equation:
(A * min + B * max + q) / (A + B + 1) = avg
where A, B are integers; min <= q <= max
Initialize the result array:
[10,10,30,10,50,10,40,10,20,10] → {min = 10, avg = 20, max = 50} → zabbix = [10.50, ...], → .push ( min)
→ zabbix = [10,50,10, ...], → .push (min)
→ zabbix = [10,50,10,10]
in this case we needed 4 values, but still not 10
Thus, we will not miss a strong deviation of the value from the average, since we can hang the trigger at max or min, and the graph from avg will look visually the same as if we sent the raw data.
While the existing solution allows us to significantly save disk resources and reduce the load on the storage system and Zabbix itself, we are trying to figure out how to apply any stream approximation algorithm. If you have ideas - share in the comments.
Optimization of sending metrics
Many of the first part of the article have already guessed that all our metrics are of type trapper , since we collect and send the data for them via the zabbix sender protocol .
To reduce the “non-core” load (opening the connection, starting the parser, ...) while processing the received values, we group the samples into packets - by timer, in order to prevent a strong lag from realtime, and by quantity (approximately 1000), so as not to “plug” "Trapper-process processing for a long time.
Since, within the framework of a single nodejs process, we have many plug-ins delivering data at once, their data is very conveniently packaged and sent in one stream. It turns out that the number of independent “senders” pulling at zabbix is also quite small.
Thanks to the use of such a scheme, we have long forgotten what nodata- “holes” on the charts are caused by Zabbix overload - after all, all the trappers must be busy.
Scaling and failover
When a new collector is connected to the collection cluster or when it leaves it (either regularly or as a result of an accident), tasks are automatically redistributed by the master process in accordance with the specified weights of the instances.
The master does not work with the traffic that collectors receive or generate, therefore there are no losses on the bottleneck or the gap in performing active tasks if the coordinator fails. As a result, we got the effect of “real” linear scaling.
Now we have only 2 collection instances with a load of about 25%.
“Make me beautiful!”
When used as a NodeJS core, it becomes very convenient to develop an effective front-end on “hipster” tools: React + Redux, ES6, Babel, Webpack, ...
We love our users, so we try to make the process of their work with the system as simple and convenient as possible. After all, if it is difficult to interact with the system, the role of the human factor increases, the probability of making a mistake increases.
We do not like mistakes and therefore made some useful chips:
- mass operations;
- cloning hosts;
- auto-completion as you type, where possible;
- various filters;
- realtime statuses;
- ...
The image is clickable and opens in the current tab of the web browser.
Through the admin panel, users add and remove hosts and services, display them for maintenance (when data continues to go, and alerts are disabled). All monitoring errors are displayed here (incorrect access details, inability to “reach” the server, ...). There is also an audit log (similar to Zabbix), in which all user actions are recorded, which can be useful for flight analysis.
In fact, the admin Zabbix itself is used here only in some atypical situations, but not in operational work.
results
Thus, with the help of sbis3mon, we solved many painful problems, while not injuring the users and keeping the Zabbix, which is usual for them.
Now we can monitor a huge number of hosts and services. Most of the work is automated. We got our hands on a fairly flexible tool that has proven itself in work and helps to catch most of the known (and not so) problems to us.
To make the presentation of the system clearer, I attach a link to the record of the 2015 seminar . Since then, much has changed, but the essence remains.
Looking ahead
Now we are working to make the system more flexible, not tied to our infrastructure, regulations and habits, and to share it with the community, laying out in open access.
Follow the news on our blog. For now, read the continuation of this article.
Authors: kilor (Kirill Borovikov) and vadim_ipatov (Vadim Ipatov)
Source: https://habr.com/ru/post/329694/
All Articles