Quadratic equation with complex numbers in 3D
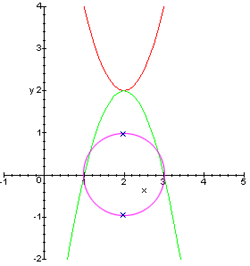
Hello! Since school, solving quadratic equations (KU), for example , got roots with an imaginary component, and if you want to see how the graph crosses the axis in points , I found on the Internet graphics like:

How does the graph with the imaginary part look (in my thoughts) in 3D ( ), and is the topic of this article.
PS: Under the cut heavy animations
As usual, the graph of f-ktsii consists of points, and points are under construction on intersection of axes and .
The schedule of f-tsii with a complex component ,
')
Where - vector

- vector

can be represented as a 3-dimensional vector
Similarly
Intersection point and will be equal to the sum of the vectors and
+ =
With the intersection figured out.
Next to build the graph you need to decide on the change and along the axis , for this you need root KU. There are two options:
I chose the second option. Take for example:
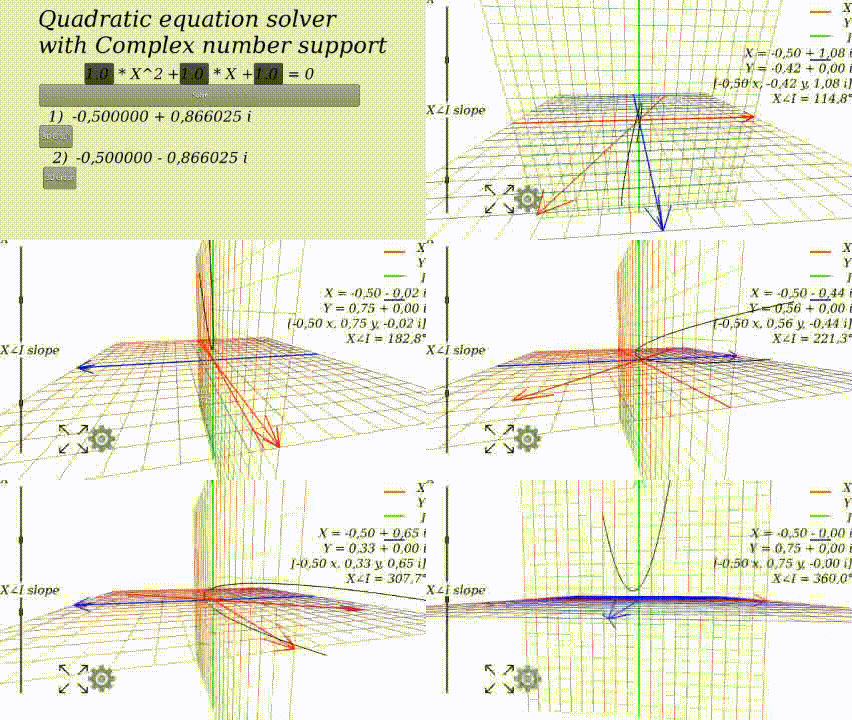
Roots ku
When

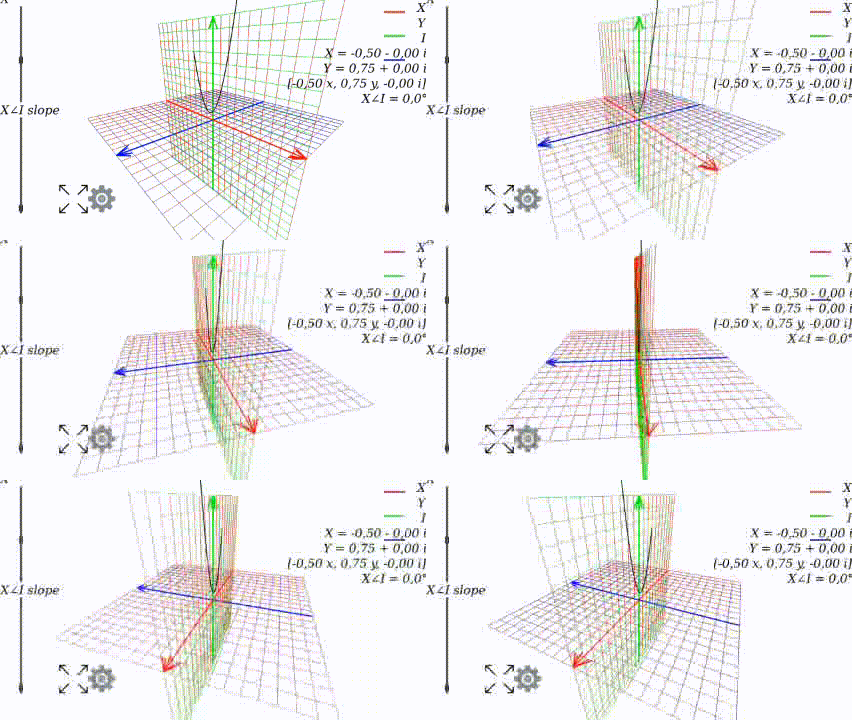
When the angle is 0, the graph looks like it used to look like at school:

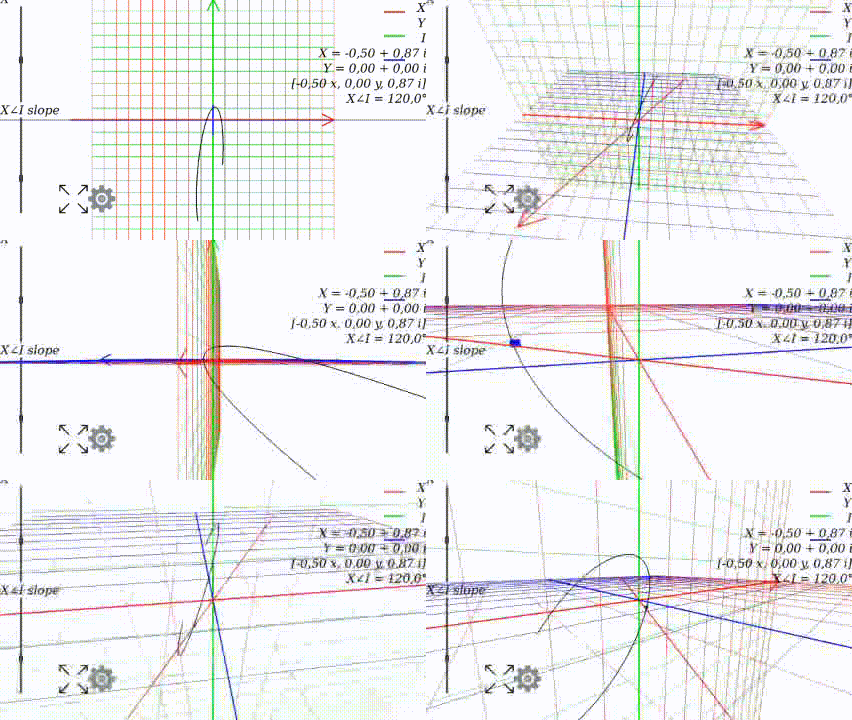
Changing the angle, we see how the graph changes:

PS: The presented graphics and their animations were created in the “Quadratic Complex 3D Graph” application from Google Apps.

How does the graph with the imaginary part look (in my thoughts) in 3D ( ), and is the topic of this article.
PS: Under the cut heavy animations
As usual, the graph of f-ktsii consists of points, and points are under construction on intersection of axes and .
The schedule of f-tsii with a complex component ,
')
Where - vector

- vector

can be represented as a 3-dimensional vector
Similarly
Intersection point and will be equal to the sum of the vectors and
+ =
With the intersection figured out.
Next to build the graph you need to decide on the change and along the axis , for this you need root KU. There are two options:
- To make constant and change only from the root of KU;
- Get the angle between and from the root ku and move along building up , calculate taking into account the angle and .
I chose the second option. Take for example:
Roots ku
When

When the angle is 0, the graph looks like it used to look like at school:

Changing the angle, we see how the graph changes:

PS: The presented graphics and their animations were created in the “Quadratic Complex 3D Graph” application from Google Apps.
Source: https://habr.com/ru/post/329672/
All Articles