HCIBench - load testing of vSphere repositories
Introduction

The issue of data storage is one of the most important, complex and expensive for any virtual infrastructure, including for all respected VMware vSphere.
To assess the performance of the storage, in order to understand its capabilities to perform real tasks, it is necessary to conduct load testing. The easiest to implement are synthetic tests performed, for example, using such popular utilities as Iometer and Fio. Classic application: testing of local storage of a node or external storage from one or several nodes.
')
With a virtual infrastructure, things are somewhat more complicated, it consists of many hosts on which dozens of VMs are spinning. Even a small installation of two to four hosts can easily hold about 100 VMs, not to mention the medium and large infrastructures of tens and hundreds of hosts.
Testing shared storage for such an infrastructure by running Iometer / Fio on one or several VMs or from a dedicated node on bare hardware will be incorrect. Such testing should be distributed and provide parallel I / O generation and centralized recording of results from multiple VMs from all hosts of the vSphere cluster. Only this approach will allow you to simulate the load of a real high-loaded virtual cluster.
Personally, I tried on my test cluster vSphere vSAN 6 update 3 of 4 hosts with handles to deploy 4 VMs on Windows from Iometer, via the command line connect Dynamo on 3x VMs to the Iometer console on the fourth VM, with which I performed the distributed testing. Even for 4x VMs, this is a boring and ungrateful business; deploying several VMs to a host manually is not an option at all.
Of course, you can use scripts, automation tools and make everything beautiful, but I do not know how. Therefore, for people like me, a small group of VMware developers has released and is developing the free HCIBench utility, which is what we will talk about in this article.
General view
HCIBench is a utility (I would say a framework) to automate the load testing of the vSphere data warehouse. HCIBench does not have its own engine for generating I / O, it uses less pop, but in my opinion more powerful / flexible than Fio and Iometer (although they are also good), a free utility from Oracle called Vdbench.
HCIBench, in an acceptable in terms of convenience, simplicity and capabilities of a graphical web-based interface, allows you to create a test task for the storage subsystem after starting which you just have to wait for the execution results. The utility itself will deploy the number of test VMs set by the user with the required disk parameters and the built-in Vdbench, evenly distributing them across the cluster nodes, test it and generate the final result with the main general performance indicators. In addition, the opportunity to view the saved test logs and detailed reports for finding nuances and troubleshooting is provided.
HCIBench is completely free and has no restrictions on use. You can download the utility, its manual and ask questions about its support on the official HCIBench page .
Despite the fact that HCIBench, even judging by its name, was developed as a tool for testing distributed storage and hyperconvergent infrastructures (HCI), first of all VMware vSAN, it is a universal means of testing storage infrastructure and is compatible with any vSphere storage:
• local host media and shared storage (local and shared storage);
• block and file storages;
• classic and software (SDS) storage;
• single and distributed repositories;
• dedicated and hyper-convergent repositories.
Architecture
HCIBench is distributed in the form of a ready-made virtual elaence (.ova file), including a controlling VM (Controller VM) and a template for deploying test VMs (Vdbench Guest VMs).
The control and test VMs are quite compact (4GB - RAM and 16GB - system disk) and run under the new VMware container OS based on Linux - Photon OS 1.0.
Controller VM includes the following components:
• Ruby vSphere Console (RVC)
• Automation (Automation bundle)
• vSAN Observer
• configuration files

vSAN Observer is a VMware utility designed to monitor the status of a vSAN cluster, displaying various performance indicators in the form of graphs. It runs only in the case of vSAN testing and, in addition to the Vdbench results, saves graphs with the statistics of the storage operation in an interactive format (html) to the report.
Automation tools are a collection of scripts in Ruby and Bash. The user sets the configuration of the test environment and the parameters of the load, all of which is stored in the configuration files. Scripts through RVC, which is essentially the core of HCIBench, are automatically tested based on a given configuration, including the following steps:
• connection to the tested vSphere infrastructure;
• deployment of the required number of test VMs with the specified number and size of test disks (vmdk);
• transfer of Vdbench configuration parameters that determine the load and duration of testing for each test VM;
• launch vSAN Observer in the case of testing vSAN;
• launch of Vdbench entities on each test VM - all deployed vDisks are tested, the duration according to the specified configuration;
• at the end of the test, data is collected from all test VMs and a resulting report is generated.
Deployment
It is necessary to download HCIBench in the form of ready virtual eplaens from the official resource. At the deployment stage, in the graphical interface, in addition to accepting the license agreement, you must specify the network parameters
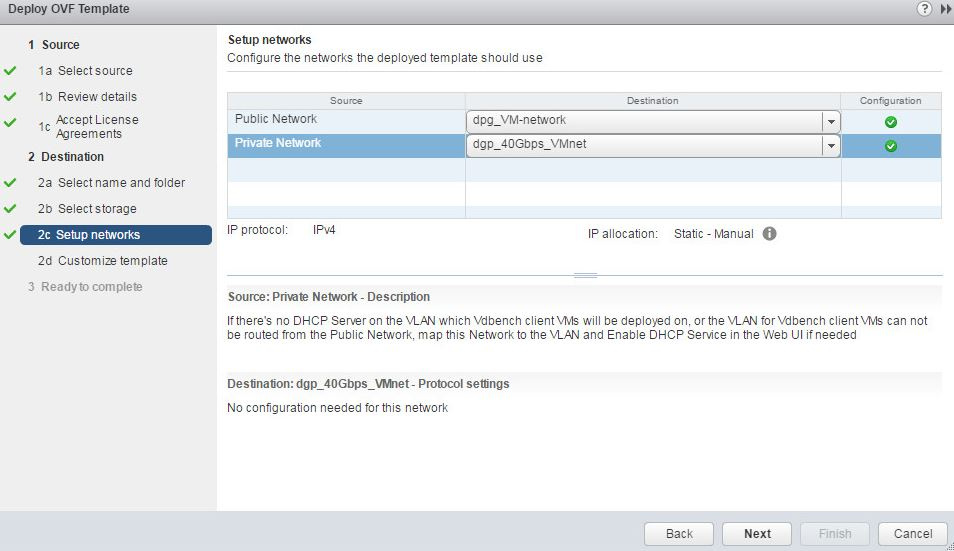
As the “Public Network”, you need to specify the network from which vCenter and ESXi hosts are available, this will allow HCIBench to access the infrastructure for deploying test VMs and conducting testing.
If a DHCP server is deployed in the Public Network and there is a sufficient number of free IP addresses for testing (you may need a lot of them), then test VMs can be deployed on this public network. Accordingly, the choice of the Private Network can be ignored or assigned to the same network as the Public Network.
If the Public Network does not have a DHCP server, there are not enough free IP addresses to distribute the test VMs, there is a need to place the test VMs in a separate subnet (where the DHCP server may also not be), then we specify the network we need as a Private Network and, if necessary, use the DHCP server built into the utility.
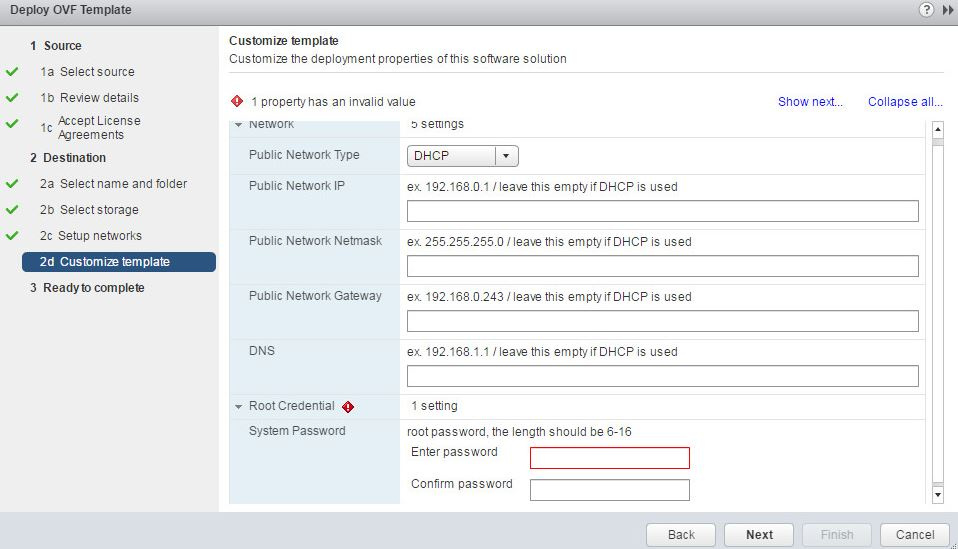
In the next step, we deal with the network addresses, in the case of DHCP we leave all the fields empty, otherwise we specify the necessary addresses and a mask. You must also specify a root password to manage the utility. Then HCIBench will be deployed and you can start testing.
Interface
After the framework has been deployed, you need to connect to its web console at http : // HCIBench_IP: 8080 / (you need to see in the vSphere client what Controller VM received the IP address), log in with the root and voila password, you can configure and run the test.
From top to bottom, we’ll go through all the parameters of the HCIBench configuration page.
Section - vSphere Environment Information

In the first five fields we indicate the domain name or IP address of the vCenter server, the name and password of the vCenter administrator, the name of the data center and the vSphere cluster to which the test storage is connected.
Then we specify the network name (the name of the vSphere port group) in which the test VMs will be deployed. If necessary, we set the checkbox to enable DHCP if there is no service in this subnet.
In the field “Datastore name” we indicate the name of the Datastore (target storage) that we will test. In this field, you can specify several repositories for testing (each in a new line), then the test VMs will be evenly distributed among all the specified repositories.
You can check the box “Clear Read / Write Cache” to clear the storage cache before the test. This works only for vSAN, while you must specify the parameters for access to ESXi hosts (the Host Username and Host Password fields), they must be the same for all hosts (you cannot specify for each host separately).
Section - Cluster Hosts Information

If you do not check the “Deploy on Hosts” box, then the “Hosts” field located below must be left empty. In this case, the deployment of test VMs will be done through vCenter, they will be evenly distributed across all cluster hosts in a circular manner (round-robin). If we did not activate the “Clear Read / Write Cache” parameter, then the “Host Username” and “Host Password” fields should also be left blank.
Otherwise (set the “Deploy on Hosts” checkbox), all the above fields must be filled in: in the “Hosts” field , enter the domain names or IP addresses of the hosts (each in a new line), fill in the host access settings (as I said, login and admin password on all hosts must be identical).
When activating the “Deploy on Hosts” mode , test VMs are installed on the specified hosts directly and in parallel, in order to reduce the network load, first on the first 5 hosts, then on the next ones and so on in 5 host steps.
In general, it is recommended to use the “Deploy on Hosts” mode when deploying a large number of test VMs. However, this mode is not supported when using distributed switches. Its activation will cause an error at the test save / test stage in the configuration of which the network connected to the distributed port group is indicated.
The “Deploy on Hosts” mode is also required for testing media or storage directly connected to a specific host (DAS), in which case we specify the target host and access parameters to it.
The “EASY RUN” parameter is intended only for VMware vSAN tests, its activation allows you to automatically select the optimal configuration of the parameters below, based on the architecture of the vSAN cluster under test. This allows you to determine the desired number of test VMs, the number, size and type of training them in the Disks for optimal testing of this cluster. All configuration parameters below will be hidden when activating “EASY RUN”.
Section - Vdbench Guest VM Specification

The required parameter is “Number of VMs” , it determines the number of test VMs that will be deployed in the infrastructure to generate the load. The remaining parameters of the section are optional.
“Number of Data Disk” determines the number of vdks (vmdk) that will be created for each test VM. They will be placed on the storage being tested and Vdbench load will be generated on them.
"Size of Data Disk" determines the size of each of the above disks in GB.
The default value of both parameters is 10.
Enabling the Re-Use The Existing VMs If Possible parameter will allow you to reuse deployed test VMs in a new test, if these machines exist (not deleted) and correspond to the parameters of the new test (parameters of this section: number of VMs, disks, and their size).
Section - Vdbench Testing Configuration

In the “Test Name” field, as it is easy to guess, you need to specify the name of the test and it is desirable to do it so that you can then find the desired results. If the field is left blank, the utility automatically assigns the name "result TIME" to the test.
The results of all tests are stored in separate folders with the names corresponding to the names of the tests, the location is / opt / output / results / on the control VM. To view them, you must enter http : // Controller_VM_IP / results in the browser.
For testing, you need to give the Vdbech parameter file to the utility, you can generate it yourself on the same page - the “Generate” button or download the finished file from the outside - the “Upload parameter file” button. After downloading or generating the parameter file, the “Refresh” button must be pressed to display this file in the “Select a Vdbench parameter file” menu.
If you generate and / or load several parameter files, they will all be saved and you can select the necessary one in the menu “Select a Vdbench parameter file” . Unnecessary ones can be deleted with the “Delete” button.
Recommendation
The menu “Select a Vdbench Parameter File” contains the string “Use all” in addition to the names of the parameter files. Instead of running a separate test for each type of load to which its own parameter file corresponds, it is advisable to prepare a set of parameter files for each type of load of interest and select “Use all” . In this case, the framework itself will consistently conduct all these tests and separately save their results. This is convenient, since the duration of a good test is at least 1.5 hours, the load types you need to evaluate a lot, track completion and run each test manually is inconvenient, and you can run the entire sequence at once, for example, at night or at night and calmly get in the morning all results at once.
The parameter “Prepare Virtual Disk Before Testing” allows you to prepare in the Test VM Disks before testing. The default value is “NONE” - without preparation, except for it there are 2 more values: “ZERO” and “RANDOM” . If ZERO is selected, the disks will be written with zeros during preparation, this will avoid delays in initializing the storage during the initial recording. When selecting the value “RANDOM” in the Disks during preparation, they will be recorded with random data, which is important for testing repositories with deduplication enabled. This is logical, because if a disk is empty or written with zeros, then there is nothing to deduplicate, the effect of the work of the dedup at the initial recording cannot be obtained. If the disk is recorded with random data, dedup starts to work immediately, and the effect of its work will be more uniform over the entire testing interval.
The “Testing Duration” parameter overrides the test duration specified in the Vdbench parameter file. If there is no such need, then this field should be left blank.
If you check the “Clean up VMs” checkbox , then at the end of the test all test VMs will be deleted, otherwise they will be saved, which makes it possible to use them again.
Section - Download Vdbench

HCIBench does not initially include Vdbench, apparently due to the nature of its distribution. Therefore, after the first deployment, you need to download Vdbench from the Oracle website (unfortunately you will have to register) and upload it to HCIBench, for this you need this section.
Configuring Vdbench Settings

After pressing the “Generate” button, the Vdbench parameter files configuration window will open, which will be used to generate the load on each test VM.
It is possible to set the following parameters:
Number of Disks to Test - select the number of Disks for each test VM for which the load will be generated, it should be no more than the number defined in the “Number of Data Disk” field (the number of test VM disks).
In my tests, these values are always the same. However, you can deploy a pool of test VMs that will have, for example, 20 vDiscs, and for this pool, conduct a series of consecutive tests that will load 5-10-15-20 vDisks at a time. This is possible when installing the Re-Use The Existing VMs If Possible checkbox , instead of 4 deployments, we limit ourselves to one for all 4 tests.
Working-Set Persentage - choose the share of space in the Disk for which the load will be generated.
In my tests, I always chose the value 100 (100% of the disk space). You can choose another value (from 0 to 100), in which case not all of the Disk will be tested, but part of its space. The logic is the same as the point above: we deploy a pool of test VMs 1 time, then in each new test we play with a share in the Disk, thus varying the load. Perhaps there are other scenarios.
Number of Threads per Disk - the number of load threads on the test VM disk, the larger the value, the greater the load.
The default value is 2. With this parameter, you can play around choosing the optimal load for testing, and you must take into account the number of test VMs and disks, so that as a result of the test you get an adequate ratio of performance and latency. If there are a lot of test VMs and vDisks in the configuration (from 20-30 vDisks per host), then the parameter should be selected within 1-4, if it is small, then more than 4. I had 20 vDiscs per host, the value 2 was optimal.
Block Size - block size, Read Percentage - share of read operations, Random Percentage - share of random operations. With this, everything is clear, choose the desired values under the type of target load.
I / O Rate - IOPS limit for test VM, optional parameter, if left empty, there is no limit.
Test Time - the duration of the main test in seconds. The time interval during which the measured indicators are taken into account in the final test results, in other words, the test payload is generated and taken into account.
Warmup Time - warm-up time in seconds. An optional parameter sets the duration of the storage warming up, which is performed before the main test in order to bring the storage and cache to the necessary condition, fill them with data and get the results that reflect the real picture. The load generated during the warm-up period is not taken into account in the results of the main test.
If we prepared vDisks before the test in a certain way (the “Prepare Virtual Disk Before Testing” field), then warming up may turn out to be superfluous.
In my tests, I set aside 30 minutes for warming up and 1 hour for the main test, in my opinion it’s not worth testing less, the result may be questionable. The main criterion is that the warm-up time and the more so the main test is enough for at least one complete record of all test vDisks (selected storage volume under test).
Reporting interval - the interval with which Vdbench saves intermediate test results, in seconds. The optional parameter is not specified by default, so at the end of the test, we only see the totals for the entire test period. You can set a certain value (say 5 or 10 minutes), then in the test results we will see intermediate indicators with the specified periodicity. This can be useful under certain conditions. However, do not abuse this, each time you save an intermediate result, Vdbench will suspend I / O and this will adversely affect overall performance. I did not use this parameter, I left it empty.
Test Planning Guidelines
Each test requires the selection of the correct parameters based on the characteristics of the storage and virtual infrastructure. The main criterion for the correct parameters: squeeze out the maximum performance from the storage (IOPS and Throughput) and keep the delay values (Latency) within reasonable limits. Reasonable delay limits or its clear threshold are different for everyone and are determined by the task: someone needs a delay of <4-10 ms (milliseconds), someone is uncritical if there are tens of ms (even a couple of hundred), and someone needs microseconds.
In the case of VMware vSAN testing, you can start “EASY RUN”, look at its performance and parameters, and then try to change them and go through them for optimal results. For other repositories, when selecting parameters, you will have to rely on your own experience and common sense (conducted a test, looked at the report, tried to increase the load, or reduce it if the delays are large). Naturally, this is a long process, it may take more than one day or even a week.
Options you can play with:
• number of test VMs, at least 2 VMs per host;
• the number of disks, an average of 10 disks on a VM;
• the volume of disks, 1-10-20 GB per disk, maybe more, it all depends on the storage and cache;
• the number of streams on vDisk, about which I wrote above;
• the share of vDisk space, about which I wrote above.
Very important is the total amount of storage space that will be tested. It consists of the space of all vDisks of the test VM. For example, we are testing hybrid storage. If the total volume is placed in the cache and will not be pushed out to a slow permanent storage, then we will get cool performance. If it is placed in the cache, but it occupies almost all of it, so that the storage logic still slowly starts to crowd out the data, we will get lower performance. If the total volume occupies the most part of the main storage and many times exceeds the cache, then we will carry out the test in the most severe conditions and the performance will be minimal, but the most honest.
By the way, this must be taken into account when analyzing the performance indicators that the storage vendors declare. Your result may be much worse, since the manufacturer tested everything honestly, but forgot to mention that all his test space was in the cache.
Saving and checking the configuration, running the test
After setting up all the test parameters, you must save the configuration (the “Save Configuration” button) otherwise the last saved one will be used. Then you need to check the configuration, make sure that the specified parameters are correct and the availability of the tested infrastructure. After clicking the "Validate" button , the verification will begin, the results of which will be shown on a pop-up page.

If at the end of the page we see the phrase “All the config has been validated , then everything is fine and you can run the test, otherwise you will get an error with a description of the reason.
After clicking the "Test" button, the testing process starts and a window pops up showing the progress of the process, if desired, it can be interrupted. The utility will also notify the end of the test with a pop-up window.
Upon completion of the test, I recommend that you definitely click the “Save Result” button, this will save its result in a zip archive on the Controller VM and upload it to your local PC, otherwise it will be problematic to download the results (it will not work out through the browser), especially Linux
View Results
The test results, as I wrote above, are saved in the / opt / output / results / folder on the controlling VM. To view them, you must enter http : // Controller_VM_IP / results in the browser.
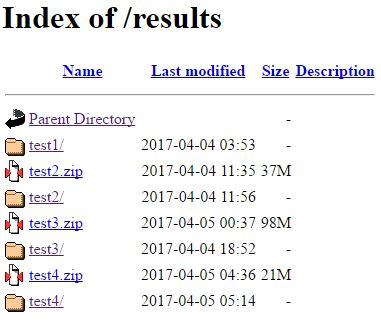
We find the folder with the test we are interested in (the folder name corresponds to the name of the test), we fall into it and see something like this:

The number of files of the same name (vdb-xxx-res.txt) and folders (vdb-xxx) depends on how many tests were conducted under one name (the “Test Name” field in the console). As I wrote above, you can run a number of tests with different parameters (“Use all”) at once, then all their results will be saved in one folder, the same will happen if you do not change the name of the test (“Test Name”).
Text files with the names vdb-xxx-res.txt are the most interesting, they store the final generalized test results, their contents look like this:
Datastore: vsanDatastore
VMs = 8
IOPS = 157556.66 IO / s
THROUGHPUT = 615.47 MB / s
LATENCY = 1.0114 ms
R_LATENCY = 0.9182 ms
W_LATENCY = 1.2282 ms
=============================
Datastore: vsanDatastore
95th Percentile Latency = 1.0671249999999999
IOPS associated with 95th Percentile Latency = 149653.0
=============================
Resource Usage:
CPU USAGE = 59.33%
RAM USAGE = 24.03%
VSAN PCPU USAGE = 20.287%
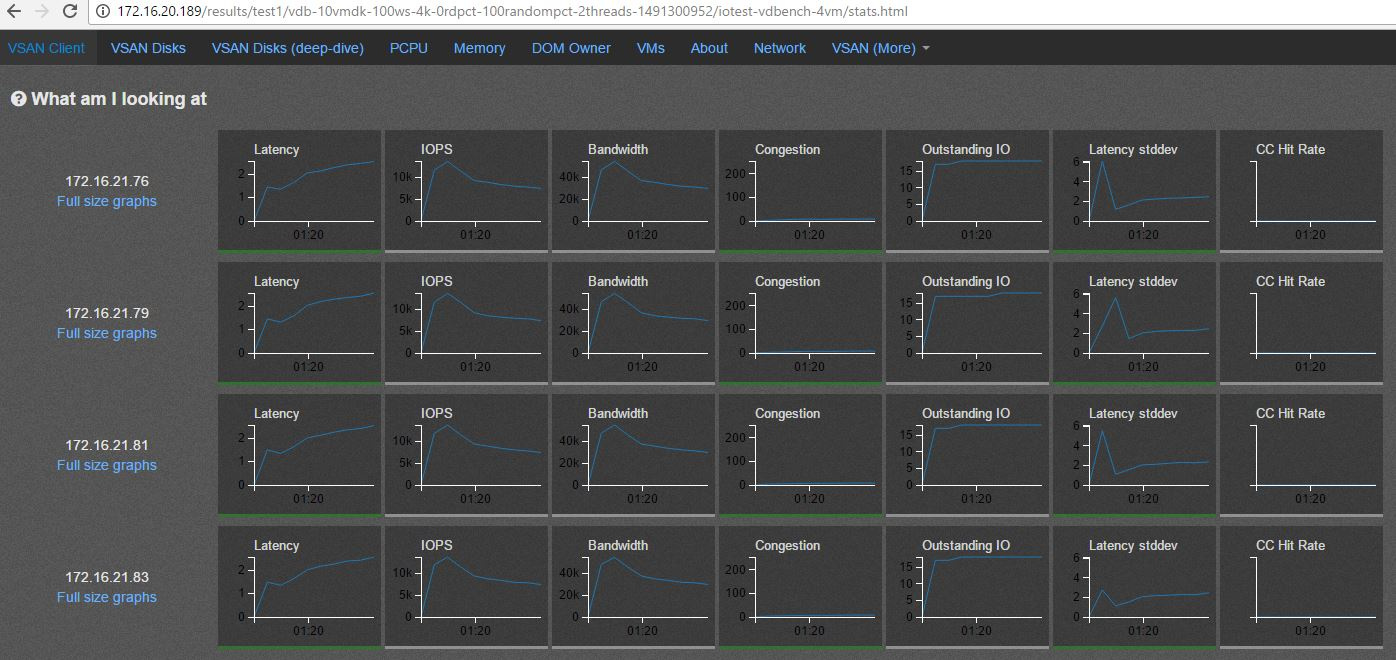
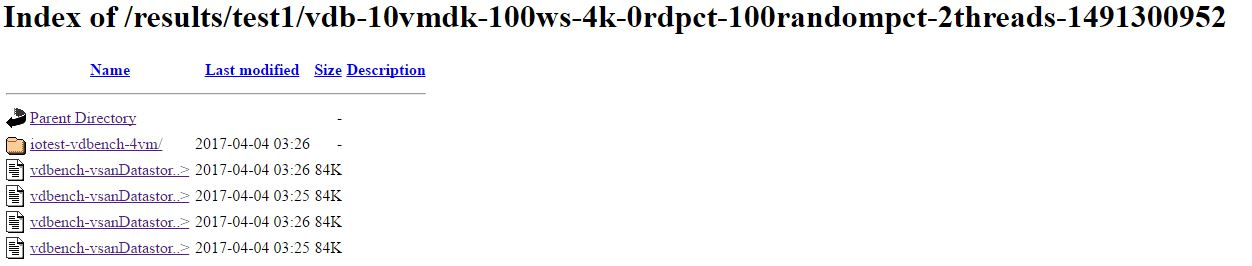
The folders of the same name contain the details of each test:

Text files vdbench-xxx.txt contain details of the results of testing Vdbench on each test VM. The iotest-vdbench-vm folder contains VMware vSAN statistics collected by the vSAN Observer during the test, its results can be seen graphically by opening the stats.html file.
Showdown with problems
When problems arise, first of all you need to analyze the HCIBench logs located at http : // Controller_VM_IP / hcibench_logs /.
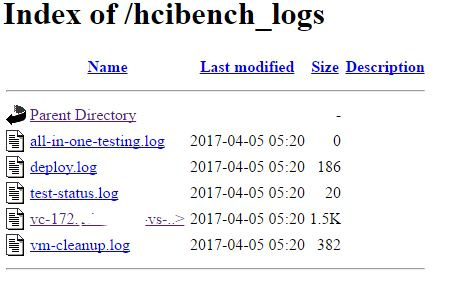
In addition, it may be useful to look at the results of testing Vdbench on test VMs separately - http : // Controller_VM_IP / results / test_name / vdb-xxx /.
They look like this:

Emerging questions and problems help to understand directly the developers of the framework on its official page .
Results
HCIBench can not be called an ideal utility, during the operation there were some difficulties and jambs. However, in general, the impressions are positive: it is quite comfortable, simple, flexible, gives adequate results, especially when experience appears.
Using HCIBench in storagereview.com tests also causes respect.
Source: https://habr.com/ru/post/329650/
All Articles