Cloud Load Balancing
Hi, Habr! Today we would like to raise the problem of load balancing in the Cloud, or rather to discuss the new approach to making decisions on live migration of virtual machines between hosts, proposed by Dorian Minarolly, Artan Mazrekai and Bernd Freisleben in their study “Tling uncertainty in long-term predictions for host overload and underload detection in cloud computing ". A free translation of this article we publish today.
Abstracting from cloud computing features, this approach can be applied when solving load balancing problems in other systems. Therefore, we hope the article will be of interest to a wide circle of readers.

')
Dynamic cloud computing workloads can be managed using live migration of virtual machines from overloaded or underloaded hosts to other nodes to save energy and reduce losses due to violation of the service level agreement (SLA). The problem is to correctly determine when the host will be overloaded in the future for timely live migration.
Cloud computing is a promising approach where resources are provided in the form of a service, can be leased and made available to users through a network on demand. Infrastructure as a service (IaaS) is one of the widely used business models of cloud computing. Computing resources are provided in the form of virtual machines (hereinafter referred to as VM) to users who pay for consumed resources. Virtualization tools, such as Xen and VMware, allow efficient use of infrastructure resources. Virtual machines provide the ability to allocate resources dynamically according to requirements, optimizing application performance and power consumption.
One of the main opportunities for the dynamic redistribution of resources is the live migration of virtual machines. It allows cloud providers to move virtual machines from overloaded hosts, maintaining their performance under a given SLA, and dynamically consolidate virtual machines on the smallest number of hosts, in order to save power when the load is low. Using live migration and applying online algorithms that allow you to make real-time migration decisions, you can efficiently manage cloud resources by adapting resource allocation to VM loads, maintaining VM performance levels according to SLA, and reducing infrastructure power consumption.
An important issue in the context of live migration is the detection of a host congestion or underload condition. Most current approaches are based on monitoring resource utilization, and, if the actual or predicted next value exceeds a predetermined threshold, the node is declared congested. However, live migration has its price, justified by the disruption of VM performance during the migration process. The problem with existing approaches is that detecting host congestion on one measurement of resource usage or several future values can lead to hasty decisions, unnecessary overhead costs for live migration, and problems with VM stability.
A more promising approach is a decision-making approach on live migration based on projections of resource use a few steps ahead. This not only improves stability, since migration actions begin only when the load is maintained for several time intervals, but also allows cloud providers to predict the state of overload before this happens. On the other hand, forecasting a more distant future increases forecast error and uncertainty, while reducing the benefits of long-term forecasting. Another important problem is that live migration should be performed only if the penalty for possible violations of the SLA exceeds the overhead of migration.
This article presents a new approach to detecting congestion or underloading of a host, based on long-term projections of resource use, which take into account the uncertainty in forecasting and the overhead of live migration. Made the following:
The proposed approach is experimentally compared with other approaches:
This work focuses on managing the IaaS cloud, in which several virtual machines run on multiple physical nodes. The overall architecture of the resource manager and its main components is shown in Figure. 1. There is a VM agent for each virtual machine that determines the allocation of resources on its virtual machine in each time interval. For each host, there is a host agent that receives resource allocation decisions for all VM agents and determines the final allocations, resolving any possible conflicts. It also detects when a node is overloaded or underloaded, and passes this information to the global agent. The global agent initiates virtual machine migration decisions, moving virtual machines from overloaded or underloaded hosts to consolidating hosts to reduce losses for violating SLA and reduce the number of physical nodes. The following sections look at each of the components in the resource manager in more detail.

Fig. 1 Resource Manager Architecture
The virtual machine agent is responsible for local decisions about resource allocation by dynamically determining the total resources that should be distributed on its own virtual machine. Allocation decisions are made in discrete time intervals, where in each interval the proportion of resources in the next time interval is determined. In this work, the time interval is set to 10 seconds to quickly adapt to changing loads. The interval is not set to less than 10 seconds, since with a long-term forecasting, this would increase the number of time steps to predict in the future, reducing the accuracy of the forecast. Setting a longer time interval can lead to inefficiencies and SLA violations due to the lack of quick adaptation to changes in load. Our work focuses on CPU allocation, but in principle the approach can be extended to other resources. To allocate processor resources, use the CPU CAP setting, which most modern virtualization technologies offer. CAP is the maximum CPU power that a VM can use, as a percentage of the total capacity, which provides good performance isolation between virtual machines.
To estimate the share of CPU allocated to each VM, the CPU utilization value for the next time interval is first predicted. Then the total CPU resource is calculated as the predicted CPU utilization plus 10% of the CPU power. By setting the CPU CAP to 10% more than the required CPU usage, we can take into account the prediction errors and reduce the likelihood of SLA violations related to performance. To predict the next CPU utilization value, a time series prediction technique based on the history of previous CPU utilization values is used. In particular, machine learning based on Gaussian processes is used. Although local resource allocation requires only one step forward, our VM agent predicts several steps ahead to detect overload.
One of the responsibilities of the host agent is to play the role of arbiter. It receives processor requirements from all virtual machine agents, and, resolving any conflicts between them, it decides on the final CPU allocation for all virtual machines. Conflicts can occur when the CPU requirements of all VMs exceed the total CPU power. If there are no conflicts, the final allocation of the CPU coincides with the distribution requested by the agents of the virtual machine. If there is a conflict, the main agent calculates the final CPU allocations according to the following formula:
Final VM quota = (Required VM share / Total requested resources by all VMs) * Total CPU power
Another responsibility of the host agent, which is the main object of this work, is to determine whether the host is overloaded or underloaded. This information is transmitted to the global agent, which then initiates a live migration to move the VM from overloaded or underloaded hosts in accordance with the global distribution algorithm.
For overload detection, long-term time series prediction is used. In the context of this paper, this means a prediction of values for 7 time intervals in the future. A host is declared congested if the actual and predicted total CPU utilization for 7 time slots in the future exceeds the overload threshold. The predicted total CPU utilization for a future time slot is estimated by summing the predicted CPU utilization values of all VMs in the corresponding time slot. The value of 7 forecasting time intervals in the future is chosen so that it is greater than the estimated average time of live migration (about 4 time intervals). In this paper, the average time of live migration is considered known, and its value, equal to 4 time intervals, is estimated by averaging over all times of live VM migration over several experiments. In real scenarios, this value is not known in advance, but it can be estimated on the basis of experience. Another more subtle approach would be to apply a method for predicting the time of live migration based on current VM parameters .
Performing live migration actions for overloads that last less than the live migration time is useless, since in this case live migration does not shorten the overload time. Using a value greater than 7 time intervals is also not very useful, as it can lead to the omission of some overload conditions that will not last for a long time, but which can be eliminated through live migration. Some preliminary experiments have shown that increasing the number of prediction time intervals in the future does not improve the stability and efficiency of the approach. The overload threshold value is determined dynamically based on the number of virtual machines and depends on the system of penalties for SLA violations, which is described in more detail later.
The host agent also determines insufficient host congestion for applying dynamic consolidation by lively migrating all of its virtual machines to other nodes and shutting down the host to save power. It also uses long-term CPU time-series forecasts. A host is declared underutilized if the actual and predicted total CPU utilization within 7 time slots in the future is below the underload threshold. Again, the value of 7 time intervals is enough to skip short-term underload states, but not too large to miss any opportunity for consolidation. The threshold value is a constant value, and in this work it is set at 10% of the CPU power, but it can be configured by the administrator according to his preferences for aggressive consolidation.
To make live migration decisions, the global agent needs to know hosts that are not overloaded in order to use them as destination hosts for migrations. A host is declared as consolidating if the actual and predicted total CPU utilization over 7 time slots in the future is less than the overload threshold. The actual and predicted total CPU utilization of any time interval is estimated by summing the actual and predicted CPU utilization of all existing virtual machines, as well as the actual and predicted CPU utilization of the VMs that are planned to be transferred to the destination host. The goal is to check if the costed site will become overloaded after reconfiguring the virtual machines.
Long-term predictions carry prediction errors that can lead to erroneous decisions. To account for uncertainty in long-term forecasts, the aforementioned detection mechanisms are complemented by a probabilistic prediction error distribution model.
First, the probability density function is estimated for the prediction error in each prediction interval. Since the probability distribution of the prediction error is not known in advance, and different loads may have different distributions, a non-parametric method is required to build the density function. In this paper, a non-parametric method for estimating the probability density function is used, based on nuclear estimation of the nuclear density . It estimates the probability density function of the prediction error every time interval, based on previous prediction errors. This paper uses the probability density function of the absolute value of the prediction error. Since 7 time intervals are predicted in the future, 7 different probability density functions are created online for the magnitude of the prediction error.
Based on the probability density function for the prediction error, it can be estimated whether the future total CPU utilization is greater than the congestion threshold in each predicted time interval. To do this, we use algorithm 1, which returns true or false depending on whether the CPU usage in the future will exceed the overload threshold with a certain probability.

First, the algorithm detects the probability that CPU utilization in the future will exceed the overload threshold. If the predicted CPU usage is greater than the overload threshold, then a difference, called max_error, between the predicted CPU utilization and the overload threshold is detected. For future CPU utilization exceeding the overload threshold, the error modulus (i.e. the difference between the predicted and future value) must be less than max_error. Based on the integral distribution function of the prediction error, the probability was found that the prediction error (modulo) is less than max_error, that is, the probability that the future CPU usage is greater than the overload threshold value. Since it may happen that the future CPU usage will be greater than the overload threshold, while the prediction error will be greater than max_error. The probability of this, given as (1-probability) / 2, is added to the calculated probability. We obtain the final probability (probability + 1) / 2.
If the predicted CPU usage is less than the overload threshold, then in this case, firstly, the probability that the future CPU usage will be less than the overload threshold will be found. It is set as (1-probability). Finally, the algorithm returns true or false.
Algorithm 1 returns an overload condition for only one prediction time interval. Therefore, to declare a host congested, the actual CPU usage must exceed the overload threshold, and the algorithm must return true for all 7 prediction time intervals.
The interpretation of the need to take into account the prediction uncertainty when an overload is detected is as follows: although the prediction of CPU usage may produce values that exceed the overload threshold, it is likely that, taking into account the prediction error, the CPU load will be lower than the threshold. This means that for some time the host will not be considered overloaded, which increases the stability of the approach. This is evidenced by a smaller number of live migrations for a probabilistic approach to the detection of congestion compared to other approaches (for more details, see the section on experiments). In addition, when the prediction of CPU utilization is below the overload threshold, there is some possibility that the CPU load will be greater than the threshold value, and taking into account the prediction error, the host will be considered overloaded.
Thus, we can say that the host is considered to be overloaded or not in proportion to the uncertainty of the forecast, which is the correct approach and is confirmed by good experimental results compared to approaches that do not take into account the uncertainty of the prediction.
To determine if the host is underloaded, algorithm 3 is proposed.

The aforementioned improvements take into account the uncertainty of long-term forecasts in the detection process, but do not take into account the overhead costs caused by live migration. In this section, the presented approach is developed in the direction of the theory of optimal decision making. As a result, live migration begins only if the loss for SLA violation due to host overload is greater than the loss caused by live migration of the virtual machine.
Applying the theory of solutions, we must determine the utility function, which we will optimize. In this study, the value of the utility function is a penalty for violation of the SLA by the host or overhead costs caused by live migration. An SLA is an agreement between a cloud provider and a consumer that determines, among other things, the level of availability of services (performance) and the system of penalties for its violation. In this paper, an SLA violation is defined as the situation where the total CPU usage by a host exceeds the overload threshold for 4 consecutive time intervals. The penalty for violation of the host SLA is the percentage of CPU power that the total CPU utilization exceeded the overload threshold for all 4 consecutive time intervals. A fine can be converted to money using some conversion function, but here is the percentage of CPU power.
Since each migration of a running virtual machine is associated with some performance degradation, the penalty for each VM migration could be defined in the SLA agreement. The penalty for SLA violation, expressed as a percentage of the CPU power, is defined as the sum of all penalties for violation of the SLA for all time intervals during which VM migration continues.
The proposed approach, based on decision theory, attempts to minimize the penalty for SLA violation by the host (utility value), taking into account the penalty for violation of the SLA, caused by live migration. In the future, instead of a fine for violating the SLA, the term “utility” will be used. First, the expected utility value is estimated for the future state of the host overload. The expected utility is determined by the sum of the expected utility values of all 4 consecutive future time intervals from interval 4 to interval 7. The utility function is calculated from time interval 4 instead of time interval 1 to fix the overload condition before it occurs and eliminate this possibility by migrating the virtual machine average takes 4 time intervals.
If the future use of the CPU is known, then the usefulness of the time interval is the difference between the future use of the CPU and the overload threshold. Since only predicted CPU utilization is known, the expected utility value of one time interval can be calculated as follows:
First , the CPU utilization interval between the total CPU power and the overload threshold is divided into a fixed number of levels (5 in this paper).
It then calculates the CPU load above the overload threshold of each level (i.e. the utility value of each level). Algorithm 4 is used for this.

In Algorithm 4, Interval is the CPU usage interval over the overload threshold, Delta is the width of the CPU usage interval of the corresponding level, Level is the level number (from 0 to 4) whose utility value will be found, UsageLevels is the total number of levels, Start is the load CPU at the beginning of the interval of this level. The algorithm returns the CPU load taken from the middle of the level interval as the utility level value. Algorithm 4 is run for each possible level in order to find its utility value.
Then, for any time interval, the probability is calculated that the CPU load at some level will actually be the future CPU utilization. Does this algorithm 5.
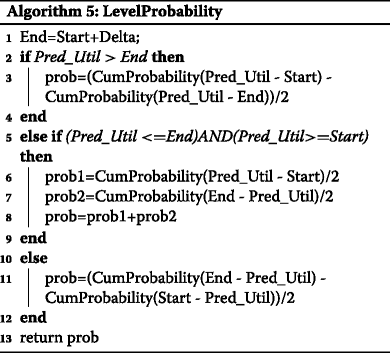
Start and Delta are calculated in Algorithm 4, Pred_Util is the total predicted CPU load of the corresponding time interval, CumProbability () is the integral distribution function used to determine the probability that the prediction error is less than a certain value, and prob is the probability that the CPU load at this level will be the actual future CPU load.
The calculation is similar to the expectation calculation formula. The expected utility of each time interval in the future is determined by the sum of the utility values at all CPU utilization levels multiplied by the corresponding level probabilities. The expected utility of the host congestion state is given as the sum of the expected utilities of 4 consecutive time slots starting at 4th. The host is declared overloaded and VM migration is needed if the expected utility, which is the expected penalty for breaking the host SLA, is more than the penalty for breaking the SLA caused by live migration.
It should be emphasized that this decision is based on short-term optimization of utility and does not take into account the accumulation of long-term utility value, which may be the result of the sum of utility values of overloads that are less than required for a migration decision, but over time can accumulate a great deal.
To solve this problem, the utility values of overload states accumulate, which are lower than the penalty for SLA violation due to live migration, and a check is performed at each time interval. If the accumulated value of the utility is greater than the penalty for violating the SLA due to live migration, then the migration is performed regardless of whether there is an overload in this time interval.
Underused hosts and destination hosts are determined using the previously mentioned approaches, but also with modernization using optimal decision theory, the purpose of which is to minimize fines.
The global agent makes decisions about the allocation of provider resources using live migrations of virtual machines from overloaded or underloaded hosts to other nodes to reduce SLA violations and energy consumption. It receives notifications from the host agent if the node is overloaded or underloaded in the future, and performs a VM migration if it is worth it.
The global agent applies the Power Aware Best Fit Decreasing ( PABFD ) algorithm to host the VM with the following adjustments. To detect overload or underload, we use our approaches presented above. To select a virtual machine, the Minimum Migration Time (MMT) policy is used, but with the modification that only one virtual machine is selected for migration in each decision round, even if the host can remain overloaded after migration. This is done to reduce the number of simultaneous virtual migrations of virtual machines and the costs associated with them. For the consolidation process, only underused hosts are considered, which are detected by the proposed approaches based on long-term forecasting. From the list of underloaded hosts, first consider those that have a lower average CPU load.
Since it is difficult for a cloud provider to evaluate performance impairments outside of virtual machines, which depend on the performance of various applications, such as response time or throughput, we have defined a general indicator of SLA impairment that can be easily measured outside of virtual machines. It is based only on the use of VM resources. More specifically, this is called a VM SLA breach and is a fine cloud computing provider for a violation of consumer virtual machine performance. The performance of an application running inside a consumer VM is at an acceptable level if the required use of virtual machine resources is less than the allocated share of the resource.
In accordance with the previous argument, a breach of VM SLA exists if the difference between the distributed share of the CPU and the CPU load of the VM is less than 5% of the CPU power during 4 consecutive time intervals.
For example, if the share of CPU allocated for a virtual machine is 35% of the CPU power, and the actual use of the CPU is more than 30% for 4 consecutive time intervals, then a violation of the VM SLA occurs. The idea behind this definition is that the application's performance degrades as the required CPU load approaches the allocated CPU resources.
The penalty for violating a VM SLA is the proportion of CPUs at which the actual CPU load exceeds the threshold difference by 5% of the allocated CPU in all 4 consecutive time slots. Although the penalty for violating the SLA is defined as a percentage of the CPU load, it can easily be converted into money using some conversion function. Thus, one of the goals of the global agent is to reduce VM SLA violations by providing sufficient free processor power by migrating running VMs. As a result, each VM should have more than 5% more CPU resources than required.
VM SLA, . . N . (100%) N*5%.
CloudSim. , VM . CloudSim, CPU CAP .
100 . , 2 . 2100 MIPS, 2000 MIPS, 8 . HpProLiantMl110G4 Xeon3040, — HpProLiantMl110G5 Xeon3075.
3 ( 300 ). , VM vCPU. vCPU 1000 MIPS, VM 500 MIPS. 1740 , 870 , 613 . CPU , PlanetLab. VM ( CloudSim), , , , . 116 , — 10 .
, , , , . , =0 0,001 CPU PlanetLab . .
Java API WEKA . CPU 20 . , 5 CPU. 30 , .
.
:
LOW HIGH, SLA - (migration penalties): mp = 2%, mp = 4% mp = 6% (MP2, MP4, MP6). CPU, . LOW HIGH CPU PlanetLab 8 14 . MP. ANOVA.
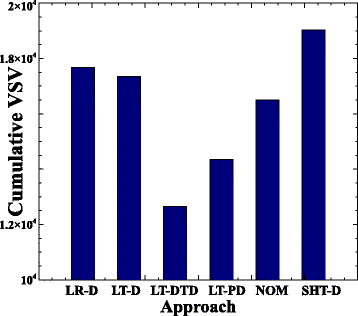
In fig. 2 VM SLA ( VSV) , . , LT-DTD LT-PD, , VM SLA . , , LR-D , SHT-D, LT-D. , , . , SLA. , LT-DTD VM SLA , , . , LT-DTD VSV LT-D 27% LT-PD 12%. LT-D SHT-D , VM SLA.
.2 VSV,
SLA VM, . 3 VSV, , . -, , SLA VM, , . , , LT-DTD VSV . , VSV LT-DTD, . , VSV LT-D 40%, LT-DTD 59%. , , LR-D, LT-D NOM, , ANOVA. , , , SLA VM, .

.3 VSV
, , . 4 VSV , . , VM SLA, , VM SLA. , LT-DTD , VSV MP2 MP4. , LT-DTD .

.4 VSV
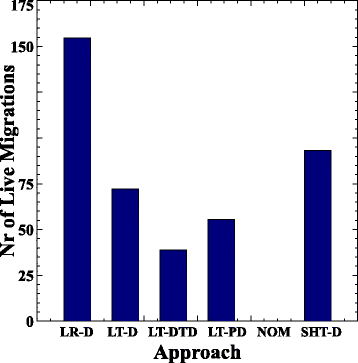
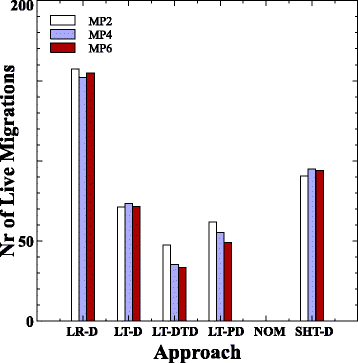
5 VM , . , LT-DTD 46 29% LT-D LT-PD . -, , , . , . , LR-D VM . , LR-D , , .
.5
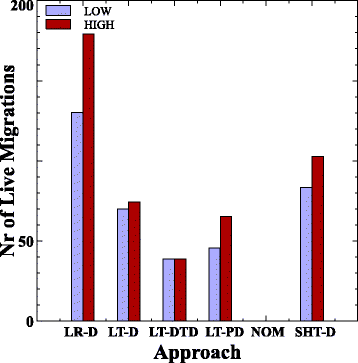
6 , . , LT-DTD LT-D, . LT-DTD , , , VSV ( 3), . LT-D , , ANOVA.
.6
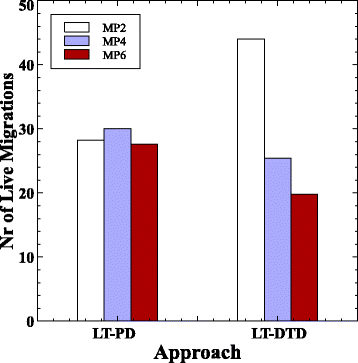
7 , , . , LT-DTD LT-PD . LT-DTD «» MP2 MP4, , . . , «» LT-PD, MP2 MP6, , , . , , LT-PD , LT-DTD, . , , . LT-PD LT-DTD, .
.7
. 8. , LT-PD, , , . LT-DTD , , .
.8 LT-PD LT-DTD
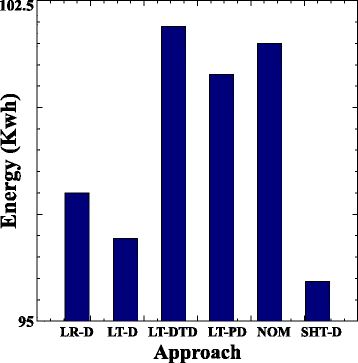
9 , . , LT-DTD . , 5 0,30% LT-D NOM, . LT-DTD , VM SLA , Utility. LR-D, LT-D SHT-D , LT-DTD, VM SLA, ESV Utility.
.9
In fig. 10, , . , , . , .

Fig. 10
, , , LT-DTD NOM. , LT-DTD , . , , , , VM SLA.
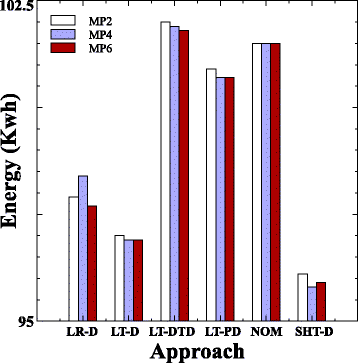
.11 , . ANOVA , . .
.11
, . 12 Utility . Utility — , , SLA VM. . , LT-DTD Utility . Utility 9,4% 4,3% LT-D LT-PD . , , LT-DTD , SLA, . , LR-D , SHT-D, , LT-D. , LR-D , LT-D SLA, 2 9.
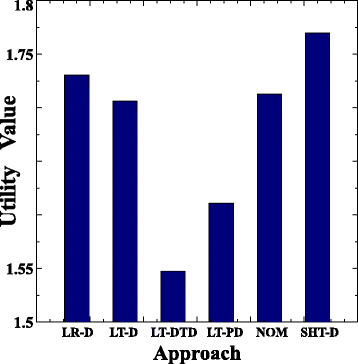
.12
13 Utility . , Utility, , SLA VM. LT-DTD Utility .
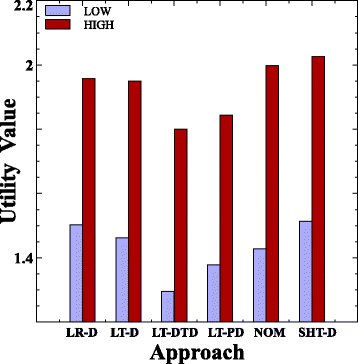
.13
14 , Utility. , , Utility, VM SLA. , LT-DTD, , . , , MP2 MP4, ANOVA.

.14
ESV , Utility.

.15 ESV
, , .
.
-, . , ( ). , , . .
-, CPU , , .
-, , - -. , . , - .
, (, CPU, RAM, I/O) .
.
Abstracting from cloud computing features, this approach can be applied when solving load balancing problems in other systems. Therefore, we hope the article will be of interest to a wide circle of readers.

')
Dynamic cloud computing workloads can be managed using live migration of virtual machines from overloaded or underloaded hosts to other nodes to save energy and reduce losses due to violation of the service level agreement (SLA). The problem is to correctly determine when the host will be overloaded in the future for timely live migration.
Introduction
Cloud computing is a promising approach where resources are provided in the form of a service, can be leased and made available to users through a network on demand. Infrastructure as a service (IaaS) is one of the widely used business models of cloud computing. Computing resources are provided in the form of virtual machines (hereinafter referred to as VM) to users who pay for consumed resources. Virtualization tools, such as Xen and VMware, allow efficient use of infrastructure resources. Virtual machines provide the ability to allocate resources dynamically according to requirements, optimizing application performance and power consumption.
One of the main opportunities for the dynamic redistribution of resources is the live migration of virtual machines. It allows cloud providers to move virtual machines from overloaded hosts, maintaining their performance under a given SLA, and dynamically consolidate virtual machines on the smallest number of hosts, in order to save power when the load is low. Using live migration and applying online algorithms that allow you to make real-time migration decisions, you can efficiently manage cloud resources by adapting resource allocation to VM loads, maintaining VM performance levels according to SLA, and reducing infrastructure power consumption.
An important issue in the context of live migration is the detection of a host congestion or underload condition. Most current approaches are based on monitoring resource utilization, and, if the actual or predicted next value exceeds a predetermined threshold, the node is declared congested. However, live migration has its price, justified by the disruption of VM performance during the migration process. The problem with existing approaches is that detecting host congestion on one measurement of resource usage or several future values can lead to hasty decisions, unnecessary overhead costs for live migration, and problems with VM stability.
A more promising approach is a decision-making approach on live migration based on projections of resource use a few steps ahead. This not only improves stability, since migration actions begin only when the load is maintained for several time intervals, but also allows cloud providers to predict the state of overload before this happens. On the other hand, forecasting a more distant future increases forecast error and uncertainty, while reducing the benefits of long-term forecasting. Another important problem is that live migration should be performed only if the penalty for possible violations of the SLA exceeds the overhead of migration.
This article presents a new approach to detecting congestion or underloading of a host, based on long-term projections of resource use, which take into account the uncertainty in forecasting and the overhead of live migration. Made the following:
- A new approach to the dynamic allocation of resources for virtual machines in the cloud environment is presented. It combines local and global distribution of virtual machine resources. Local resource allocation means allocating host shared resources for virtual machines according to the current load. Global resource allocation is tantamount to live migration, in the event of a host overload or underload, to ensure sufficient VM performance or reduce the number of hosts to save power.

- A new approach based on long-term projections of resource use is proposed to determine when a node is overloaded or underloaded. For long-term predictions, machine learning with a teacher based on Gaussian processes is used.
- To take into account the uncertainty of long-term predictions when overloads are detected online, a model of prediction error distribution is constructed using the nuclear probability density estimation method.
- To account for the overhead of the migration of virtual machines, a new approach to solving the problem, based on the utility function, is proposed. It initiates live migration only when the expected utility value (penalty) for SLA violations is greater than the cost of additional migration costs.
The proposed approach is experimentally compared with other approaches:
- with a short-term projection approach;
- with an approach that makes long-term projections without taking into account uncertainty;
- with an approach based on long-term forecasts, taking into account the uncertainty of the forecast, but without applying the theory of decision making to account for the overhead costs of live migration;
- with an approach based on the local regression method.
Resource Manager Architecture
This work focuses on managing the IaaS cloud, in which several virtual machines run on multiple physical nodes. The overall architecture of the resource manager and its main components is shown in Figure. 1. There is a VM agent for each virtual machine that determines the allocation of resources on its virtual machine in each time interval. For each host, there is a host agent that receives resource allocation decisions for all VM agents and determines the final allocations, resolving any possible conflicts. It also detects when a node is overloaded or underloaded, and passes this information to the global agent. The global agent initiates virtual machine migration decisions, moving virtual machines from overloaded or underloaded hosts to consolidating hosts to reduce losses for violating SLA and reduce the number of physical nodes. The following sections look at each of the components in the resource manager in more detail.

Fig. 1 Resource Manager Architecture
VM agent
The virtual machine agent is responsible for local decisions about resource allocation by dynamically determining the total resources that should be distributed on its own virtual machine. Allocation decisions are made in discrete time intervals, where in each interval the proportion of resources in the next time interval is determined. In this work, the time interval is set to 10 seconds to quickly adapt to changing loads. The interval is not set to less than 10 seconds, since with a long-term forecasting, this would increase the number of time steps to predict in the future, reducing the accuracy of the forecast. Setting a longer time interval can lead to inefficiencies and SLA violations due to the lack of quick adaptation to changes in load. Our work focuses on CPU allocation, but in principle the approach can be extended to other resources. To allocate processor resources, use the CPU CAP setting, which most modern virtualization technologies offer. CAP is the maximum CPU power that a VM can use, as a percentage of the total capacity, which provides good performance isolation between virtual machines.
To estimate the share of CPU allocated to each VM, the CPU utilization value for the next time interval is first predicted. Then the total CPU resource is calculated as the predicted CPU utilization plus 10% of the CPU power. By setting the CPU CAP to 10% more than the required CPU usage, we can take into account the prediction errors and reduce the likelihood of SLA violations related to performance. To predict the next CPU utilization value, a time series prediction technique based on the history of previous CPU utilization values is used. In particular, machine learning based on Gaussian processes is used. Although local resource allocation requires only one step forward, our VM agent predicts several steps ahead to detect overload.
Host agent
One of the responsibilities of the host agent is to play the role of arbiter. It receives processor requirements from all virtual machine agents, and, resolving any conflicts between them, it decides on the final CPU allocation for all virtual machines. Conflicts can occur when the CPU requirements of all VMs exceed the total CPU power. If there are no conflicts, the final allocation of the CPU coincides with the distribution requested by the agents of the virtual machine. If there is a conflict, the main agent calculates the final CPU allocations according to the following formula:
Final VM quota = (Required VM share / Total requested resources by all VMs) * Total CPU power
Another responsibility of the host agent, which is the main object of this work, is to determine whether the host is overloaded or underloaded. This information is transmitted to the global agent, which then initiates a live migration to move the VM from overloaded or underloaded hosts in accordance with the global distribution algorithm.
Overload detection
For overload detection, long-term time series prediction is used. In the context of this paper, this means a prediction of values for 7 time intervals in the future. A host is declared congested if the actual and predicted total CPU utilization for 7 time slots in the future exceeds the overload threshold. The predicted total CPU utilization for a future time slot is estimated by summing the predicted CPU utilization values of all VMs in the corresponding time slot. The value of 7 forecasting time intervals in the future is chosen so that it is greater than the estimated average time of live migration (about 4 time intervals). In this paper, the average time of live migration is considered known, and its value, equal to 4 time intervals, is estimated by averaging over all times of live VM migration over several experiments. In real scenarios, this value is not known in advance, but it can be estimated on the basis of experience. Another more subtle approach would be to apply a method for predicting the time of live migration based on current VM parameters .
Performing live migration actions for overloads that last less than the live migration time is useless, since in this case live migration does not shorten the overload time. Using a value greater than 7 time intervals is also not very useful, as it can lead to the omission of some overload conditions that will not last for a long time, but which can be eliminated through live migration. Some preliminary experiments have shown that increasing the number of prediction time intervals in the future does not improve the stability and efficiency of the approach. The overload threshold value is determined dynamically based on the number of virtual machines and depends on the system of penalties for SLA violations, which is described in more detail later.
Underload detection
The host agent also determines insufficient host congestion for applying dynamic consolidation by lively migrating all of its virtual machines to other nodes and shutting down the host to save power. It also uses long-term CPU time-series forecasts. A host is declared underutilized if the actual and predicted total CPU utilization within 7 time slots in the future is below the underload threshold. Again, the value of 7 time intervals is enough to skip short-term underload states, but not too large to miss any opportunity for consolidation. The threshold value is a constant value, and in this work it is set at 10% of the CPU power, but it can be configured by the administrator according to his preferences for aggressive consolidation.
Detecting consolidating hosts
To make live migration decisions, the global agent needs to know hosts that are not overloaded in order to use them as destination hosts for migrations. A host is declared as consolidating if the actual and predicted total CPU utilization over 7 time slots in the future is less than the overload threshold. The actual and predicted total CPU utilization of any time interval is estimated by summing the actual and predicted CPU utilization of all existing virtual machines, as well as the actual and predicted CPU utilization of the VMs that are planned to be transferred to the destination host. The goal is to check if the costed site will become overloaded after reconfiguring the virtual machines.
Uncertainty in long-term forecasting
Long-term predictions carry prediction errors that can lead to erroneous decisions. To account for uncertainty in long-term forecasts, the aforementioned detection mechanisms are complemented by a probabilistic prediction error distribution model.
First, the probability density function is estimated for the prediction error in each prediction interval. Since the probability distribution of the prediction error is not known in advance, and different loads may have different distributions, a non-parametric method is required to build the density function. In this paper, a non-parametric method for estimating the probability density function is used, based on nuclear estimation of the nuclear density . It estimates the probability density function of the prediction error every time interval, based on previous prediction errors. This paper uses the probability density function of the absolute value of the prediction error. Since 7 time intervals are predicted in the future, 7 different probability density functions are created online for the magnitude of the prediction error.
Probabilistic overload detection
Based on the probability density function for the prediction error, it can be estimated whether the future total CPU utilization is greater than the congestion threshold in each predicted time interval. To do this, we use algorithm 1, which returns true or false depending on whether the CPU usage in the future will exceed the overload threshold with a certain probability.

First, the algorithm detects the probability that CPU utilization in the future will exceed the overload threshold. If the predicted CPU usage is greater than the overload threshold, then a difference, called max_error, between the predicted CPU utilization and the overload threshold is detected. For future CPU utilization exceeding the overload threshold, the error modulus (i.e. the difference between the predicted and future value) must be less than max_error. Based on the integral distribution function of the prediction error, the probability was found that the prediction error (modulo) is less than max_error, that is, the probability that the future CPU usage is greater than the overload threshold value. Since it may happen that the future CPU usage will be greater than the overload threshold, while the prediction error will be greater than max_error. The probability of this, given as (1-probability) / 2, is added to the calculated probability. We obtain the final probability (probability + 1) / 2.
If the predicted CPU usage is less than the overload threshold, then in this case, firstly, the probability that the future CPU usage will be less than the overload threshold will be found. It is set as (1-probability). Finally, the algorithm returns true or false.
Algorithm 1 returns an overload condition for only one prediction time interval. Therefore, to declare a host congested, the actual CPU usage must exceed the overload threshold, and the algorithm must return true for all 7 prediction time intervals.
The interpretation of the need to take into account the prediction uncertainty when an overload is detected is as follows: although the prediction of CPU usage may produce values that exceed the overload threshold, it is likely that, taking into account the prediction error, the CPU load will be lower than the threshold. This means that for some time the host will not be considered overloaded, which increases the stability of the approach. This is evidenced by a smaller number of live migrations for a probabilistic approach to the detection of congestion compared to other approaches (for more details, see the section on experiments). In addition, when the prediction of CPU utilization is below the overload threshold, there is some possibility that the CPU load will be greater than the threshold value, and taking into account the prediction error, the host will be considered overloaded.
Thus, we can say that the host is considered to be overloaded or not in proportion to the uncertainty of the forecast, which is the correct approach and is confirmed by good experimental results compared to approaches that do not take into account the uncertainty of the prediction.
To determine if the host is underloaded, algorithm 3 is proposed.

Overload detection based on optimal decision making theory
The aforementioned improvements take into account the uncertainty of long-term forecasts in the detection process, but do not take into account the overhead costs caused by live migration. In this section, the presented approach is developed in the direction of the theory of optimal decision making. As a result, live migration begins only if the loss for SLA violation due to host overload is greater than the loss caused by live migration of the virtual machine.
Applying the theory of solutions, we must determine the utility function, which we will optimize. In this study, the value of the utility function is a penalty for violation of the SLA by the host or overhead costs caused by live migration. An SLA is an agreement between a cloud provider and a consumer that determines, among other things, the level of availability of services (performance) and the system of penalties for its violation. In this paper, an SLA violation is defined as the situation where the total CPU usage by a host exceeds the overload threshold for 4 consecutive time intervals. The penalty for violation of the host SLA is the percentage of CPU power that the total CPU utilization exceeded the overload threshold for all 4 consecutive time intervals. A fine can be converted to money using some conversion function, but here is the percentage of CPU power.
Since each migration of a running virtual machine is associated with some performance degradation, the penalty for each VM migration could be defined in the SLA agreement. The penalty for SLA violation, expressed as a percentage of the CPU power, is defined as the sum of all penalties for violation of the SLA for all time intervals during which VM migration continues.
The proposed approach, based on decision theory, attempts to minimize the penalty for SLA violation by the host (utility value), taking into account the penalty for violation of the SLA, caused by live migration. In the future, instead of a fine for violating the SLA, the term “utility” will be used. First, the expected utility value is estimated for the future state of the host overload. The expected utility is determined by the sum of the expected utility values of all 4 consecutive future time intervals from interval 4 to interval 7. The utility function is calculated from time interval 4 instead of time interval 1 to fix the overload condition before it occurs and eliminate this possibility by migrating the virtual machine average takes 4 time intervals.
If the future use of the CPU is known, then the usefulness of the time interval is the difference between the future use of the CPU and the overload threshold. Since only predicted CPU utilization is known, the expected utility value of one time interval can be calculated as follows:
First , the CPU utilization interval between the total CPU power and the overload threshold is divided into a fixed number of levels (5 in this paper).
It then calculates the CPU load above the overload threshold of each level (i.e. the utility value of each level). Algorithm 4 is used for this.

In Algorithm 4, Interval is the CPU usage interval over the overload threshold, Delta is the width of the CPU usage interval of the corresponding level, Level is the level number (from 0 to 4) whose utility value will be found, UsageLevels is the total number of levels, Start is the load CPU at the beginning of the interval of this level. The algorithm returns the CPU load taken from the middle of the level interval as the utility level value. Algorithm 4 is run for each possible level in order to find its utility value.
Then, for any time interval, the probability is calculated that the CPU load at some level will actually be the future CPU utilization. Does this algorithm 5.

Start and Delta are calculated in Algorithm 4, Pred_Util is the total predicted CPU load of the corresponding time interval, CumProbability () is the integral distribution function used to determine the probability that the prediction error is less than a certain value, and prob is the probability that the CPU load at this level will be the actual future CPU load.
The calculation is similar to the expectation calculation formula. The expected utility of each time interval in the future is determined by the sum of the utility values at all CPU utilization levels multiplied by the corresponding level probabilities. The expected utility of the host congestion state is given as the sum of the expected utilities of 4 consecutive time slots starting at 4th. The host is declared overloaded and VM migration is needed if the expected utility, which is the expected penalty for breaking the host SLA, is more than the penalty for breaking the SLA caused by live migration.
It should be emphasized that this decision is based on short-term optimization of utility and does not take into account the accumulation of long-term utility value, which may be the result of the sum of utility values of overloads that are less than required for a migration decision, but over time can accumulate a great deal.
To solve this problem, the utility values of overload states accumulate, which are lower than the penalty for SLA violation due to live migration, and a check is performed at each time interval. If the accumulated value of the utility is greater than the penalty for violating the SLA due to live migration, then the migration is performed regardless of whether there is an overload in this time interval.
Underused hosts and destination hosts are determined using the previously mentioned approaches, but also with modernization using optimal decision theory, the purpose of which is to minimize fines.
Global agent
The global agent makes decisions about the allocation of provider resources using live migrations of virtual machines from overloaded or underloaded hosts to other nodes to reduce SLA violations and energy consumption. It receives notifications from the host agent if the node is overloaded or underloaded in the future, and performs a VM migration if it is worth it.
The global agent applies the Power Aware Best Fit Decreasing ( PABFD ) algorithm to host the VM with the following adjustments. To detect overload or underload, we use our approaches presented above. To select a virtual machine, the Minimum Migration Time (MMT) policy is used, but with the modification that only one virtual machine is selected for migration in each decision round, even if the host can remain overloaded after migration. This is done to reduce the number of simultaneous virtual migrations of virtual machines and the costs associated with them. For the consolidation process, only underused hosts are considered, which are detected by the proposed approaches based on long-term forecasting. From the list of underloaded hosts, first consider those that have a lower average CPU load.
Virtual machine SLA violation
Since it is difficult for a cloud provider to evaluate performance impairments outside of virtual machines, which depend on the performance of various applications, such as response time or throughput, we have defined a general indicator of SLA impairment that can be easily measured outside of virtual machines. It is based only on the use of VM resources. More specifically, this is called a VM SLA breach and is a fine cloud computing provider for a violation of consumer virtual machine performance. The performance of an application running inside a consumer VM is at an acceptable level if the required use of virtual machine resources is less than the allocated share of the resource.
In accordance with the previous argument, a breach of VM SLA exists if the difference between the distributed share of the CPU and the CPU load of the VM is less than 5% of the CPU power during 4 consecutive time intervals.
For example, if the share of CPU allocated for a virtual machine is 35% of the CPU power, and the actual use of the CPU is more than 30% for 4 consecutive time intervals, then a violation of the VM SLA occurs. The idea behind this definition is that the application's performance degrades as the required CPU load approaches the allocated CPU resources.
The penalty for violating a VM SLA is the proportion of CPUs at which the actual CPU load exceeds the threshold difference by 5% of the allocated CPU in all 4 consecutive time slots. Although the penalty for violating the SLA is defined as a percentage of the CPU load, it can easily be converted into money using some conversion function. Thus, one of the goals of the global agent is to reduce VM SLA violations by providing sufficient free processor power by migrating running VMs. As a result, each VM should have more than 5% more CPU resources than required.
VM SLA, . . N . (100%) N*5%.
Experiment
CloudSim. , VM . CloudSim, CPU CAP .
100 . , 2 . 2100 MIPS, 2000 MIPS, 8 . HpProLiantMl110G4 Xeon3040, — HpProLiantMl110G5 Xeon3075.
3 ( 300 ). , VM vCPU. vCPU 1000 MIPS, VM 500 MIPS. 1740 , 870 , 613 . CPU , PlanetLab. VM ( CloudSim), , , , . 116 , — 10 .
, , , , . , =0 0,001 CPU PlanetLab . .
Java API WEKA . CPU 20 . , 5 CPU. 30 , .
.
- NO-Migrations (NOM) — CPU ( ).
- , Short-Term Detection (SHT-D) , , CPU . , . , .
- Long-Term Detection (LT-D) CPU 7 .
- Long-Term Probabilistic Detection (LT-PD) CPU 7 , .
- Long-Term Decision Theory Detection (LT-DTD) — LT-PD .
- , Local Regression Detection (LR-D) , , . , , , .
:
- VM SLA (VM SLA violation — VSV ), , — VM. , VM SLA - . VM SLA - CPU .
- ( E ) , .
- VM (Number of VM live migrations — NM ) .
- SLA, , SLA . Utility :
Utility =CVSV/NOM_CVSV+Energy/NOM_Energy
CVSV — VSV VM , Energy — , NOM_CVSV — VSV NOM, NOM_Energy — NOM. NOM_CVSV NOM_Energy . , . — , Utility. - , , SLA VM, ESV. :
ESV =E∗CVSV
E — , CVSV — VSV VM .
LOW HIGH, SLA - (migration penalties): mp = 2%, mp = 4% mp = 6% (MP2, MP4, MP6). CPU, . LOW HIGH CPU PlanetLab 8 14 . MP. ANOVA.
In fig. 2 VM SLA ( VSV) , . , LT-DTD LT-PD, , VM SLA . , , LR-D , SHT-D, LT-D. , , . , SLA. , LT-DTD VM SLA , , . , LT-DTD VSV LT-D 27% LT-PD 12%. LT-D SHT-D , VM SLA.

.2 VSV,
SLA VM, . 3 VSV, , . -, , SLA VM, , . , , LT-DTD VSV . , VSV LT-DTD, . , VSV LT-D 40%, LT-DTD 59%. , , LR-D, LT-D NOM, , ANOVA. , , , SLA VM, .

.3 VSV
, , . 4 VSV , . , VM SLA, , VM SLA. , LT-DTD , VSV MP2 MP4. , LT-DTD .

.4 VSV
5 VM , . , LT-DTD 46 29% LT-D LT-PD . -, , , . , . , LR-D VM . , LR-D , , .

.5
6 , . , LT-DTD LT-D, . LT-DTD , , , VSV ( 3), . LT-D , , ANOVA.

.6
7 , , . , LT-DTD LT-PD . LT-DTD «» MP2 MP4, , . . , «» LT-PD, MP2 MP6, , , . , , LT-PD , LT-DTD, . , , . LT-PD LT-DTD, .

.7
. 8. , LT-PD, , , . LT-DTD , , .

.8 LT-PD LT-DTD
9 , . , LT-DTD . , 5 0,30% LT-D NOM, . LT-DTD , VM SLA , Utility. LR-D, LT-D SHT-D , LT-DTD, VM SLA, ESV Utility.

.9
In fig. 10, , . , , . , .

Fig. 10
, , , LT-DTD NOM. , LT-DTD , . , , , , VM SLA.
.11 , . ANOVA , . .

.11
, . 12 Utility . Utility — , , SLA VM. . , LT-DTD Utility . Utility 9,4% 4,3% LT-D LT-PD . , , LT-DTD , SLA, . , LR-D , SHT-D, , LT-D. , LR-D , LT-D SLA, 2 9.

.12
13 Utility . , Utility, , SLA VM. LT-DTD Utility .

.13
14 , Utility. , , Utility, VM SLA. , LT-DTD, , . , , MP2 MP4, ANOVA.

.14
ESV , Utility.

.15 ESV
Conclusion
, , .
.
-, . , ( ). , , . .
-, CPU , , .
-, , - -. , . , - .
, (, CPU, RAM, I/O) .
.
Source: https://habr.com/ru/post/329416/
All Articles