5 reasons to attend a data visualization course
The term "data visualization" is no surprise now. There are more and more examples of visualization in the network, and I am sure that many habrovchane are happy to explore them and share interesting findings with friends in social networks. And who of you wondered how data visualization can bring in your daily work or for your business?
On June 17, 18 and 19 in Moscow a training course on data visualization will take place. This course is not for everyone, we address it to analysts, interface designers, developers and project managers who deal with complex data. But it seems to me that far from everyone to whom the course will be useful, think about such training.
I will tell you why a specialist or manager should take our course, what knowledge and skills he will receive. I would be glad if these reasons hook on someone from the readers, push them to independent research or bring them to our cozy study group.
Data visualization is not only bar charts and pie charts, but for some reason these two formats dominate on dashboards and in reports. Complicated data is much more interesting and richer than one or two measurements, they have a narrow scope of these formats. To reveal the data, you need to choose the way of visualization, which takes into account their features.
')
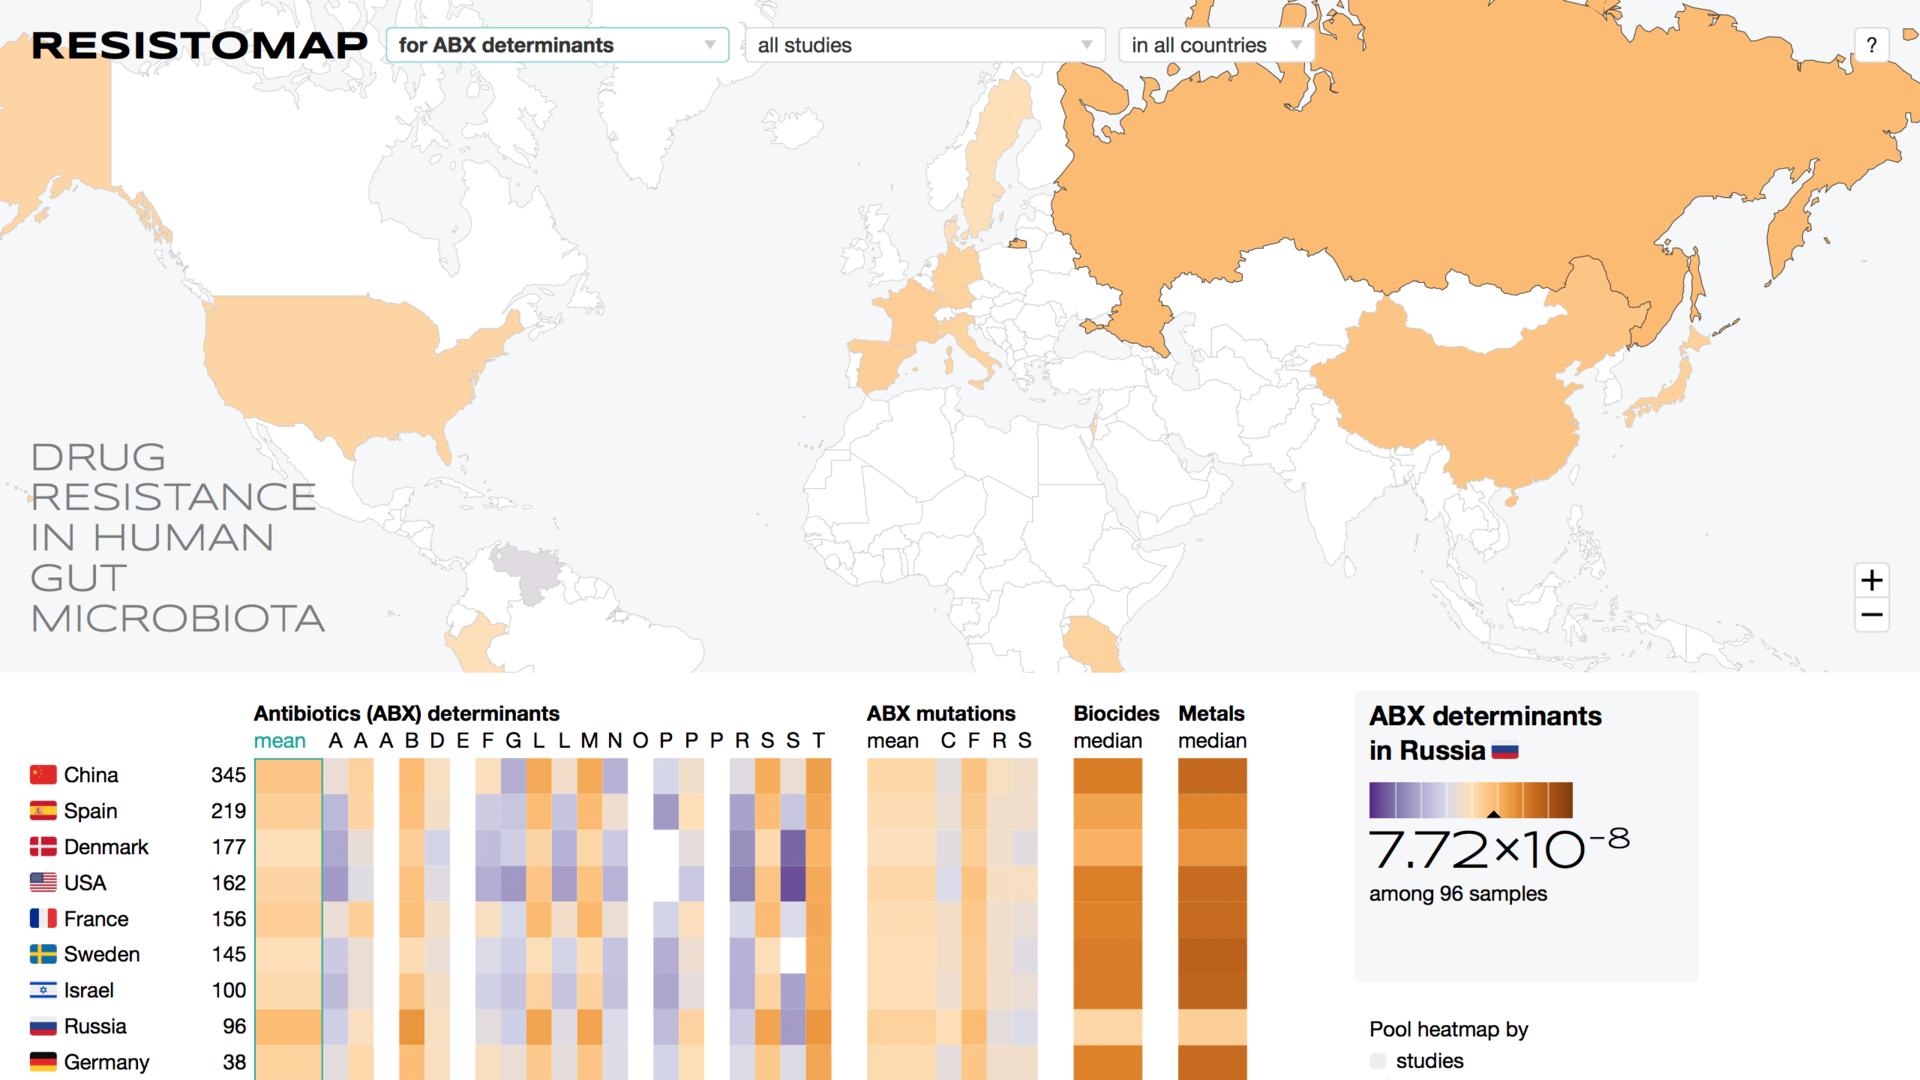
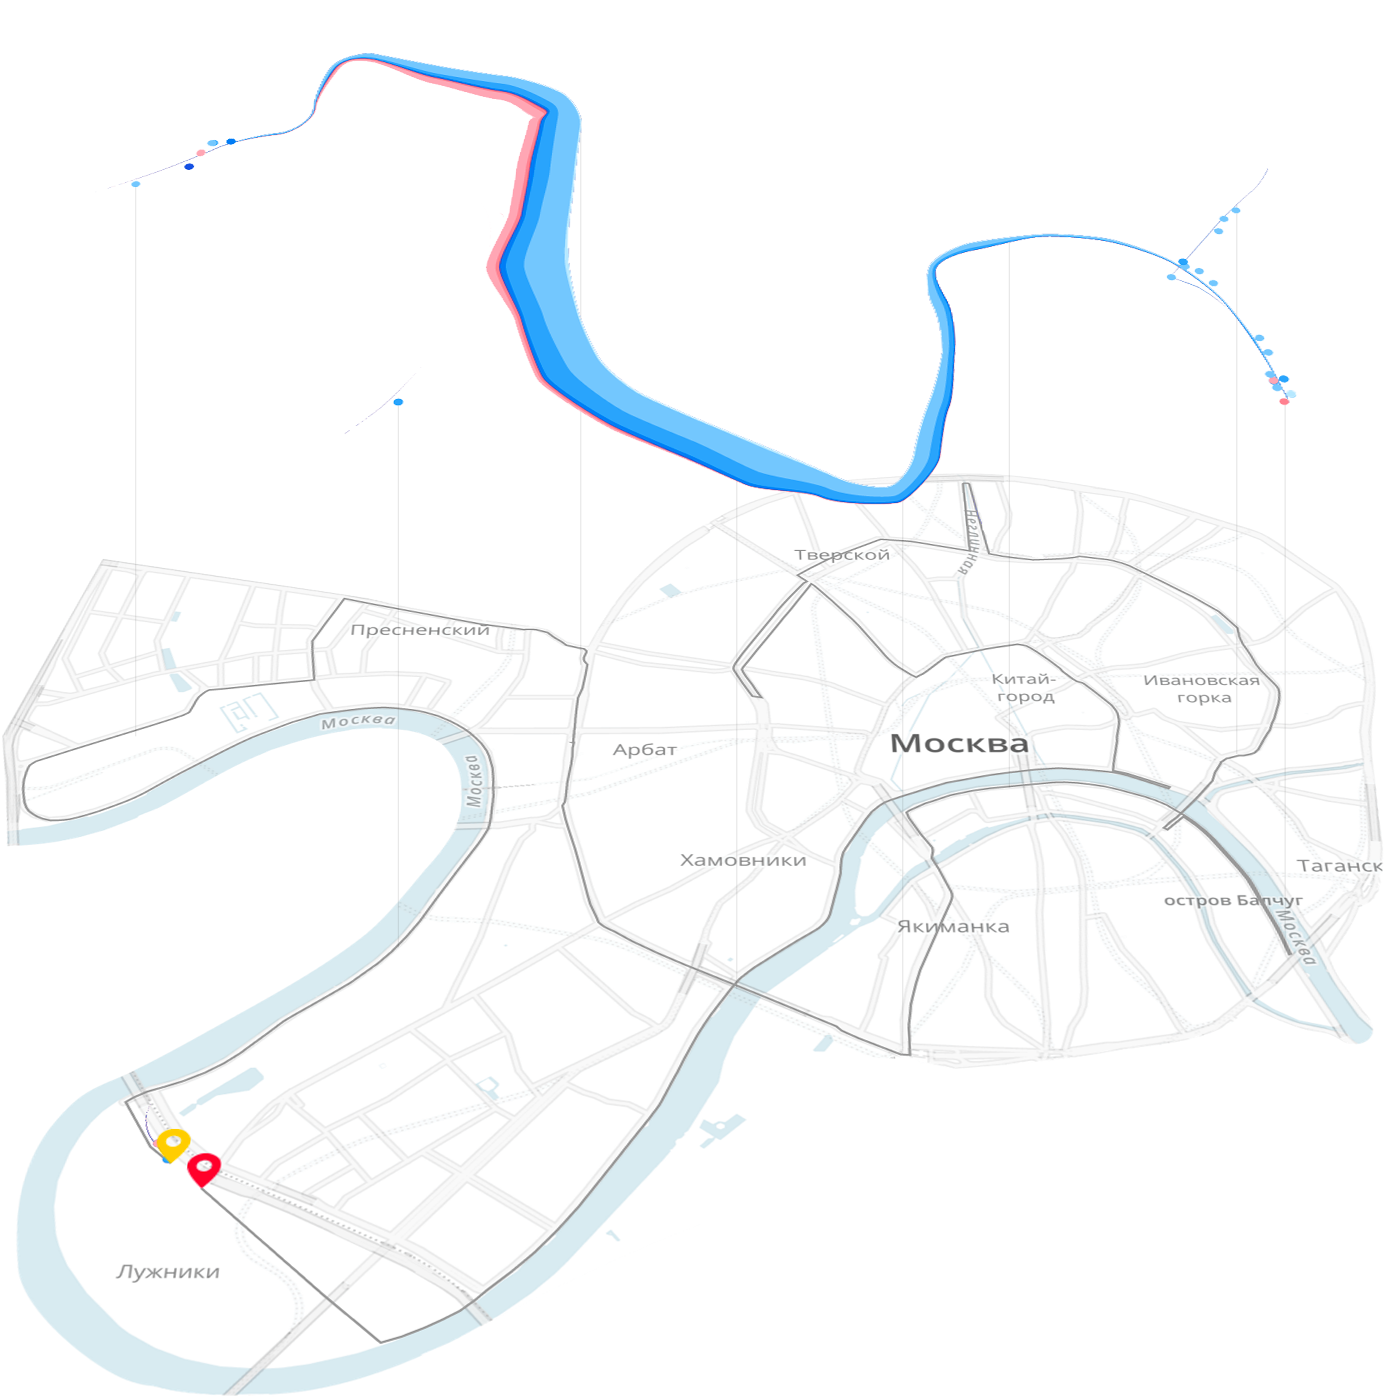
In the laboratory, we have never used the same display format for different tasks. All data is unique, and our visualizations take into account and emphasize this uniqueness. That is what makes our work useful and effective, recognized at the world level. Our visualization of the Moscow Marathon is marked by the bronze medal of the prestigious European competition “Malofey”. The intestinal bacteria resistance map , which we created together with Russian bioinformatics, was published at Oxford Bioinfrmatics - one of the most influential journals in the industry (impact factor 5.77) - and received a great response in the world's scientific circles.
On the course, we look at various examples of visualizations, non-standard formats, interesting and elegant solutions, we convince participants that beyond the framework of pay and bar charts, there is “life” and inspire experimentation.
Attention to data and work beyond standard formats not only brings medals at competitions, but also simplifies the daily work of analysts. In our practice there was a case when we turned the report on 30 Excel sheets into one interactive visualization with convenient controls:
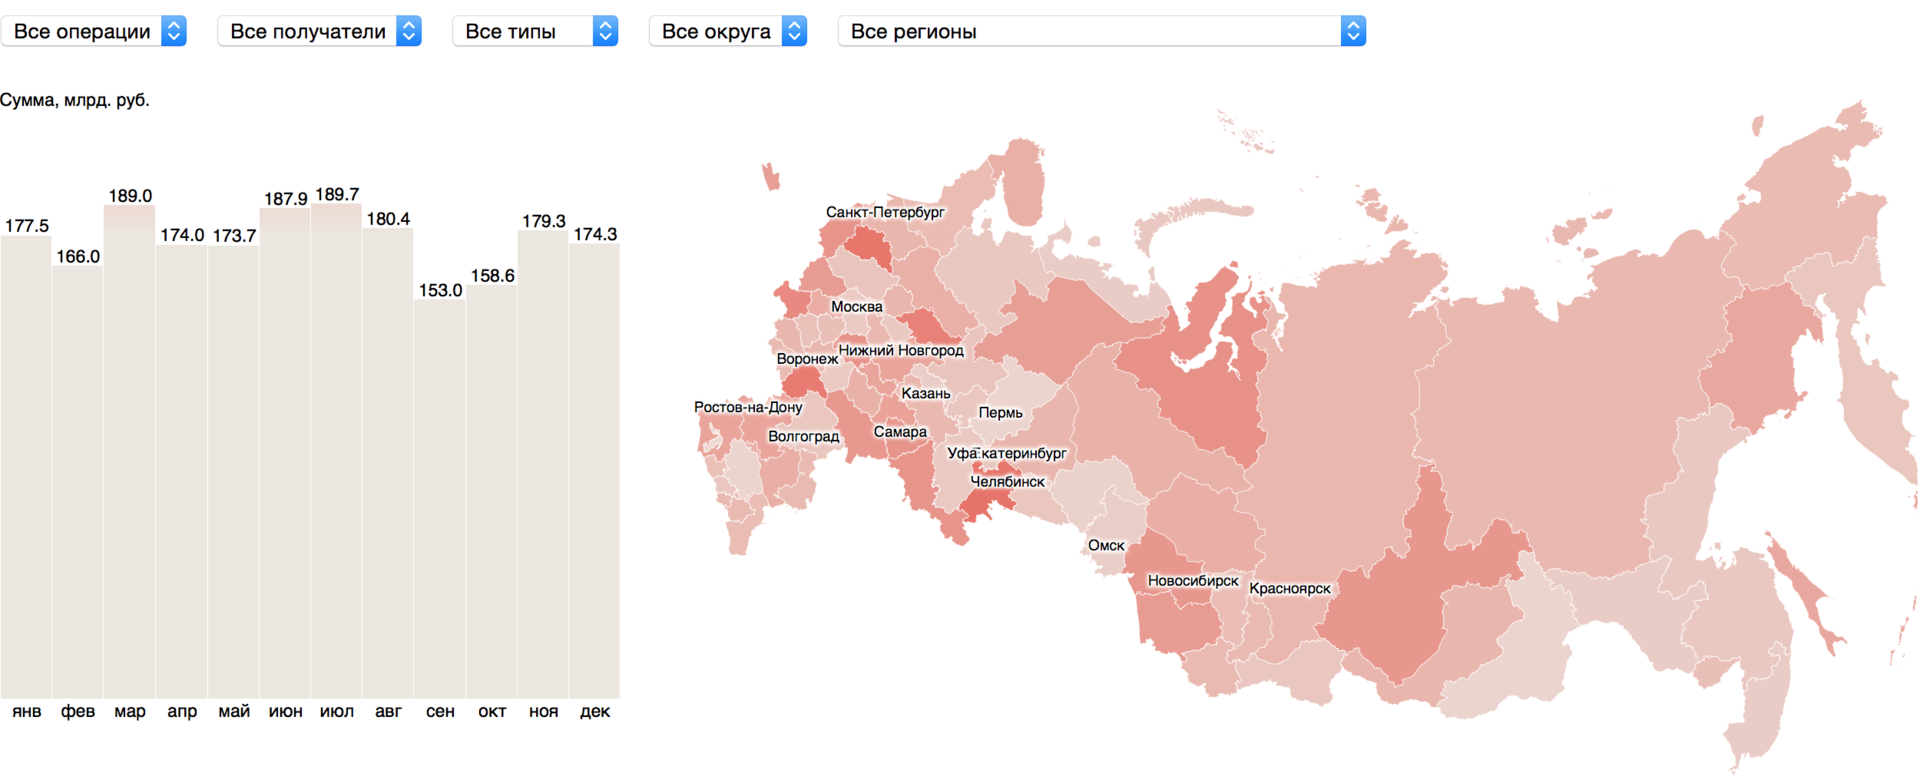
On such visualization, it is much easier to look for patterns and anomalies, it even showed sections that were not in the original report.
The main laboratory project is a service for analyzing the Skybonds securities market; it is also an analytical tool used by bank employees and traders. The service interface, on which we have been working for more than three years, consists of data. Work on this project has enriched us with a whole arsenal of useful moves and techniques.
In the course, we share the groundwork, show how to combine simple formats for common reports, and learn how to invent visualizations for non-trivial cases.
In order to transfer to the course participants not a scattered set of examples, but a knowledge system, we in the laboratory are developing an algorithm for data visualization. I already wrote about algorithm in Habré .
On the course, we analyze the algorithm in detail and follow the theory in practice without hesitation. Our approach may not be the only one for participants, but at a minimum will expand the set of tools for solving data visualization problems.
Our experience shows that the easiest and most effective way to enrich a report is to use interactivity. Therefore, in the course we analyze two tools for creating interactive visualizations.
The Scoreboard service is good because it makes it relatively easy to create interesting visualizations. The entry threshold is comparable to Excel, and the possibilities for visualization are much wider. For example, our teacher Roma Bunin repeated the famous visualization of Hans Rosling at the Scoreboard in just 14 minutes:
On the course, participants will get acquainted with the possibilities of the Table on the example of simple graphics and will be able to explore the tool more deeply under the guidance of a teacher while working on a mini-project.
The board works well with a limited set of formats and their combinations, but it has its limitations. In the laboratory, we do all projects using d3.js , the most powerful and flexible data visualization library. To work with d3, you need programming skills, even to create simple graphs you have to sweat. But in the implementation of complex non-standard formats it has no equal. Read more about d3.js in the article of the teacher of the course Dima Semyushkin on Habré.

On the course, participants will take the first steps in working with d3, get acquainted with the syntax, selections and bundles, create a simple visualization. Those who wish can plunge into the jungle of the library under the guidance of a teacher while working on a mini-project.
Data Lab is a small team that is already loaded with projects until autumn. I dream that everyone who wants to bring work with the data in his company to a new level, but for some reason, am not ready to cooperate with us, come to the course. We will be equally pleased with independent businessmen, representatives of start-ups and state corporations. I am waiting for guys (and girls) from Russian Railways, Aeroflot, Russian Post, Sberbank and Tinkoff, from MTS, Megafon and Beeline with special trepidation. I am sure that the grains of our knowledge in these companies will have a tangible effect.
All who read the note to the end, get a discount of 5 thousand rubles. To activate the discount, when recording in the "First Name and Surname" field, make a note "from the Habr" and be ready to answer which of the reasons led you to the course :)
On June 17, 18 and 19 in Moscow a training course on data visualization will take place. This course is not for everyone, we address it to analysts, interface designers, developers and project managers who deal with complex data. But it seems to me that far from everyone to whom the course will be useful, think about such training.
I will tell you why a specialist or manager should take our course, what knowledge and skills he will receive. I would be glad if these reasons hook on someone from the readers, push them to independent research or bring them to our cozy study group.
1. Expand your horizons and get inspired
Data visualization is not only bar charts and pie charts, but for some reason these two formats dominate on dashboards and in reports. Complicated data is much more interesting and richer than one or two measurements, they have a narrow scope of these formats. To reveal the data, you need to choose the way of visualization, which takes into account their features.
')
In the laboratory, we have never used the same display format for different tasks. All data is unique, and our visualizations take into account and emphasize this uniqueness. That is what makes our work useful and effective, recognized at the world level. Our visualization of the Moscow Marathon is marked by the bronze medal of the prestigious European competition “Malofey”. The intestinal bacteria resistance map , which we created together with Russian bioinformatics, was published at Oxford Bioinfrmatics - one of the most influential journals in the industry (impact factor 5.77) - and received a great response in the world's scientific circles.
On the course, we look at various examples of visualizations, non-standard formats, interesting and elegant solutions, we convince participants that beyond the framework of pay and bar charts, there is “life” and inspire experimentation.
2. See how visualization solves business problems
Attention to data and work beyond standard formats not only brings medals at competitions, but also simplifies the daily work of analysts. In our practice there was a case when we turned the report on 30 Excel sheets into one interactive visualization with convenient controls:
On such visualization, it is much easier to look for patterns and anomalies, it even showed sections that were not in the original report.
The main laboratory project is a service for analyzing the Skybonds securities market; it is also an analytical tool used by bank employees and traders. The service interface, on which we have been working for more than three years, consists of data. Work on this project has enriched us with a whole arsenal of useful moves and techniques.
In the course, we share the groundwork, show how to combine simple formats for common reports, and learn how to invent visualizations for non-trivial cases.
3. Get acquainted with the data visualization algorithm
In order to transfer to the course participants not a scattered set of examples, but a knowledge system, we in the laboratory are developing an algorithm for data visualization. I already wrote about algorithm in Habré .
On the course, we analyze the algorithm in detail and follow the theory in practice without hesitation. Our approach may not be the only one for participants, but at a minimum will expand the set of tools for solving data visualization problems.
4. Learn to quickly do cool things in the scoreboard
Our experience shows that the easiest and most effective way to enrich a report is to use interactivity. Therefore, in the course we analyze two tools for creating interactive visualizations.
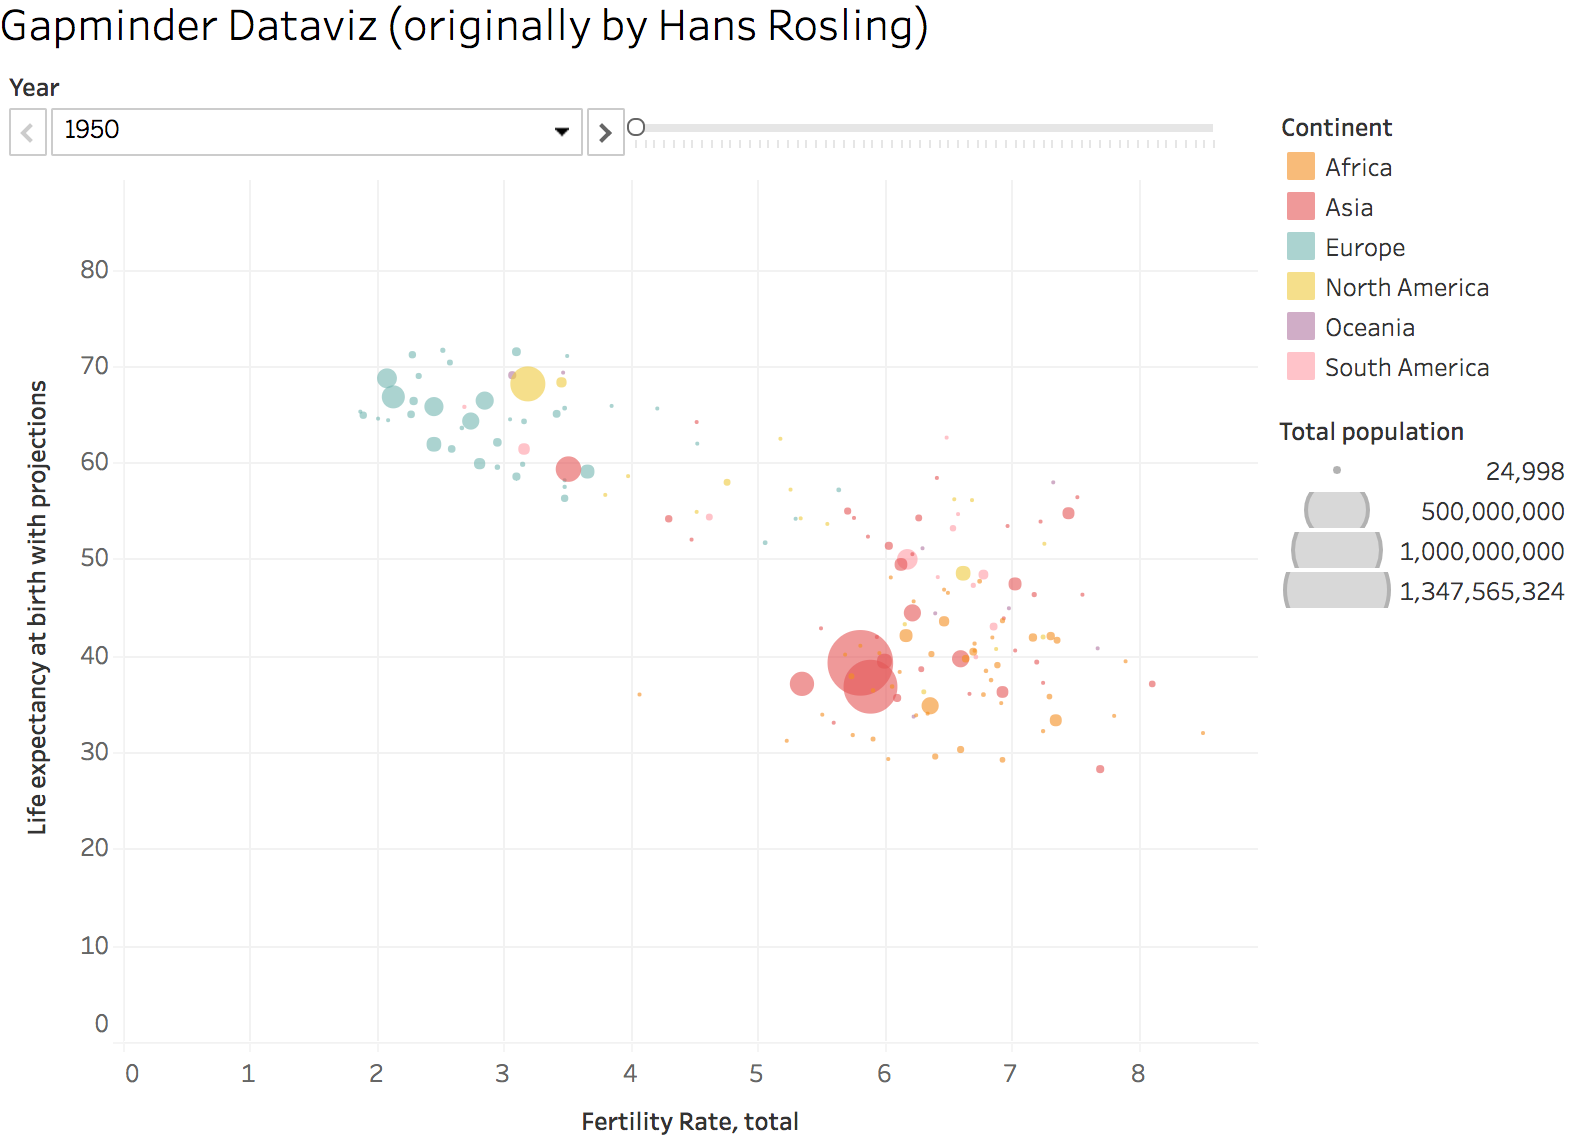
The Scoreboard service is good because it makes it relatively easy to create interesting visualizations. The entry threshold is comparable to Excel, and the possibilities for visualization are much wider. For example, our teacher Roma Bunin repeated the famous visualization of Hans Rosling at the Scoreboard in just 14 minutes:
On the course, participants will get acquainted with the possibilities of the Table on the example of simple graphics and will be able to explore the tool more deeply under the guidance of a teacher while working on a mini-project.
5. Get to know d3 and find out that nothing is impossible
The board works well with a limited set of formats and their combinations, but it has its limitations. In the laboratory, we do all projects using d3.js , the most powerful and flexible data visualization library. To work with d3, you need programming skills, even to create simple graphs you have to sweat. But in the implementation of complex non-standard formats it has no equal. Read more about d3.js in the article of the teacher of the course Dima Semyushkin on Habré.
On the course, participants will take the first steps in working with d3, get acquainted with the syntax, selections and bundles, create a simple visualization. Those who wish can plunge into the jungle of the library under the guidance of a teacher while working on a mini-project.
***
Data Lab is a small team that is already loaded with projects until autumn. I dream that everyone who wants to bring work with the data in his company to a new level, but for some reason, am not ready to cooperate with us, come to the course. We will be equally pleased with independent businessmen, representatives of start-ups and state corporations. I am waiting for guys (and girls) from Russian Railways, Aeroflot, Russian Post, Sberbank and Tinkoff, from MTS, Megafon and Beeline with special trepidation. I am sure that the grains of our knowledge in these companies will have a tangible effect.
All who read the note to the end, get a discount of 5 thousand rubles. To activate the discount, when recording in the "First Name and Surname" field, make a note "from the Habr" and be ready to answer which of the reasons led you to the course :)
Source: https://habr.com/ru/post/329370/
All Articles