Library for visualizing sports seasons
The next season of the English Premier League ended yesterday, and this is an excellent opportunity to talk about the visualization of sports seasons.
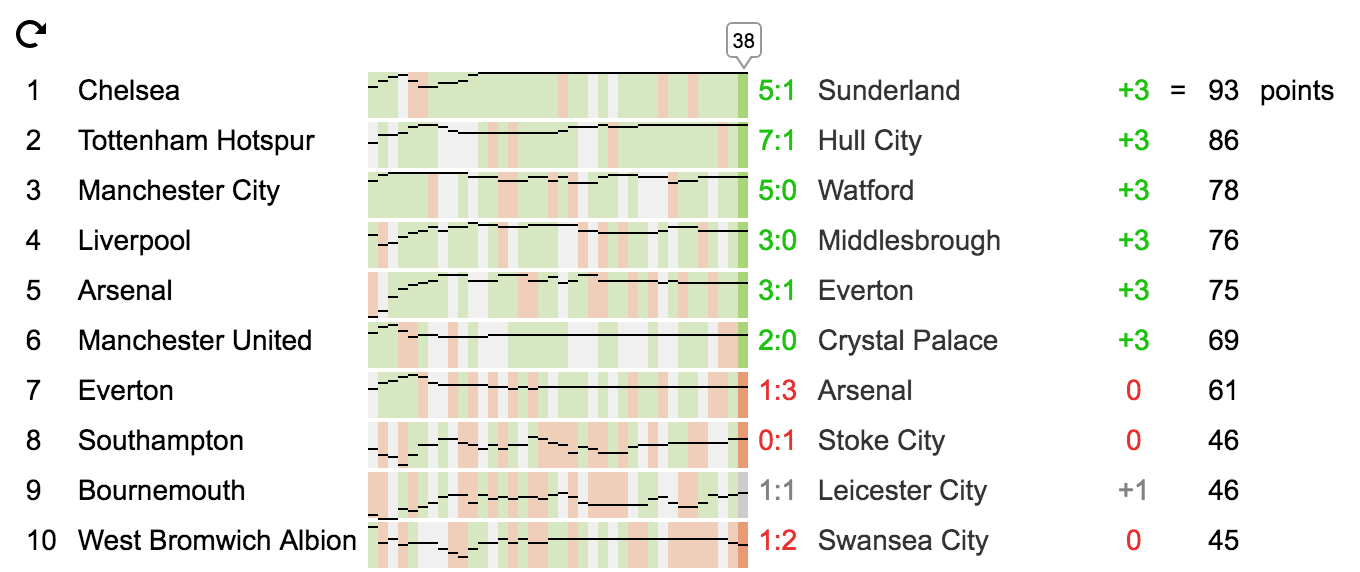
Six months ago, I wrote about how to turn a static table with the results of the sports season into an interactive one. Let me remind you that she looked like this:
')
Since then,
Architecture
The library consists of five independent modules:
configureextracts data attributes from HTML and prepares the configuration for the remaining modules.extractextracts data from a file or APItransformconverts data to standard formatcalculateconsiders victories, defeats, goals and other things, and also adds meta-information.visualizedraws an interactive table and returns an object with methods likeplay()anddrillDown(item)
But there are few modules, so
extract , transform and visualize themselves consist of submodules.
Each module knows what it will come to the input and what it needs to give to the output.
This architecture allows you to add features quickly and painlessly. So, to support JSON files in
extract , it was enough to add 13 lines of code.Visualizers
But this is not the coolest. At some point, it became clear that trying to ideally adapt the same table to different sports through data attributes is the path to nowhere. Therefore,
visualize have appeared in visualize. The visualizer determines how to build the table, how to move between rounds and how to delve into the results of the team.Thanks to the visualizers from the same data, you can get two very different tables:

Now, if you want to experiment with the visualization of, for example, the Formula 1 season, you don’t have to prepare the data and program the table animation - the library will do all this for you. Just write your visualizer.
Or do as Acne. Acne made a beautiful prototype , and we revived it and added it to the library:
Result
Play with live tables:
The library can work with csv and json files, manages a list of matches and a table of points and offers two visualizers: a classic table and a table with sparklines.
Using
As before, the source code lies on Github , and next to it is the documentation.
It assumes two use cases: connect scripts to the head and enjoy how divs turn into interactive tables, or install the library via npm and program miracles.
Merciful license allows you to use the library without restrictions on any sites.
We will be glad to receive comments, suggestions and pull requests.
Source: https://habr.com/ru/post/329230/
All Articles