PostgreSQL Diagnostic Techniques - Vladimir Borodin and Ildus Kurbangaliev
One of the most popular reports of the PG Day conference in 2015 was the story of Vladimir Borodin and Ildus Kurbangaliev about situations when the state of the base becomes bad, you need to diagnose them and look for bottlenecks. All examples in the report are taken from the real practice of Yandex, accompanied by illustrations and a detailed story about the search for “bottleneck”. Despite the fact that the problems were considered in the context of 9.4 and 9.5 versions of the database, the overall value and practical applicability of the councils of Vladimir and Ildus remains unchanged. We are glad to offer you a transcript of this report .
The introduction of Ilya Kosmodemyansky : now we will have a story about how to live, if you really want to have an Oracle, but it is not. In fact, this is a useful report, because one of the problems we now have is the problem of diagnostic tools. Diagnostic tools are sometimes lacking, sometimes instead of the usual diagnostic tools, you need to use rather complex tools, which are generally intended for Linux developers, and not for DBA. DBA teeth start to hurt when they look at these scripts. And now the guys from Yandex and PG Pro will talk about Postgres diagnostic methods that they use, how to use them, and tell you a little about how they are going to improve this world.
Vladimir Borodin : Hello everyone. My name is Vova, and I am admin Yandex mail. The report is joint with Ildus, he is developing PostgreSQL at Postgres Pro.
')
The Postgres Diagnostics Report and an important moment in it are pictures. The first part of the report is about what to do, what to do if you have failed monitoring.

Where to run in this case? Monitoring exploded - this is such an abstract thing, meaning that monitoring connected to the database exploded.
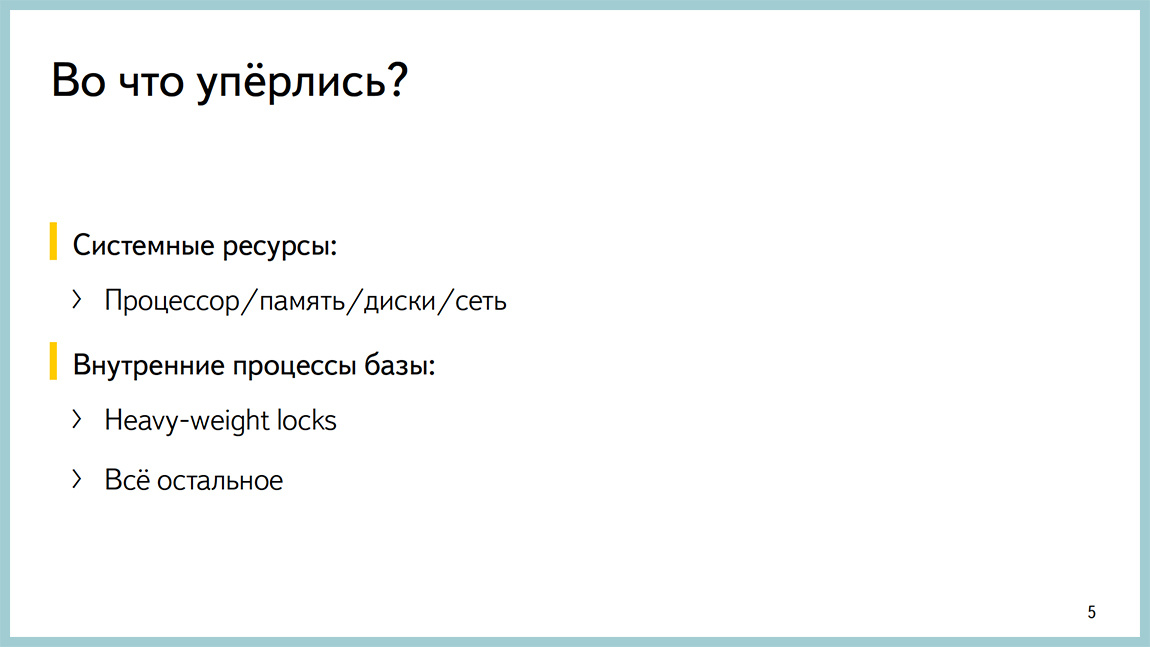
We think Postgres is a good database. A good database, when it is all bad, then it comes up against something, as a rule. In most cases, this is some kind of system resource. It lacks the processor. It lacks disks or even a network. She may well rest on heavy-weight locks, locks on the lines, signs, something else. But there are cases when the base rests on something else.
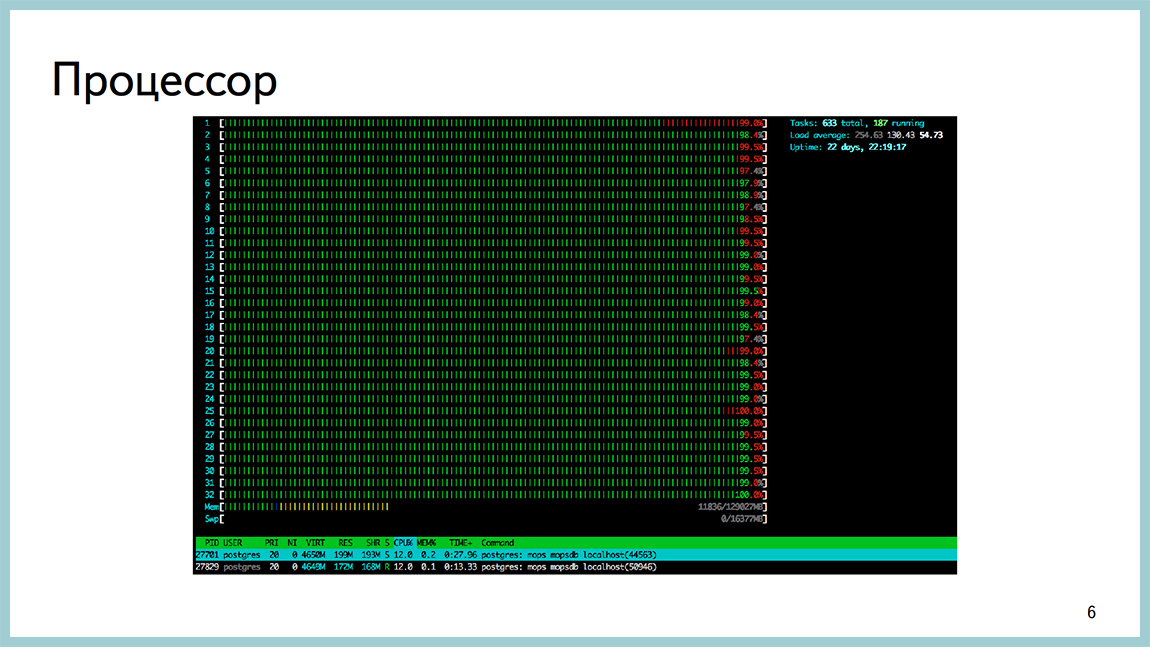
Some pictures from the same production. Here, for example, htop from one Postgres of base which rested against the processor. Load Average 200, a lot of sessions and a processor in userspace, it happens.
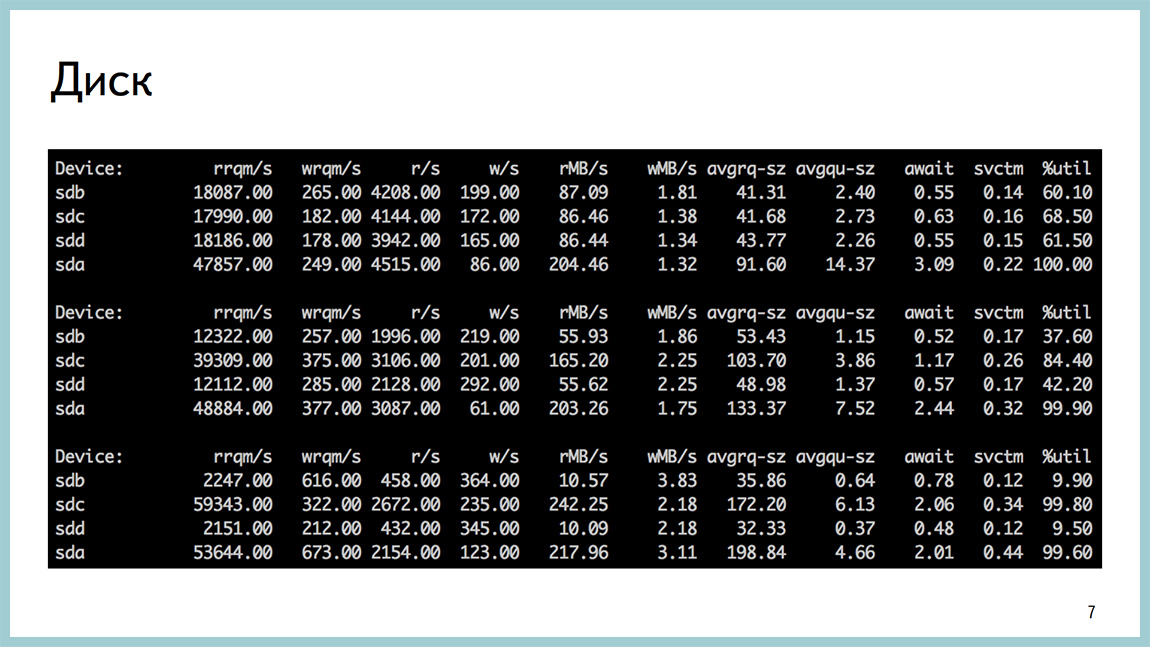
The base can also be rested against the disks. Posgres quite popular thing. Disposal on a pair of disks is close to 100%. await a huge amount of disk reads.

The disk can end not only according to iops or throughput, it can also end in place, unfortunately. This is a picture with a base where it ended on a section with xlog.

We have situations when the base rests on the network to transfer ixlogs to replicas, to the archive or elsewhere on “thick” responses to clients.
In the case of memory, everything is more complicated. As a rule, you will not see that you have a problem with memory. Depending on how your operating system is configured, or you will start to get into SWAP and see this as a problem with disk activity, or OOM will come, kill the backend, and as a result, the whole Postgres will be formed.
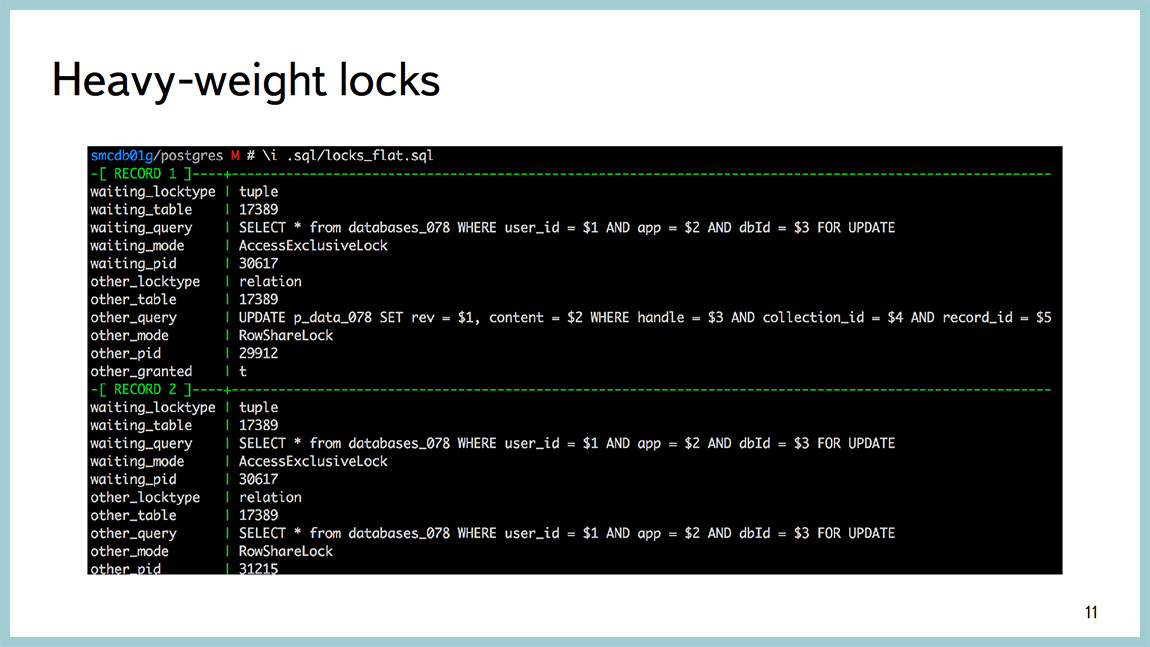
This is all well diagnosed by tools external to Postgres. That is favorite top-like utility, dstat, iostat, etc. I am talking mainly about Linux. If the base rests on heavyweight locks, this information is quite possible to look through PG locks, and there are some number of requests that facilitate the parsing of the output from there with your eyes. But they are compiled on the Postgres wiki. Actually, the example above shows everything beautifully.
The explosion occurred, you have rested against something. Because of what they rested, the devil knows. In most cases, something has changed, something rolled out, you have increased the load on the base, as in this picture, or the plan of some query went and it did not work as expected.
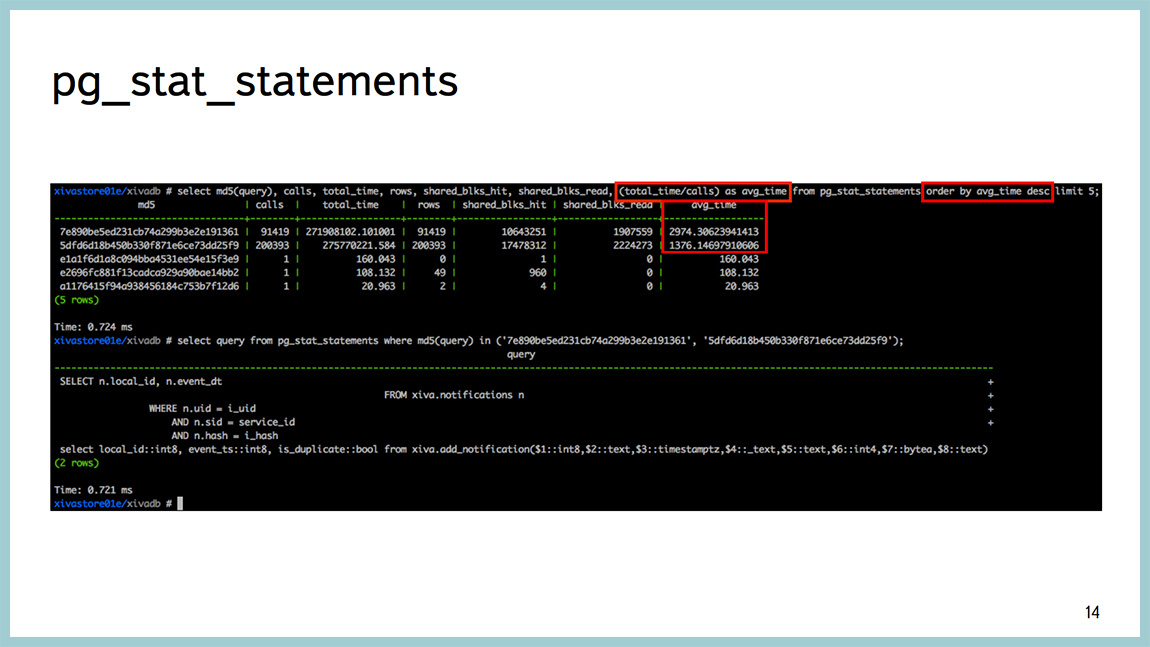
Before version 9.4, there was a good tool pg_stat_statements. You can look up to the query, which of them consumes the most time. That is, for which requests the base spends the most time. Well, after that it’s already standard, explain analyze to see where they spend their time, what they do and so on. But the time that the database spends on the execution of requests is not the best indicator. This time can be spent on a variety of resources. You can read from disk, you can "rape" the processor, you can sort something, you can expect some kind of blocking and so on.
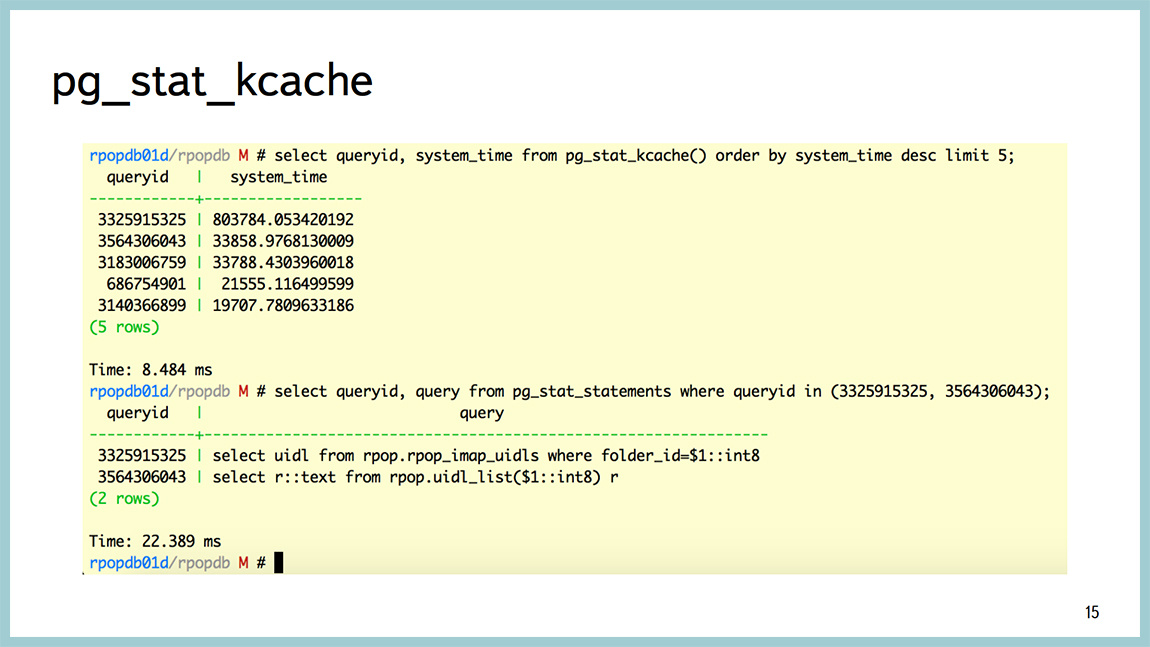
Starting from 9.4, a great thing appeared, which is called pg_stat_kcache, which allows you to look up to the request, including CPU consumption in user time, CPU consumption in system time. And the very cool thing that she can do is to separate the physical reads from the disk and retrieve page cache data from the operating system.

A few examples. For example, a query that also accurately displays information on top queries. Again, sorted by time. But it also shows how much they ate the processor in system time, user time, how much they wrote / read from the disk, how many they got from memory, and so on. You can see the texts of these requests.
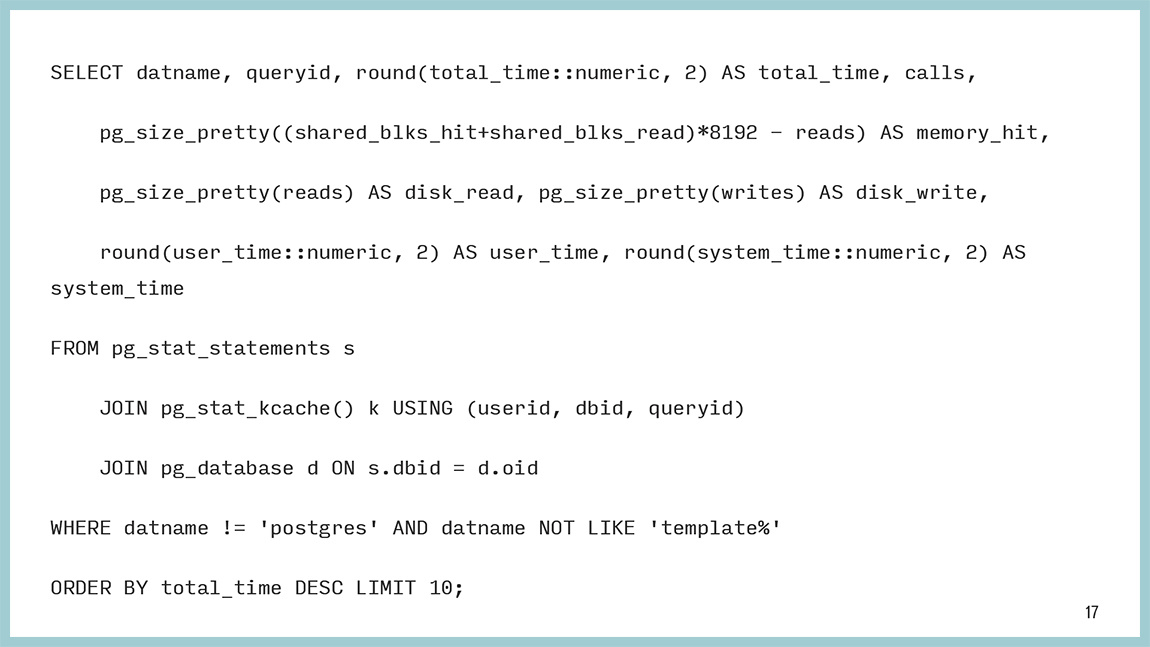

The request itself looks like this. This text can be copied. He really is not so complicated. It's simple. We take data from pg_stat_statements, pg_stat_kcache and sort it, in this particular case, also by the time it spent on this request.

But this is not the biggest advantage of pg_stat_kcache. You can sort by read from disk, write to disk, etc. For example, the same pg_stat_statements can split shared_hit and shared_read. This means reading from shared memory (shared buffers) and everything else. And all this can be from the page cache of the operating system, and can be physically from the disk. pg_stat_kcache can divide them. It does this with the help of the getrusage () system call, which is pulled after each request.
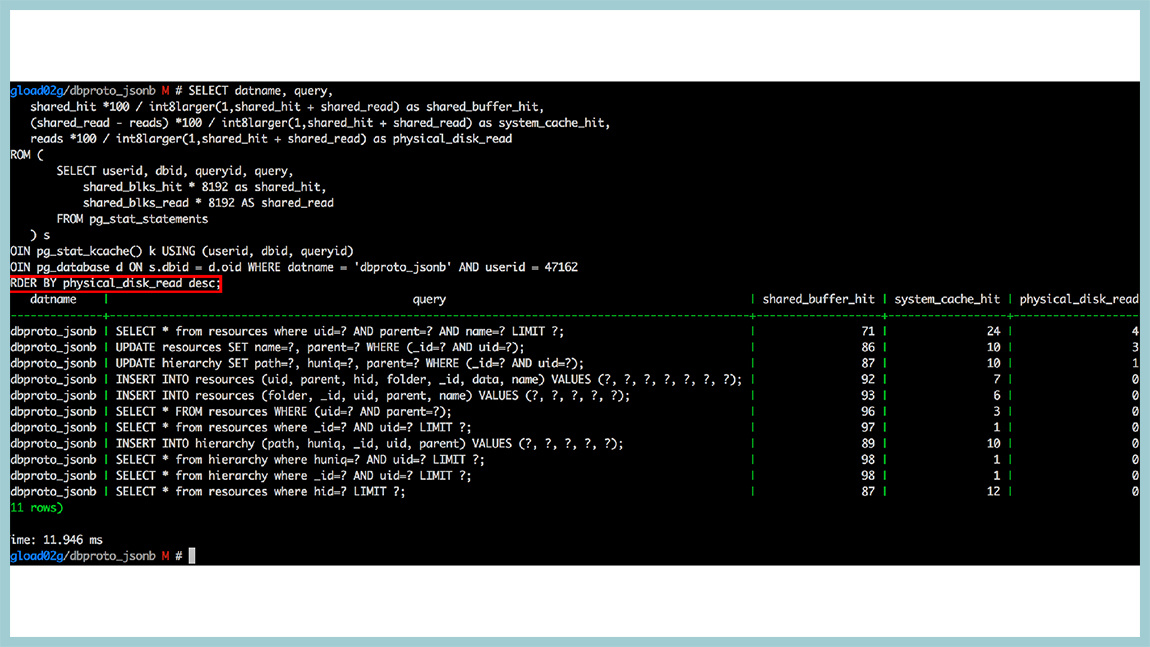
For example, we had a base that rested on a disk with readings, and we built such a thing: a request that sorts by physical reading from the disk. And these are already relative values. Here we see that we have requests that are in the top. They have a few percent to reach the disk and read something from the disk. Everything else is given either from shared memory or from the operating system cache. That is, caching in this database worked quite efficiently. If you are using 9.4, be sure to use pg_stat_kcache, great stuff.
There are more complicated problems that are not determined at all by specific requests. For example, such a problem. We take and on the first arrow we increase disk IO. Description of the fields in the middle of the picture. These two columns are iops. We increase iops from 10 thousand to 100 thousand. And after some time, our base starts the whole processor to kill in the system time. At this point in time, everything becomes bad and in general it is not clear what it does. And if we look in pg_stat_statements or pg_stats_kcache, we will see that in systemtime, the system performs almost all requests. This is not a problem with any particular request.
To diagnose what a processor is being spent on, there is a wonderful perf utility, it is useful not for DBA and more for kernel developers, but it works by sampling, it does not hurt the combat processes. Generally not "rape" the system. And here it is clear that most of the processor time is spent in the spinlock. At the same time, it can be seen that, most likely, we are spinning on getting lightweight locks. And, most likely, in the area of the buffer cache. Called PinBuffer, UnpinBuffer, ReadBuffer and so on. Looking at this perf top output, you can understand where the process is wasting in system time or assume where it is spent inside the database.
There are worse situations when we see the same spinlock, but at the same time there is nothing at all clear where this spinlock comes from and what to do next.

There should be a meme picture. We can climb deeper, to see what is happening there and what we rested.

There are a number of tools for this. One of them is dtrace and systemtap (in the case of Linux). Its advantage is that you can literally see everything. But for this you need to write some code. This is the first. Second, you need to rebuild Postgres so that the systemtap can climb into it. And the biggest problem is that the systemtap is not applicable under any conditions. It can be used on stands for load testing. Because it does not always work stably and can add up to “production”. We have this happened several times. As an advertisement, I wrote about the debugging of the situation with the help of systemtap in “blozhik”
Another tool is the classic GDB debugger, and we use it. Very simply, it clings to the process, removes backtracks from threads, in the case of Postgres - one process, one thread. Therefore, just remove the bektreys. And uncoupled from the processor.

The output is as follows. It shows that we hang on waiting for a lightweight weight (light-weight lock) in the area of work with the buffer cache and it is not easy somewhere there, but on a specific line of sources. We can go to the source code for the 591 line bufmgr.c and see what happens there. Even if you do not know C, there are quite good comments and you can understand where and what is happening.
The only thing that GDB has is an unpleasant drawback. If you cling to the process and tell ctrl + C , the process will not be reached by SIGTERM or SIGQUIT , but by SIGKILL , and Postgres will add it to you. Therefore, we wrote a very stupid binding. It simply does not send all those signals that you send to this strapping before GDB. Accordingly, it also does not reach to the back-end backends.
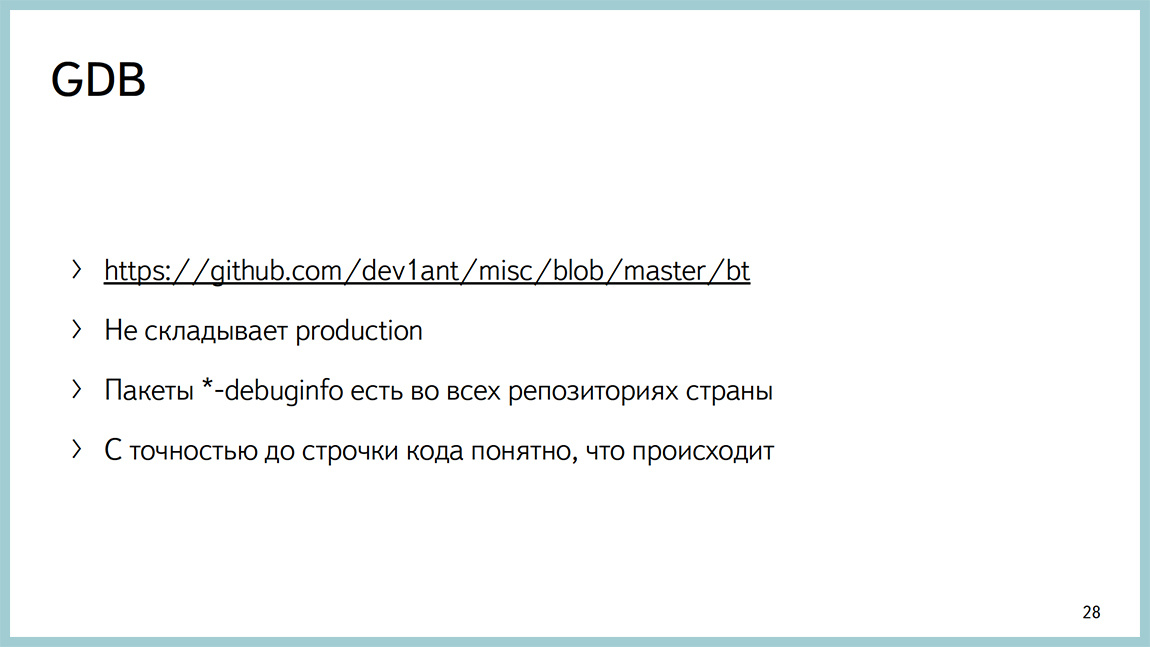
Patching allows us to remove spectra from the back end, and continue to stare at them with our eyes and understand what is happening there. One of the advantages is that it works stably and does not hurt the “fight”. In order for this to work, you do not need to rebuild anything. You just need to put the debuginfo packages: postgresql-debuginfo, libc-debuginfo, kernel-debuginfo, and you will be happy. It is important, it gives an accuracy to the line of code understanding where exactly backends spend time.

The second part of the presentation is devoted to what to do when you do not come up with some kind of performance problem, it is reproduced with confidence. You do not know how to treat it further. And you are prompted to write to the list and ask what to do. But before you write to the newsletter, you can collect more diagnostics.
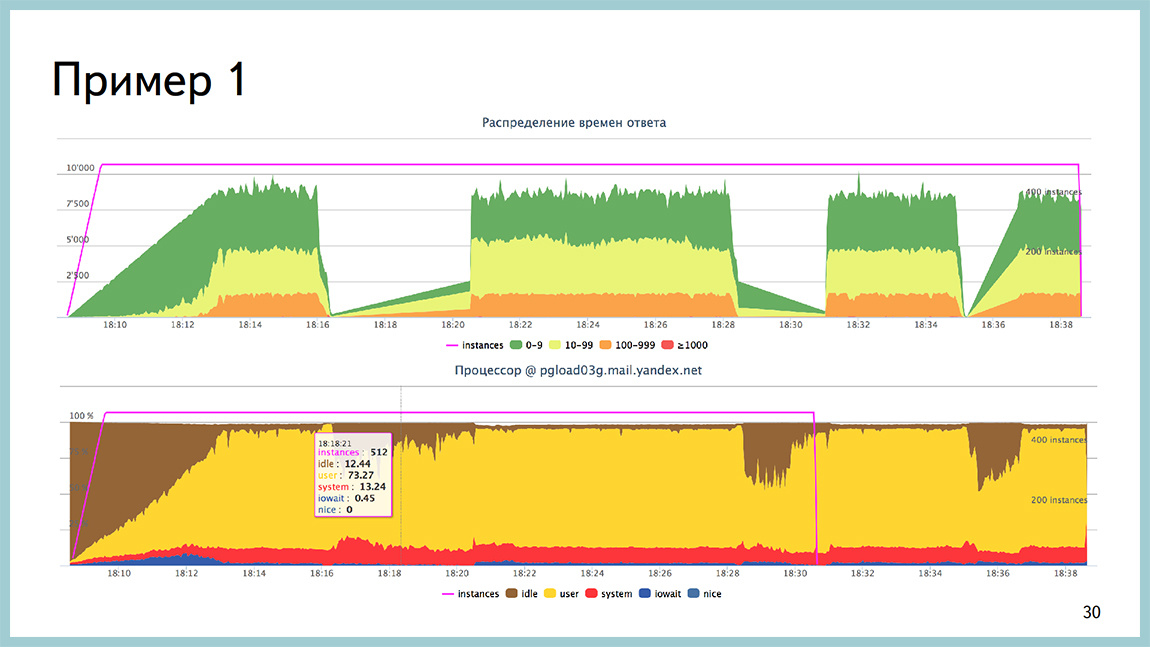
A few examples. For example, we had this situation. We shot at the base, which rested against the processor. Here on the second picture you can see that the yellow one is a processor in userspace, it is all, almost, eaten. At the same time, at such a profile load, we had time intervals up to two minutes, when the base did not process the load at all. Everything was a stake. Bursts from the operating system was not visible.
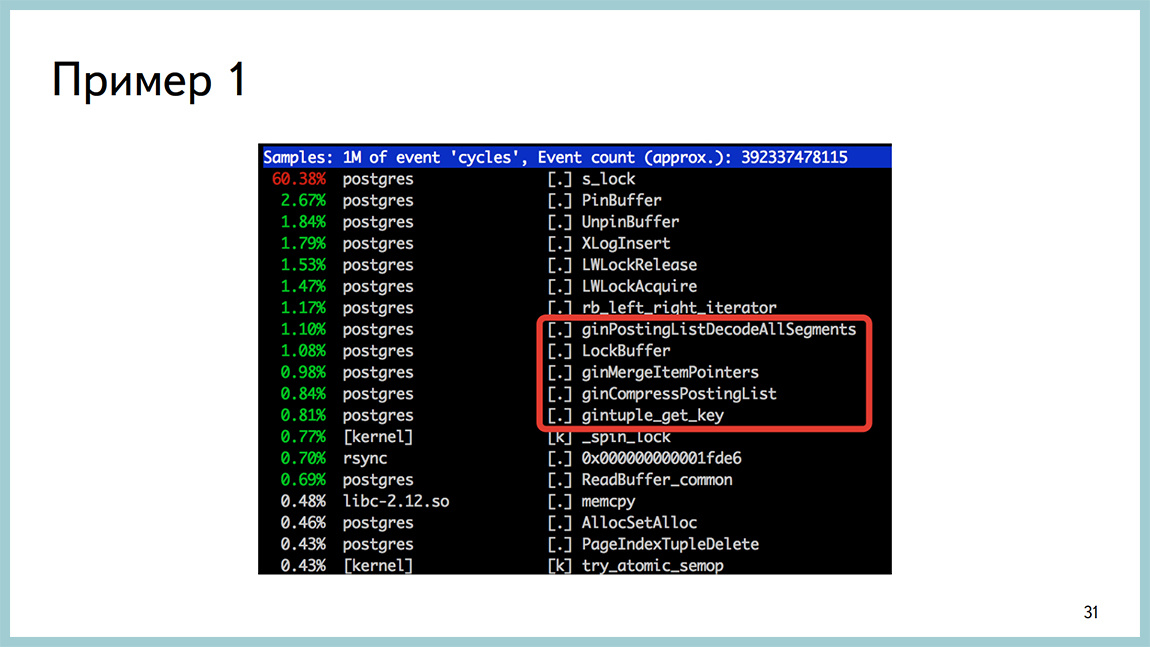
At the conclusion of the perftop, too, nothing that would have struck the eye was not there either. The only thing we paid attention to at that point in time is that when this failure appears in the output, then there are calls to work with gin. Given that there is a very small amount of time spent on it. But as soon as failure, they appear. As soon as everything becomes good, they disappear. We had one gin-index in this database. First of all, we turned it off and turned off the request that this gin-index used, and saw that everything was fine.
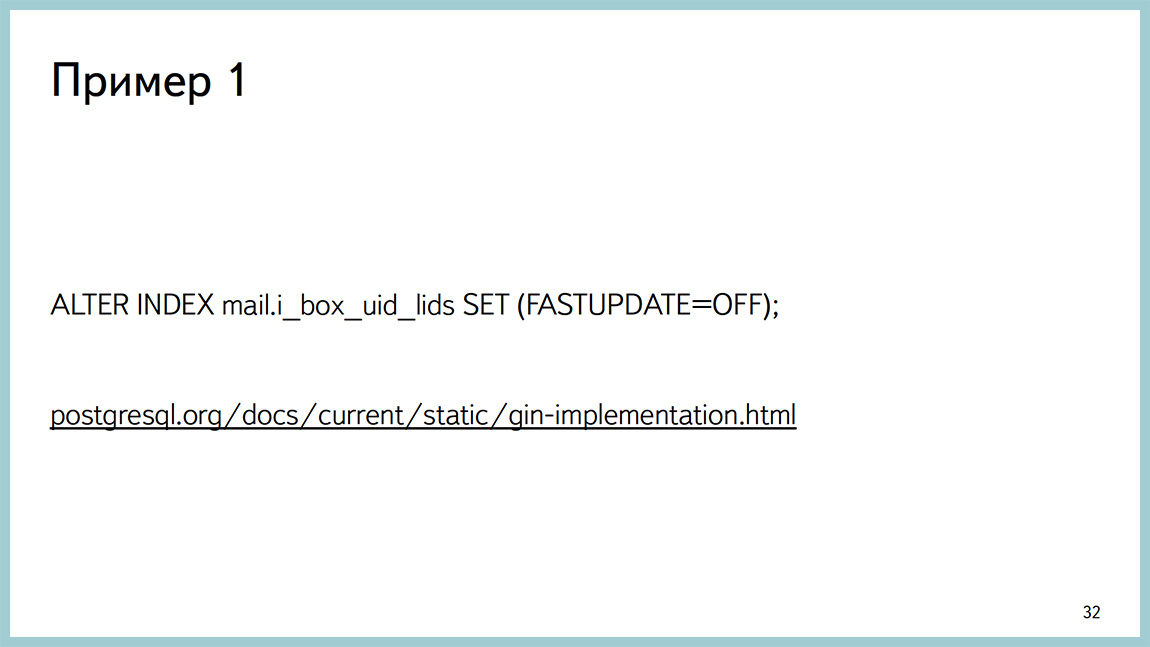
Further began to understand. It turned out that we did not read the documentation, as usual. At 9.4 a fastupdate for gin appeared. In most cases, it speeds up the insertion time, but at times it can lead to nondeterministic insertion time itself. For us, the stability of time is more important than the interval of this very time, conditionally speaking. We turned off fastupdate, everything became good. Therefore, the first recommendation is that before you write to some kind of newsletter, you should read the documentation. Most likely, you will find the answer there.

The second example. Again, during the shooting, we observed scans of bursts of responses to insane units of seconds. And they did not correlate in time with any avtovakums, nor with checkpoints, nor with any system processes.
From the side of the perf it looked like this. Compaction_alloc is at the top, and then nothing quite unusual. The classic picture of processor consumption.
In GDB, it looked like a shared memory problem, but again, in the buffer cache area. It is important, it began to climb out after the upgrade to 9.4. At 9.3 this was not. They started catching this because huge pages appeared in 9.4, and transparent hat pages are turned on by default in red hat-based operating systems and they are disgusting. Actually, we are not the first who have encountered this problem.
Here is a link to the “thread” with a discussion of this problem. Turned off transparent huge pages, everything began to fly. This is the second recommendation, the field of how reading the documentation did not help. Although in 95% of cases it will help. It makes sense to search the Internet, most likely, this problem besides you already someone faced.
The third example. The same problem when after some time after increasing the disk IO base all the time starts to spend in the system. The whole processor.
And in the perf output, it looks like a spinlock.
We took a certain number of backtraces and then analyzed them and found that almost everything around working with the buffer cache. Even the source is not necessary to go.
The classic recommendation in this case is to reduce shared buffers. Usually, those who start working with Postgres will cut off all available RAM under the shared buffers. As a rule, it ends badly. The classic recommendation is 25% of all memory , but not more than 8 GB. Actually reducing to 8 GB you will remove this problem. But we really wanted to cut off a lot under shared buffers, for some reason.
We went to the source and looked at where these lines occur. They saw that they were around locks on the buffer cache partition. At 9.5, the value 128 will be the default. At 9.4 still 16. We took and increased. This reduced the number of locks. In addition, there are a couple of patches in 9.5, which have already been discussed. This is an improved performance on many types of loads. The only thing that these patches, mainly about reading load. If you have a database in which there are a lot of readings, you can cut off almost all the memory under shared buffers and most likely you will not experience problems.
If you have a lot of records there, sooner or later you will still face this problem. On the wiki "postgresnoy" gather ideas how to improve this situation in the future. As a matter of fact, if suddenly reading the documentation and searching the Internet did not give you an answer to the solution to your problem, it makes sense to smoke the source code and, possibly, tweak one variable, and it will solve your problem. But it seems that this is quite rare.
Fourth example. Description of the problem is available here. The essence is approximately the following: a large table about a billion lines in size, a large B-tree index (200 GB in size). You say VACUUM on this tablet, and you have a rollback of changes on the replicas for 15 minutes. Speech about stream replication.
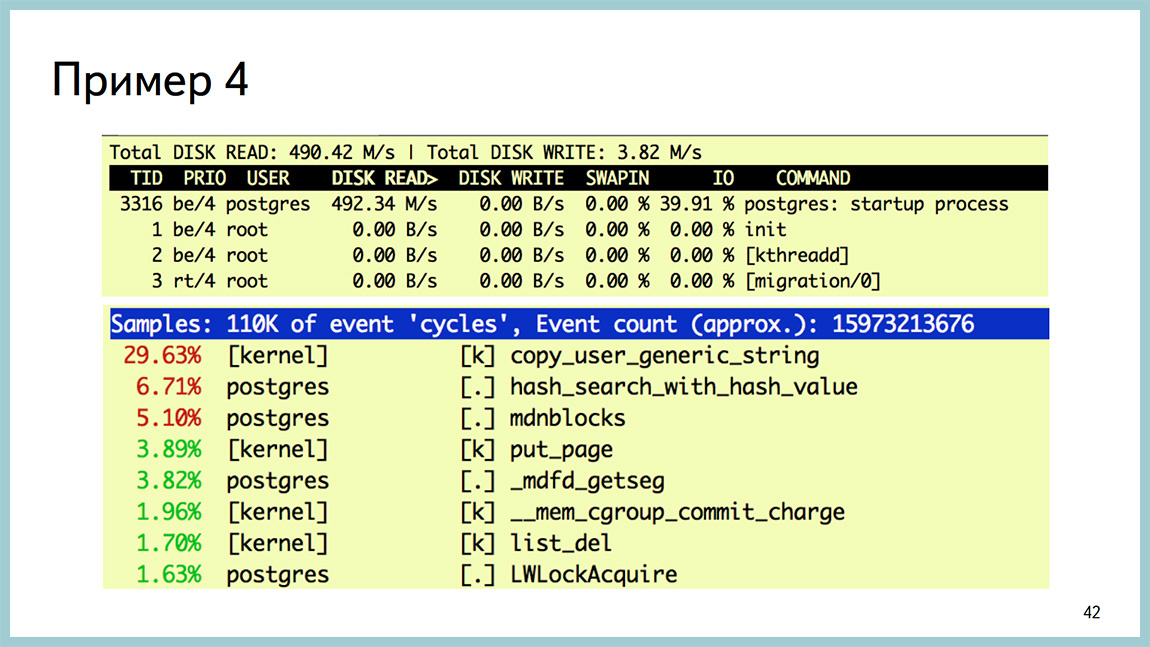
And while it is clear that the replicas begin to read a lot from the disk, from the partition where the data itself lies. It can be seen that the startup process is the one that rolls up xlog, and eats a lot of disk reading.

In this case it is useless to see the output of the top stamp, since we are all doing it in the IO, and not in the processor. In GDB, it can be seen that we really hang on reading from the disk. This is a libc's call. And up to the line of the code you can see where we are doing this. If you go to the source and see what happens there, it is written there right in non-Russian and white that what was done is not optimal. Can be improved.
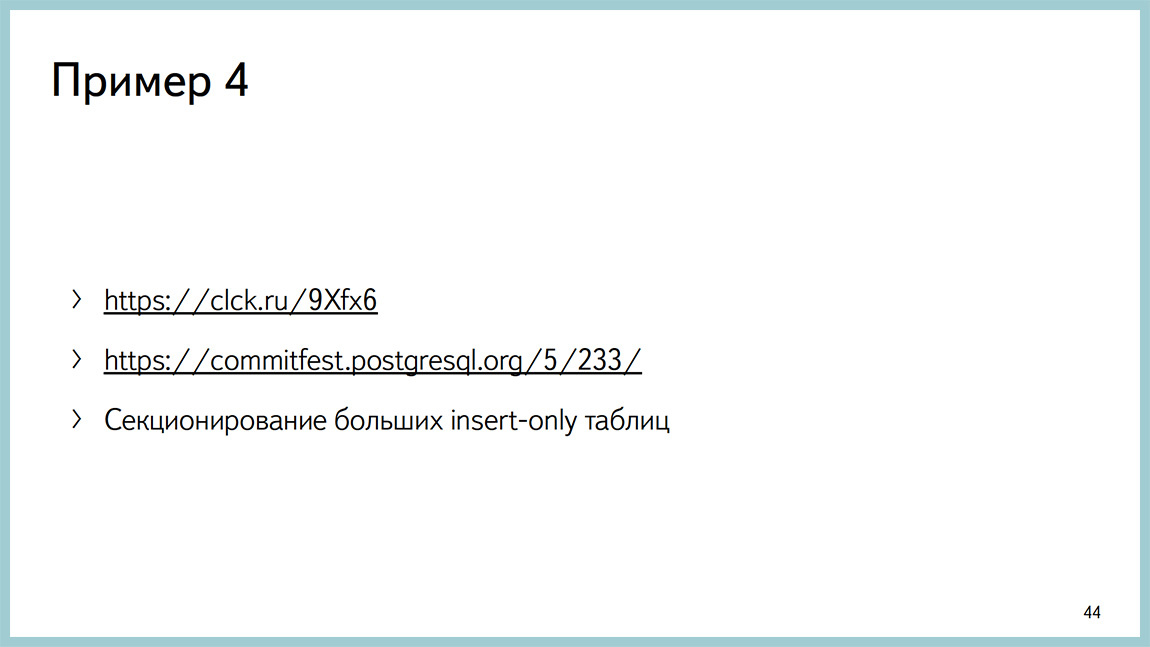
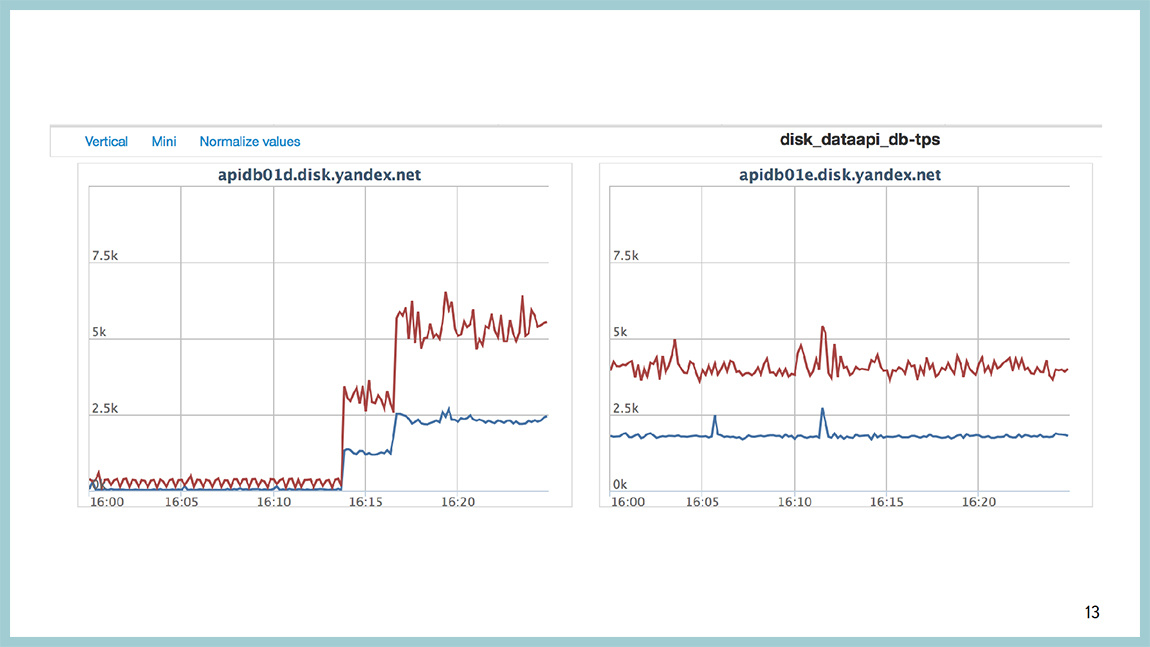
Link to the discussion of this problem, about how to solve it. All this ended with a patch to Postgres, which allows the replica lag to be reduced. Do not remove at all, and cut. Here in the picture just two replicas. The green one is a replica without a patch. The one that is blue is a replica with a patch. The graph shows the lag. And this is on the chart reading from the disk [approx. Ed .: right]. The reading volume does not increase. This I mean, if reading the documentation, searching the Internet and stupid contemplation of the source did not give you the answer to your question, then it would be good to correct them. But, if you do not know C, for example, I, then for this particular situation, when we have a large table, a large B-Tree index and you have few changes there, mainly insert-only load, it makes sense to partition it and you will not have such a problem.

By this point in time, you should have the following thought in your head: yes, they have been sticking out, GDB in battle, the Postgres source code will not be patched, not a normal DBA will be doing this. And this thought is correct. We thought so too. Therefore, I invite here Ildus, who will tell us about the bright future that awaits us.

Ildus Kurbangaliev : Hello everyone. My name is Ildus. I’m a Postgres Professional developer. At the moment I am doing monitoring. That is, I make a patch for monitoring, which will allow to monitor these expectations in Postgres. Waiting is exactly what Postgres rests on. These are, for example, a disk, a network, “latches”, lightweight “locks” that occur inside, or the heavy-weight loks themselves. These expectations are subdivided into many subtypes. Lightweight locks can be 50 pieces. Lokov 9 pieces. Network - can be read or write. Storage is the same.
Why do you need a separate monitoring tool? Often, the second point is actually the first. Because there are so many of them, and we must deal with each separately. It is desirable to have a tool that unites them. I had just such a task. For example, systemtap is a good tool, but it cannot be used in production.
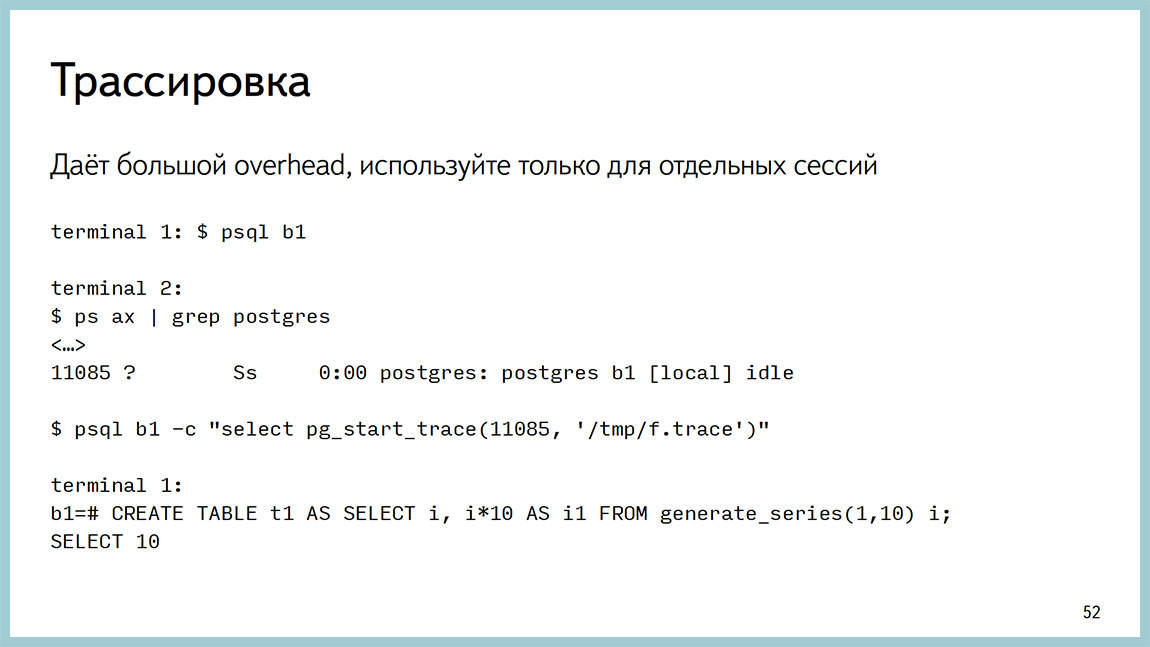
Therefore, I developed pg_stat_wait, which can do profiling, tracing to a file and waiting history. There is a special parameter, you can write and save them, then read them separately. Profiling reads the number and waiting time for each wait. For individual processes, you can enable tracing. There it turns out the PID of the process, the file name, and all the expectations for this process are written there. The minus tracing is that a large overhead is obtained and cannot be used online. I did the profiling so that it could be used in production.

Here I wrote the requirements that were set. That is, the patch should work online. Do not heavily load the database itself. According to all expectations, it is desirable to obtain accurate data. Namely, the time in milliseconds, the number and the main goal that we combine a bunch of tools into one. In the way it looks.
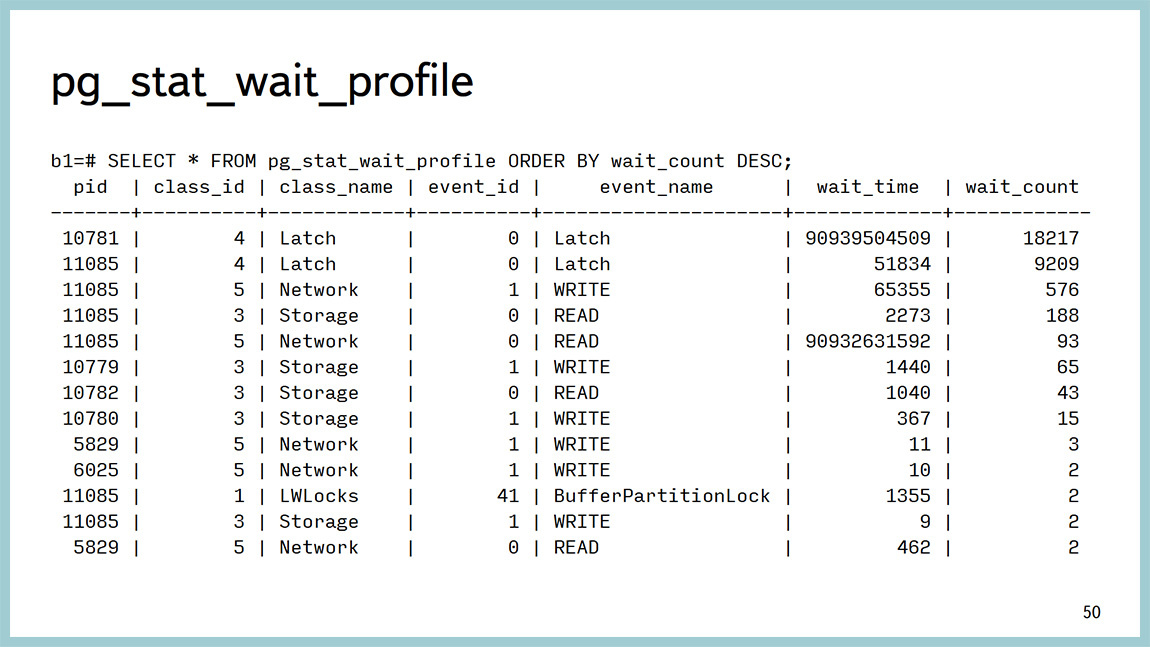
For the profiler, there is a feature that calls a separate function that just returns this data. That is, for each expectation, you can just see how long it took, the amount. You can, for example, make some beautiful graphics, you can make a reserve, request again and build a graph, where everything will be visible. Here you can see that the main amount of time here is just on the “latches” and is spent on working with the network. And here one LWLock hit.

The story looks that way. If the parameter is 5 thousand, we get the last 5 thousand expectations, they must also be quickly requested, because they are quickly erased. And we see just the parameters of each waiting. On storage, you can see which particular block is being written. And calculate the table itself, which we upload.
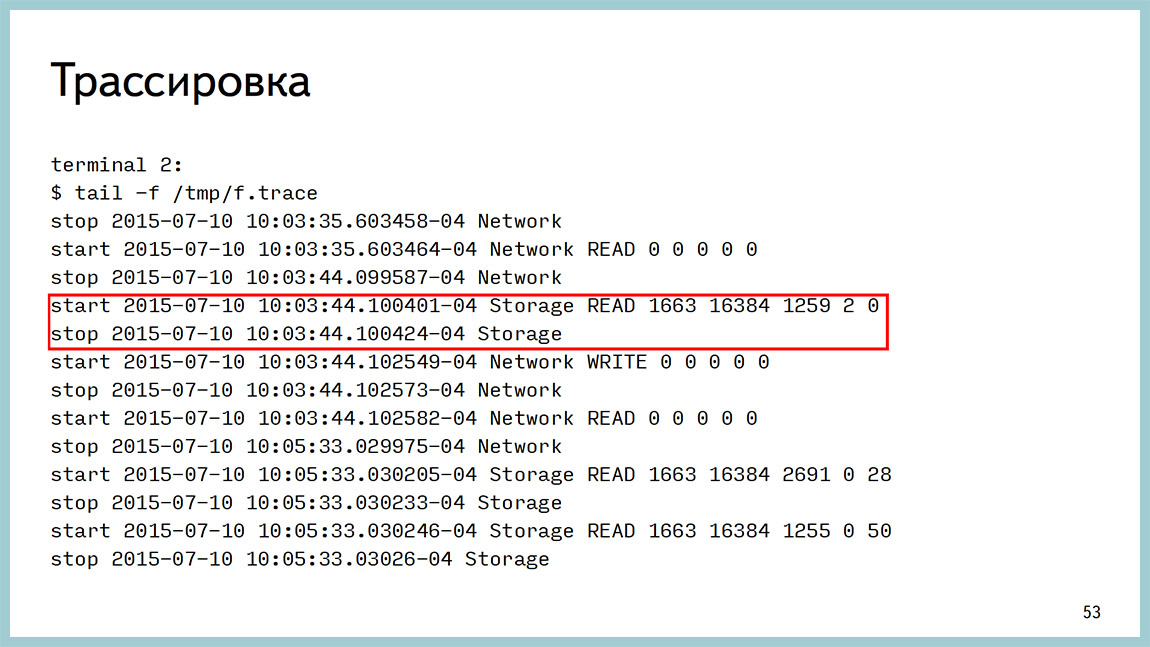
Here is the start of the trace: call the function ( pid, file ) and see this result. It says here when it was a start, and when it was all over, you can count the time and see where this record is being made.
A little bit about implementation. Initially, there was only one parameter in monitoring. These are the five types, and they were going to be sampled, and the profile was made on them. This turned out to be not very useful, because the sampling, firstly, puts a block on the process list. And, secondly, when the search goes, other processes can put locks, and they are skipped. Now done a little differently. That is, each backend collects an aggregation within itself and from time to time throws it into shared memoery. From there, just the profile and is given.
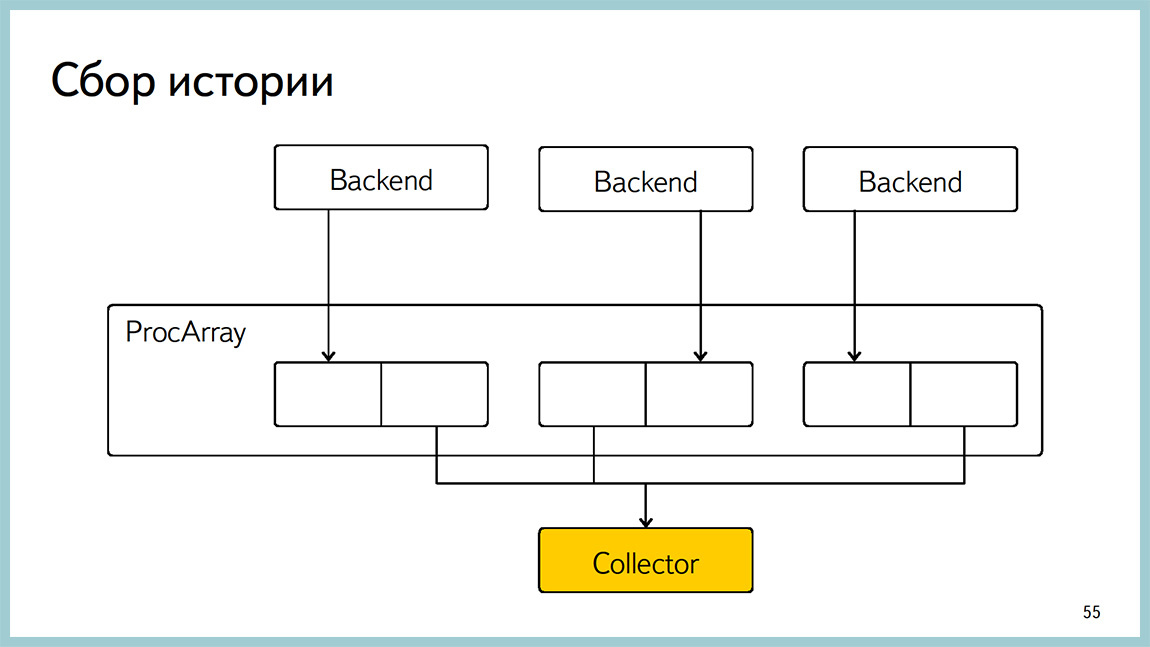
The story is collected by the yellow collector: it goes through ProcArray and records what is happening there now. There is a current viewseparate, which can be seen on what hangs a specific process at the moment. Everything is implemented on block free algorithms to try to avoid the overhead.
Here is an example of how this block free algorithm is made on history. We hold two blocks for each waiting. And when the backend writes to one, we read another. And thus avoid blocking.


And I did a lot of overhead measurement . These tests showed that our overhead projector is less than, in this case, 0.5%. But I’ll clarify that I tested it on SELECT queries, and therefore the result is pg_bench. There even with monitoring and without it is impossible to evaluate the overhead projector. And if someone comes up with how to do it, I will be very grateful. Because it is very difficult to get a stable result when writing.
Here the code is open in open source, gitgub has this project, you can create an issue there, if you are missing something, test it, check it in your database, and search for bugs too. It is very useful. There are two more links where you can see the correspondence on these issues, too, to participate there.

There are examples of using this monitoring. Vova will tell about it.
Vladimir Borodin: A little about examples. Ildus said that you can download, try, test, search for bugs. We downloaded, tried, searched, tested. We are already in production on all machines 9.4. The patch is for 9.4 and there is a patch for the current master, who is now jostling upstream .
How was it before? We have a base that does not seem to rest on anything, but doesn’t give out further. 20 thousand transactions per second and period. No longer possible. In GDB, we saw that it hangs with us right here: ProcArrayEndTransaction and getting a lightweight lock. Again, with the accuracy of a line of code, we could find out that it is hanging on a ProcArrayLock. This GDB can connect, catch on a particular backend and see it.
And now this is one SELECT query inpg_stat_wait_current or in pg_stat_wait_history , depending on whether you are watching the situation now or the history of what was once. And here it is clear that they all hang on ProcArrayLock and how much time they spent waiting for this very ProcArrayLock.
This can be visualized. This is a graph of how much time the base spends in each class waiting. Red is a disk, green is a lightweight lock, blue is a heavy-wait lock. The network and the “latches” are turned off here, because they usually take a lot of time. As long as your backend is hanging and doing nothing, it has a network wait class , there the wait time is very long. When a checkpoint hangs and does nothing, it has a latch waiting class.and the waiting time is infinite. Well, not infinitely, but very large. And here it is obvious that most of the time the base, when waiting for something, it waits for disk IO, but sometimes it hangs on light-weight lokas. On the Y axis - the time we are waiting, and on the X axis - the calendar time.
You can build the same schedule regarding what happens inside the light-weight lock. You will see that the most yellow color is here and the yellow color is BufferPartitionLock. Those same locks and buffer cache partitions, and not just like that, we increased them from 16 to 128. Not just like that, in 9.5 they were highly optimized.
For example, this is how the picture of waiting classes looks like at the moment when everything became bad in the database. It can be seen that they first exploded, and we hung on waiting for lightweight locks, and after some time we were locked at the level of the lines of the plates, on heavy-weight locks.

If you look at which light-weight of locks is to blame, then in theory, there should be ProcArrayLock and BuffFreelistLock. They hung on BuffFreelistLock 'e, and on ProcArrayLock ' there were a lot, because at the moment of time a large number of backends were created, new connections were opened, and this is the load on ProcArray .
The main source of the problem is BuffFreelistLock , which is no longer at 9.5, it was sawed in one of the optimizations.
It's time to sum up. It seems that this is a long-awaited feature that exists in many other databases and makes life much easier for DBA.

Next summer at PG Day'17, Yandex specialists are preparing for you several cool presentations. Vladimir Krasilshchik will talk with the audience about Big Data , Vasily Sozykin will tell the epic migration story on PostgreSQL to Yandex.Money , and Alexey Milovidov , lead developer of the popular analytic DBMS ClickHouse, will tell about the internal structure of his invention . Join now!
The introduction of Ilya Kosmodemyansky : now we will have a story about how to live, if you really want to have an Oracle, but it is not. In fact, this is a useful report, because one of the problems we now have is the problem of diagnostic tools. Diagnostic tools are sometimes lacking, sometimes instead of the usual diagnostic tools, you need to use rather complex tools, which are generally intended for Linux developers, and not for DBA. DBA teeth start to hurt when they look at these scripts. And now the guys from Yandex and PG Pro will talk about Postgres diagnostic methods that they use, how to use them, and tell you a little about how they are going to improve this world.
Vladimir Borodin : Hello everyone. My name is Vova, and I am admin Yandex mail. The report is joint with Ildus, he is developing PostgreSQL at Postgres Pro.
')
The Postgres Diagnostics Report and an important moment in it are pictures. The first part of the report is about what to do, what to do if you have failed monitoring.
Where to run in this case? Monitoring exploded - this is such an abstract thing, meaning that monitoring connected to the database exploded.
We think Postgres is a good database. A good database, when it is all bad, then it comes up against something, as a rule. In most cases, this is some kind of system resource. It lacks the processor. It lacks disks or even a network. She may well rest on heavy-weight locks, locks on the lines, signs, something else. But there are cases when the base rests on something else.
Some pictures from the same production. Here, for example, htop from one Postgres of base which rested against the processor. Load Average 200, a lot of sessions and a processor in userspace, it happens.
The base can also be rested against the disks. Posgres quite popular thing. Disposal on a pair of disks is close to 100%. await a huge amount of disk reads.
The disk can end not only according to iops or throughput, it can also end in place, unfortunately. This is a picture with a base where it ended on a section with xlog.
We have situations when the base rests on the network to transfer ixlogs to replicas, to the archive or elsewhere on “thick” responses to clients.
In the case of memory, everything is more complicated. As a rule, you will not see that you have a problem with memory. Depending on how your operating system is configured, or you will start to get into SWAP and see this as a problem with disk activity, or OOM will come, kill the backend, and as a result, the whole Postgres will be formed.
This is all well diagnosed by tools external to Postgres. That is favorite top-like utility, dstat, iostat, etc. I am talking mainly about Linux. If the base rests on heavyweight locks, this information is quite possible to look through PG locks, and there are some number of requests that facilitate the parsing of the output from there with your eyes. But they are compiled on the Postgres wiki. Actually, the example above shows everything beautifully.
The explosion occurred, you have rested against something. Because of what they rested, the devil knows. In most cases, something has changed, something rolled out, you have increased the load on the base, as in this picture, or the plan of some query went and it did not work as expected.
Before version 9.4, there was a good tool pg_stat_statements. You can look up to the query, which of them consumes the most time. That is, for which requests the base spends the most time. Well, after that it’s already standard, explain analyze to see where they spend their time, what they do and so on. But the time that the database spends on the execution of requests is not the best indicator. This time can be spent on a variety of resources. You can read from disk, you can "rape" the processor, you can sort something, you can expect some kind of blocking and so on.
Starting from 9.4, a great thing appeared, which is called pg_stat_kcache, which allows you to look up to the request, including CPU consumption in user time, CPU consumption in system time. And the very cool thing that she can do is to separate the physical reads from the disk and retrieve page cache data from the operating system.
A few examples. For example, a query that also accurately displays information on top queries. Again, sorted by time. But it also shows how much they ate the processor in system time, user time, how much they wrote / read from the disk, how many they got from memory, and so on. You can see the texts of these requests.
The request itself looks like this. This text can be copied. He really is not so complicated. It's simple. We take data from pg_stat_statements, pg_stat_kcache and sort it, in this particular case, also by the time it spent on this request.
But this is not the biggest advantage of pg_stat_kcache. You can sort by read from disk, write to disk, etc. For example, the same pg_stat_statements can split shared_hit and shared_read. This means reading from shared memory (shared buffers) and everything else. And all this can be from the page cache of the operating system, and can be physically from the disk. pg_stat_kcache can divide them. It does this with the help of the getrusage () system call, which is pulled after each request.
For example, we had a base that rested on a disk with readings, and we built such a thing: a request that sorts by physical reading from the disk. And these are already relative values. Here we see that we have requests that are in the top. They have a few percent to reach the disk and read something from the disk. Everything else is given either from shared memory or from the operating system cache. That is, caching in this database worked quite efficiently. If you are using 9.4, be sure to use pg_stat_kcache, great stuff.
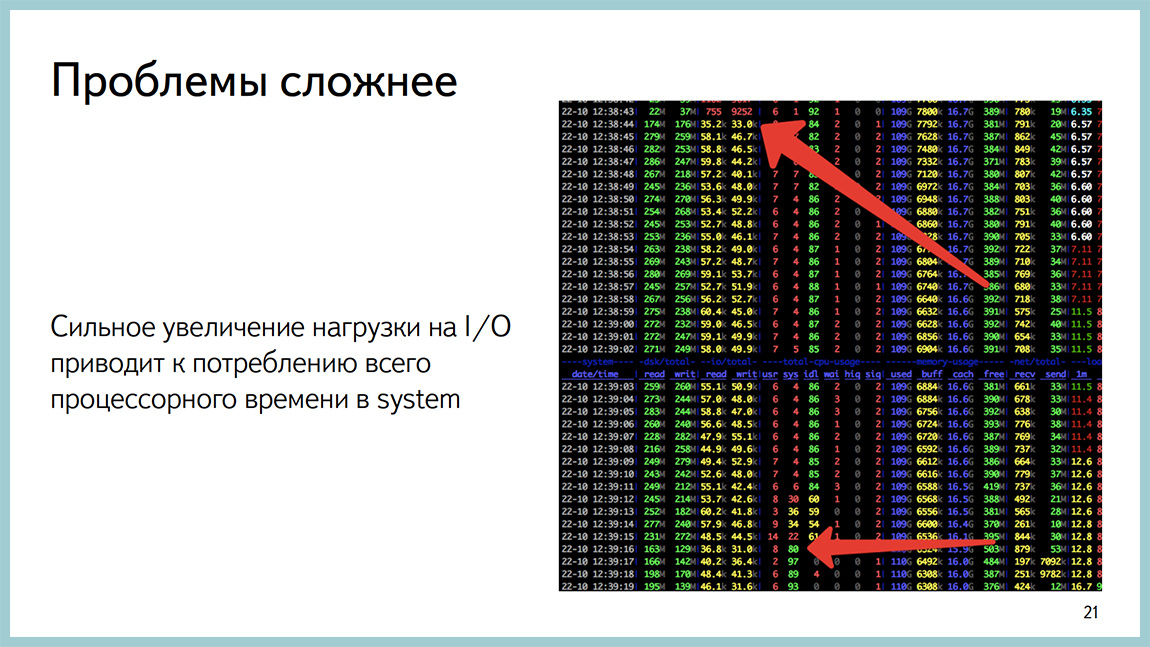
There are more complicated problems that are not determined at all by specific requests. For example, such a problem. We take and on the first arrow we increase disk IO. Description of the fields in the middle of the picture. These two columns are iops. We increase iops from 10 thousand to 100 thousand. And after some time, our base starts the whole processor to kill in the system time. At this point in time, everything becomes bad and in general it is not clear what it does. And if we look in pg_stat_statements or pg_stats_kcache, we will see that in systemtime, the system performs almost all requests. This is not a problem with any particular request.
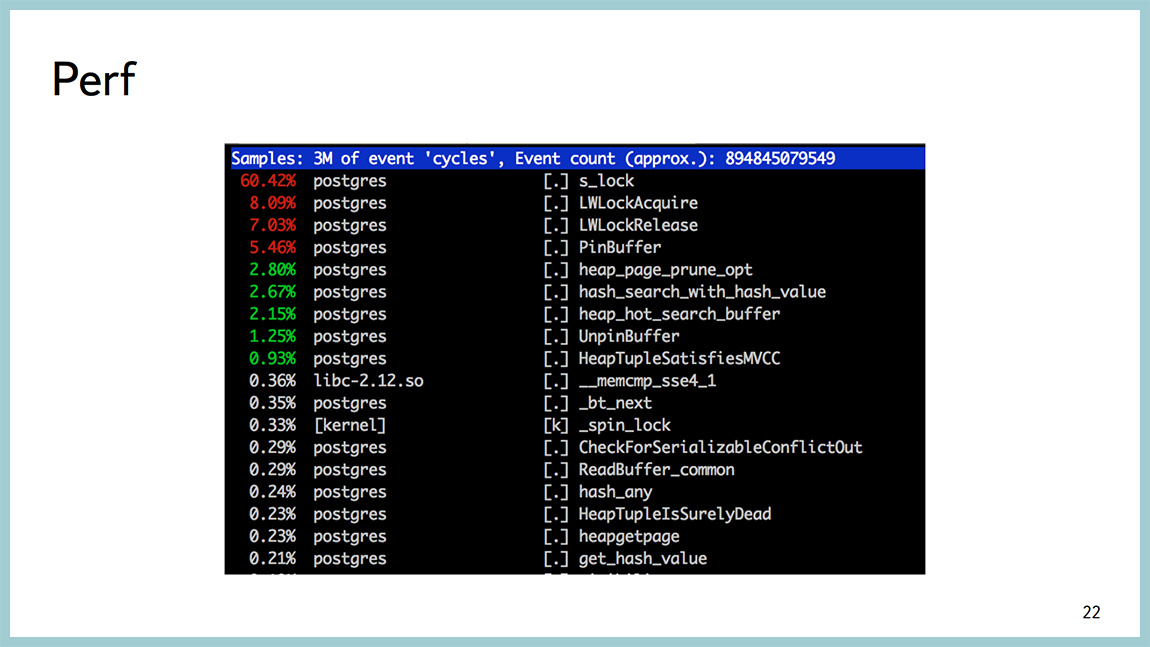
To diagnose what a processor is being spent on, there is a wonderful perf utility, it is useful not for DBA and more for kernel developers, but it works by sampling, it does not hurt the combat processes. Generally not "rape" the system. And here it is clear that most of the processor time is spent in the spinlock. At the same time, it can be seen that, most likely, we are spinning on getting lightweight locks. And, most likely, in the area of the buffer cache. Called PinBuffer, UnpinBuffer, ReadBuffer and so on. Looking at this perf top output, you can understand where the process is wasting in system time or assume where it is spent inside the database.
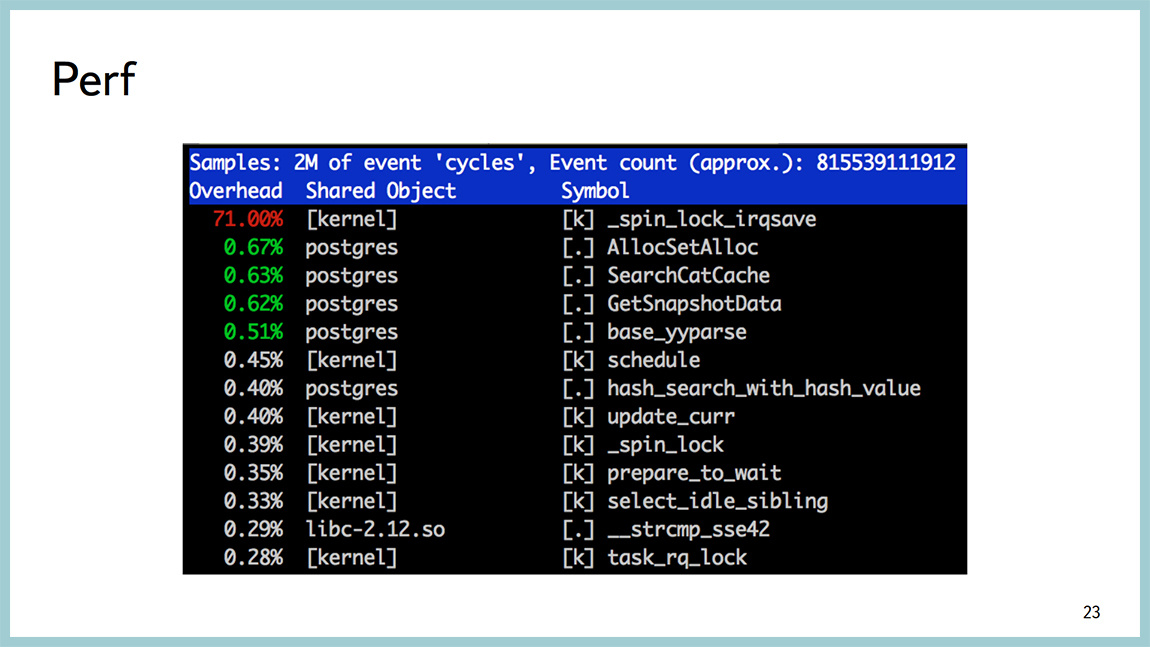
There are worse situations when we see the same spinlock, but at the same time there is nothing at all clear where this spinlock comes from and what to do next.
There should be a meme picture. We can climb deeper, to see what is happening there and what we rested.
There are a number of tools for this. One of them is dtrace and systemtap (in the case of Linux). Its advantage is that you can literally see everything. But for this you need to write some code. This is the first. Second, you need to rebuild Postgres so that the systemtap can climb into it. And the biggest problem is that the systemtap is not applicable under any conditions. It can be used on stands for load testing. Because it does not always work stably and can add up to “production”. We have this happened several times. As an advertisement, I wrote about the debugging of the situation with the help of systemtap in “blozhik”
Another tool is the classic GDB debugger, and we use it. Very simply, it clings to the process, removes backtracks from threads, in the case of Postgres - one process, one thread. Therefore, just remove the bektreys. And uncoupled from the processor.
The output is as follows. It shows that we hang on waiting for a lightweight weight (light-weight lock) in the area of work with the buffer cache and it is not easy somewhere there, but on a specific line of sources. We can go to the source code for the 591 line bufmgr.c and see what happens there. Even if you do not know C, there are quite good comments and you can understand where and what is happening.
The only thing that GDB has is an unpleasant drawback. If you cling to the process and tell ctrl + C , the process will not be reached by SIGTERM or SIGQUIT , but by SIGKILL , and Postgres will add it to you. Therefore, we wrote a very stupid binding. It simply does not send all those signals that you send to this strapping before GDB. Accordingly, it also does not reach to the back-end backends.
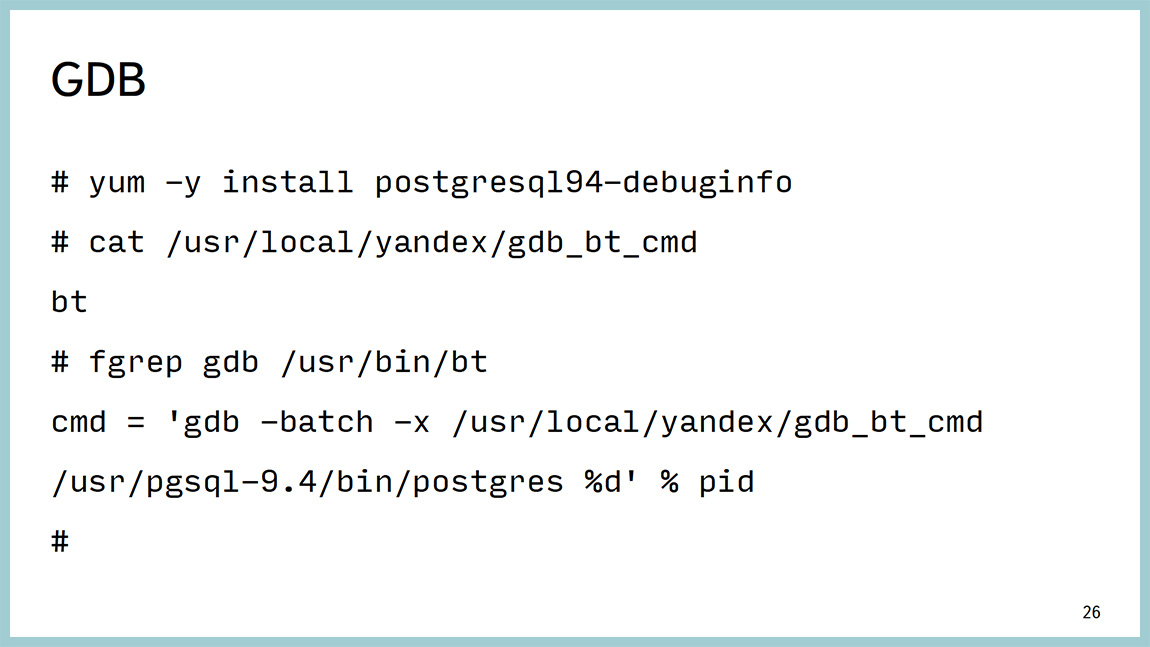
Patching allows us to remove spectra from the back end, and continue to stare at them with our eyes and understand what is happening there. One of the advantages is that it works stably and does not hurt the “fight”. In order for this to work, you do not need to rebuild anything. You just need to put the debuginfo packages: postgresql-debuginfo, libc-debuginfo, kernel-debuginfo, and you will be happy. It is important, it gives an accuracy to the line of code understanding where exactly backends spend time.
The second part of the presentation is devoted to what to do when you do not come up with some kind of performance problem, it is reproduced with confidence. You do not know how to treat it further. And you are prompted to write to the list and ask what to do. But before you write to the newsletter, you can collect more diagnostics.
A few examples. For example, we had this situation. We shot at the base, which rested against the processor. Here on the second picture you can see that the yellow one is a processor in userspace, it is all, almost, eaten. At the same time, at such a profile load, we had time intervals up to two minutes, when the base did not process the load at all. Everything was a stake. Bursts from the operating system was not visible.
At the conclusion of the perftop, too, nothing that would have struck the eye was not there either. The only thing we paid attention to at that point in time is that when this failure appears in the output, then there are calls to work with gin. Given that there is a very small amount of time spent on it. But as soon as failure, they appear. As soon as everything becomes good, they disappear. We had one gin-index in this database. First of all, we turned it off and turned off the request that this gin-index used, and saw that everything was fine.
Further began to understand. It turned out that we did not read the documentation, as usual. At 9.4 a fastupdate for gin appeared. In most cases, it speeds up the insertion time, but at times it can lead to nondeterministic insertion time itself. For us, the stability of time is more important than the interval of this very time, conditionally speaking. We turned off fastupdate, everything became good. Therefore, the first recommendation is that before you write to some kind of newsletter, you should read the documentation. Most likely, you will find the answer there.
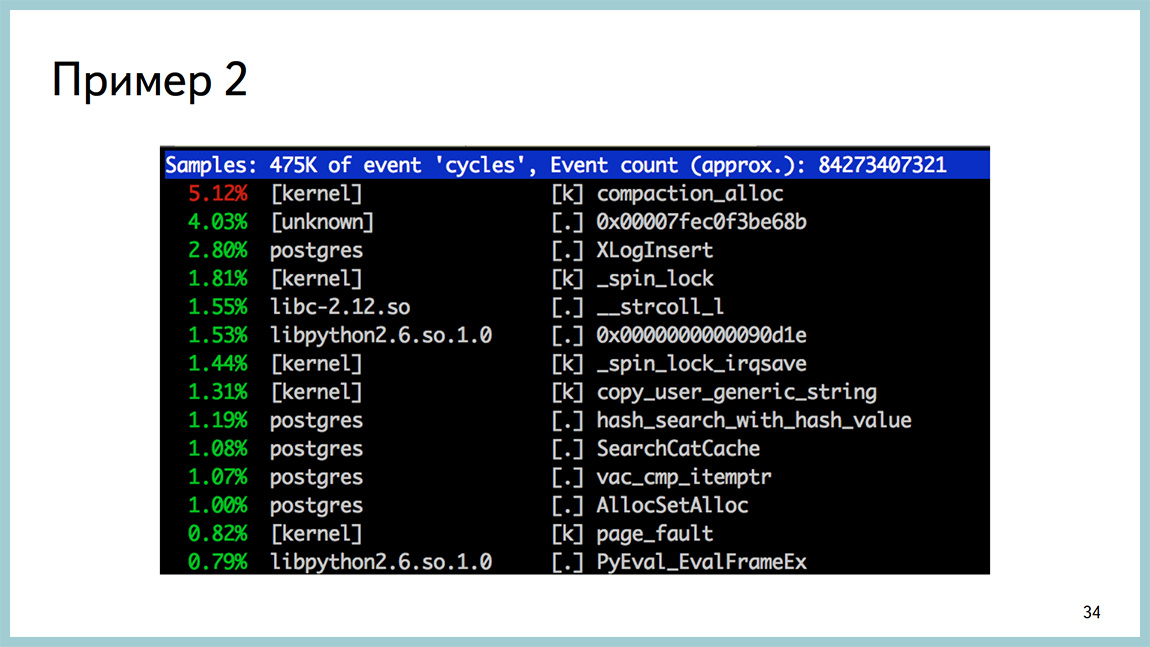
The second example. Again, during the shooting, we observed scans of bursts of responses to insane units of seconds. And they did not correlate in time with any avtovakums, nor with checkpoints, nor with any system processes.
From the side of the perf it looked like this. Compaction_alloc is at the top, and then nothing quite unusual. The classic picture of processor consumption.
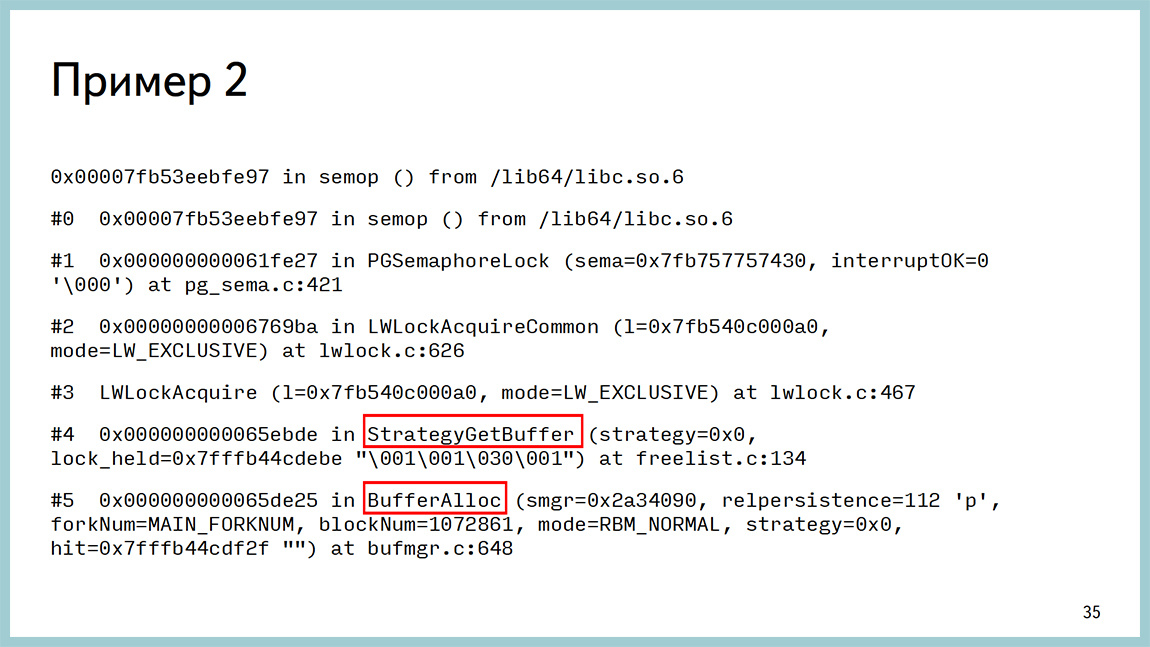
In GDB, it looked like a shared memory problem, but again, in the buffer cache area. It is important, it began to climb out after the upgrade to 9.4. At 9.3 this was not. They started catching this because huge pages appeared in 9.4, and transparent hat pages are turned on by default in red hat-based operating systems and they are disgusting. Actually, we are not the first who have encountered this problem.
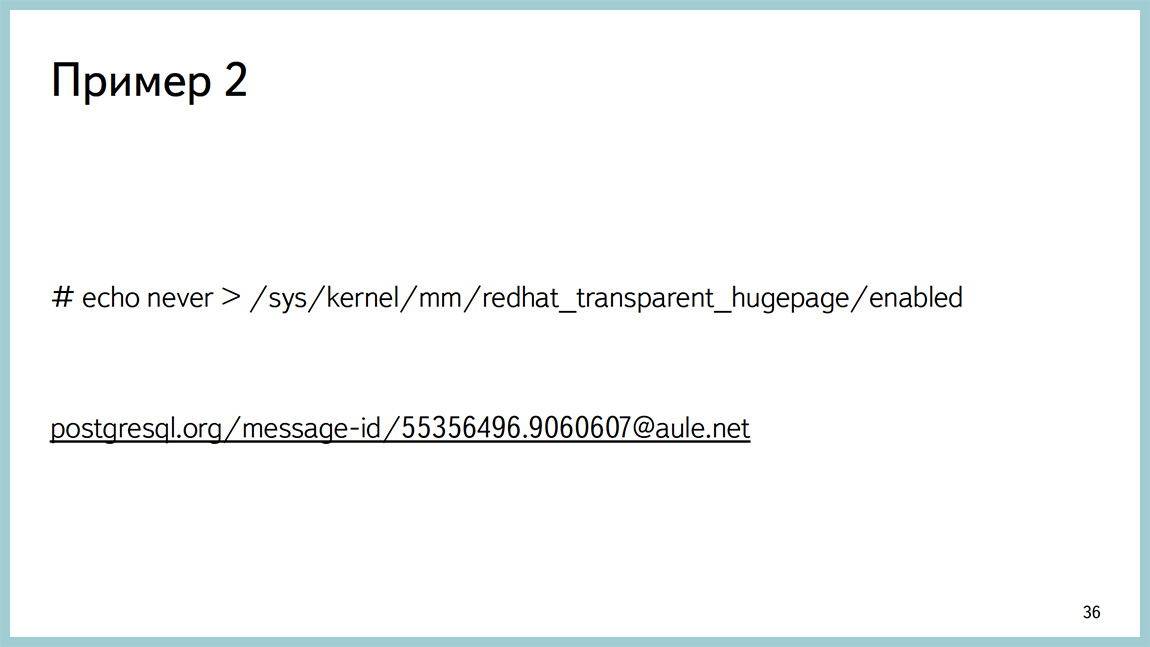
Here is a link to the “thread” with a discussion of this problem. Turned off transparent huge pages, everything began to fly. This is the second recommendation, the field of how reading the documentation did not help. Although in 95% of cases it will help. It makes sense to search the Internet, most likely, this problem besides you already someone faced.
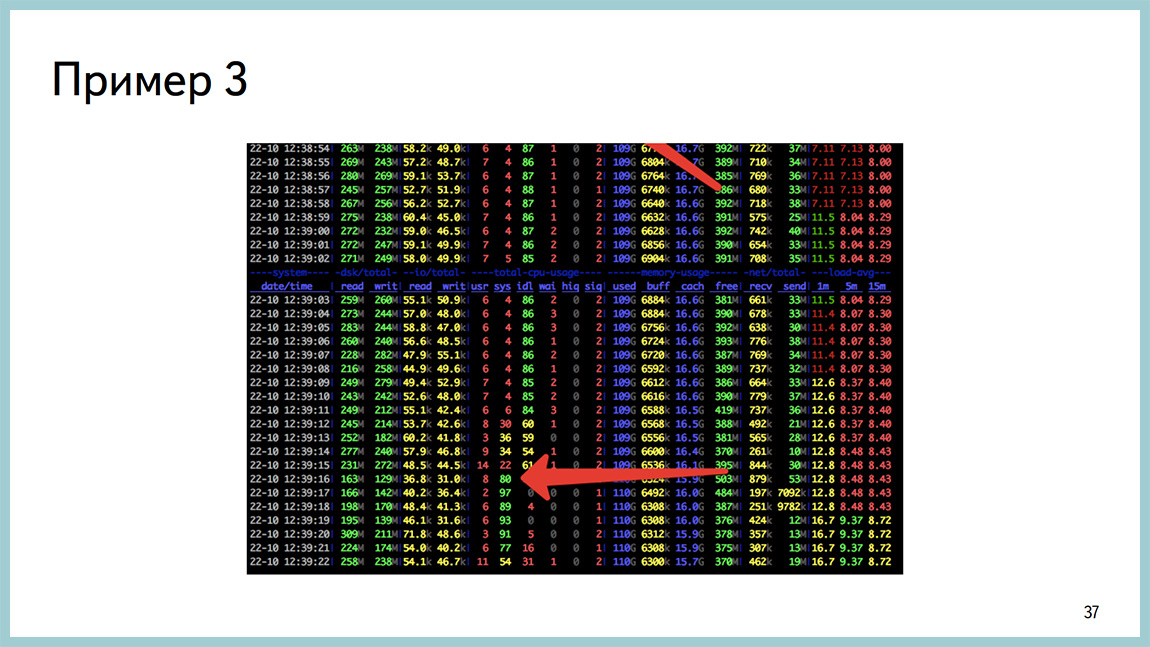
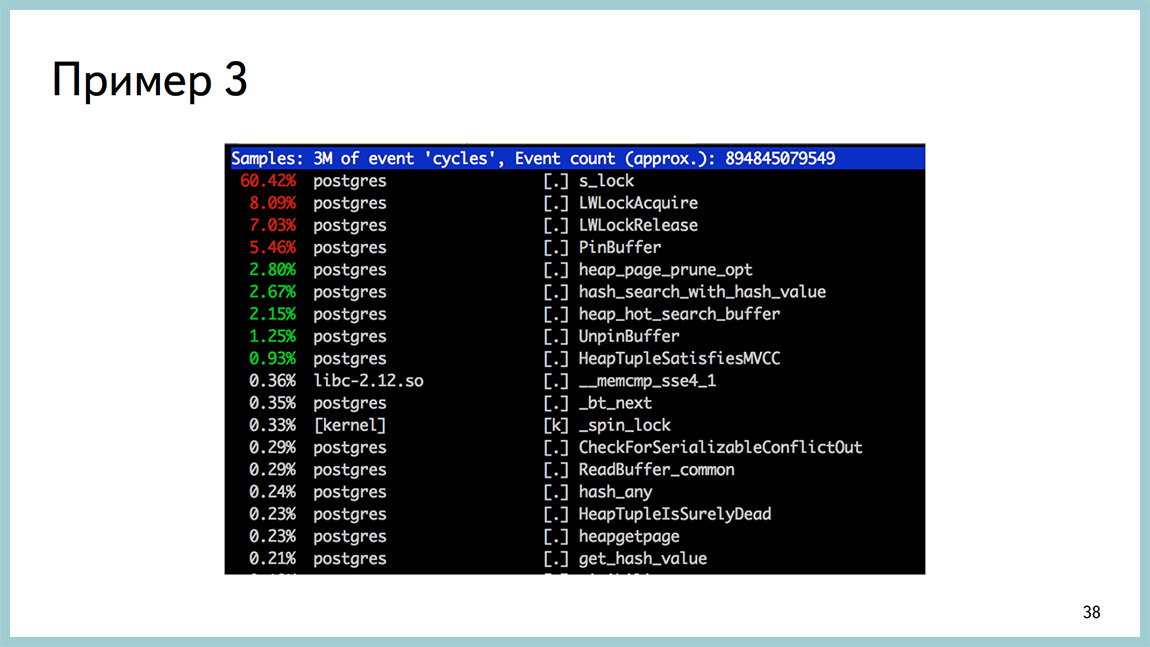
The third example. The same problem when after some time after increasing the disk IO base all the time starts to spend in the system. The whole processor.
And in the perf output, it looks like a spinlock.
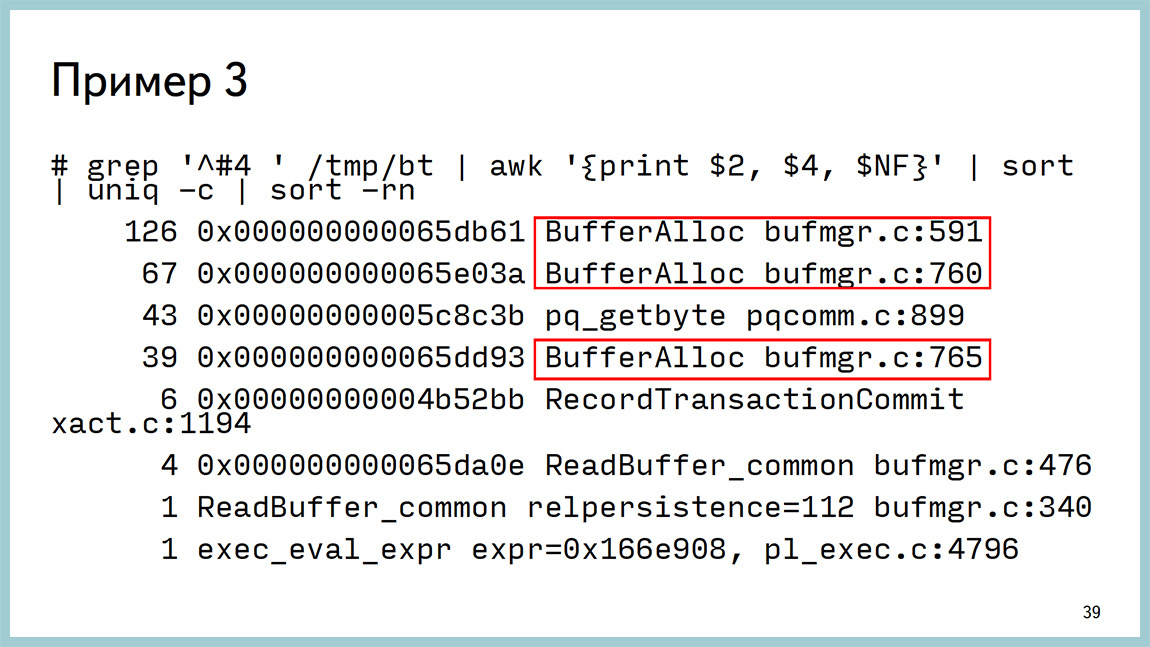
We took a certain number of backtraces and then analyzed them and found that almost everything around working with the buffer cache. Even the source is not necessary to go.
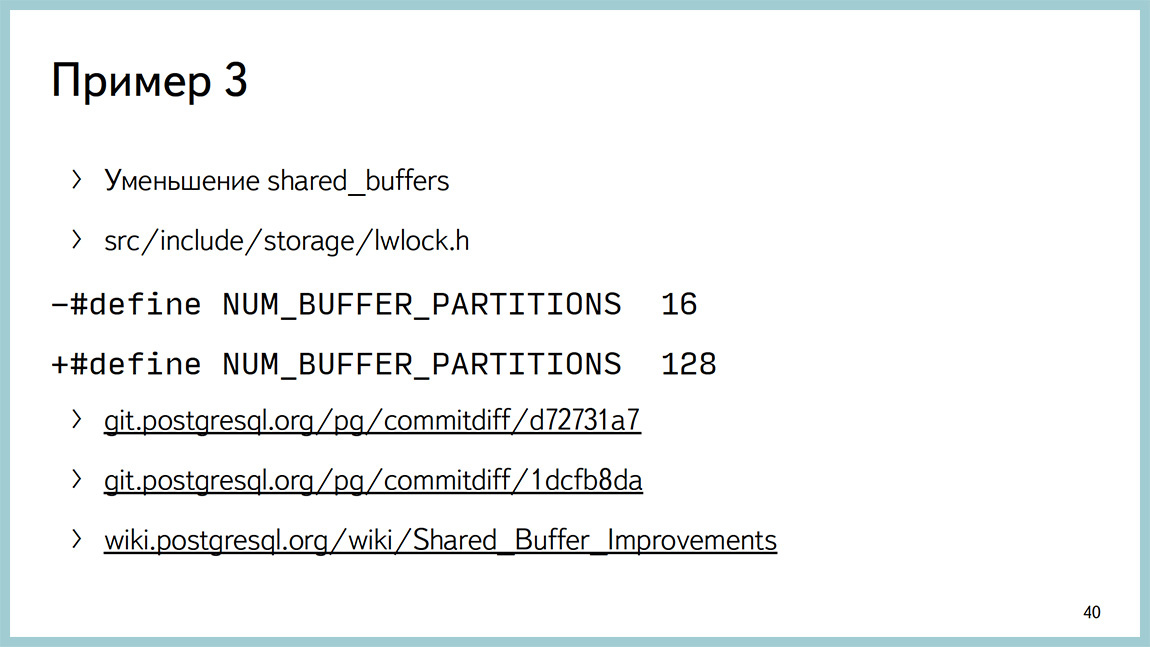
The classic recommendation in this case is to reduce shared buffers. Usually, those who start working with Postgres will cut off all available RAM under the shared buffers. As a rule, it ends badly. The classic recommendation is 25% of all memory , but not more than 8 GB. Actually reducing to 8 GB you will remove this problem. But we really wanted to cut off a lot under shared buffers, for some reason.
We went to the source and looked at where these lines occur. They saw that they were around locks on the buffer cache partition. At 9.5, the value 128 will be the default. At 9.4 still 16. We took and increased. This reduced the number of locks. In addition, there are a couple of patches in 9.5, which have already been discussed. This is an improved performance on many types of loads. The only thing that these patches, mainly about reading load. If you have a database in which there are a lot of readings, you can cut off almost all the memory under shared buffers and most likely you will not experience problems.
If you have a lot of records there, sooner or later you will still face this problem. On the wiki "postgresnoy" gather ideas how to improve this situation in the future. As a matter of fact, if suddenly reading the documentation and searching the Internet did not give you an answer to the solution to your problem, it makes sense to smoke the source code and, possibly, tweak one variable, and it will solve your problem. But it seems that this is quite rare.
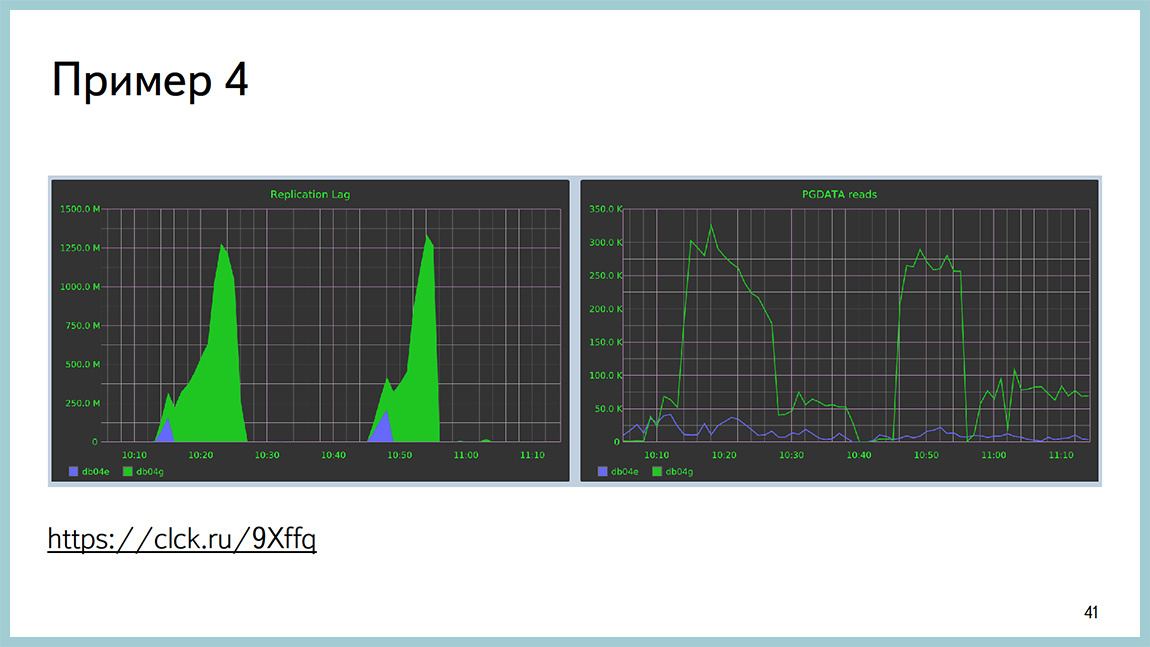
Fourth example. Description of the problem is available here. The essence is approximately the following: a large table about a billion lines in size, a large B-tree index (200 GB in size). You say VACUUM on this tablet, and you have a rollback of changes on the replicas for 15 minutes. Speech about stream replication.
And while it is clear that the replicas begin to read a lot from the disk, from the partition where the data itself lies. It can be seen that the startup process is the one that rolls up xlog, and eats a lot of disk reading.
In this case it is useless to see the output of the top stamp, since we are all doing it in the IO, and not in the processor. In GDB, it can be seen that we really hang on reading from the disk. This is a libc's call. And up to the line of the code you can see where we are doing this. If you go to the source and see what happens there, it is written there right in non-Russian and white that what was done is not optimal. Can be improved.
Link to the discussion of this problem, about how to solve it. All this ended with a patch to Postgres, which allows the replica lag to be reduced. Do not remove at all, and cut. Here in the picture just two replicas. The green one is a replica without a patch. The one that is blue is a replica with a patch. The graph shows the lag. And this is on the chart reading from the disk [approx. Ed .: right]. The reading volume does not increase. This I mean, if reading the documentation, searching the Internet and stupid contemplation of the source did not give you the answer to your question, then it would be good to correct them. But, if you do not know C, for example, I, then for this particular situation, when we have a large table, a large B-Tree index and you have few changes there, mainly insert-only load, it makes sense to partition it and you will not have such a problem.
By this point in time, you should have the following thought in your head: yes, they have been sticking out, GDB in battle, the Postgres source code will not be patched, not a normal DBA will be doing this. And this thought is correct. We thought so too. Therefore, I invite here Ildus, who will tell us about the bright future that awaits us.
Ildus Kurbangaliev : Hello everyone. My name is Ildus. I’m a Postgres Professional developer. At the moment I am doing monitoring. That is, I make a patch for monitoring, which will allow to monitor these expectations in Postgres. Waiting is exactly what Postgres rests on. These are, for example, a disk, a network, “latches”, lightweight “locks” that occur inside, or the heavy-weight loks themselves. These expectations are subdivided into many subtypes. Lightweight locks can be 50 pieces. Lokov 9 pieces. Network - can be read or write. Storage is the same.
Why do you need a separate monitoring tool? Often, the second point is actually the first. Because there are so many of them, and we must deal with each separately. It is desirable to have a tool that unites them. I had just such a task. For example, systemtap is a good tool, but it cannot be used in production.
Therefore, I developed pg_stat_wait, which can do profiling, tracing to a file and waiting history. There is a special parameter, you can write and save them, then read them separately. Profiling reads the number and waiting time for each wait. For individual processes, you can enable tracing. There it turns out the PID of the process, the file name, and all the expectations for this process are written there. The minus tracing is that a large overhead is obtained and cannot be used online. I did the profiling so that it could be used in production.
Here I wrote the requirements that were set. That is, the patch should work online. Do not heavily load the database itself. According to all expectations, it is desirable to obtain accurate data. Namely, the time in milliseconds, the number and the main goal that we combine a bunch of tools into one. In the way it looks.
For the profiler, there is a feature that calls a separate function that just returns this data. That is, for each expectation, you can just see how long it took, the amount. You can, for example, make some beautiful graphics, you can make a reserve, request again and build a graph, where everything will be visible. Here you can see that the main amount of time here is just on the “latches” and is spent on working with the network. And here one LWLock hit.
The story looks that way. If the parameter is 5 thousand, we get the last 5 thousand expectations, they must also be quickly requested, because they are quickly erased. And we see just the parameters of each waiting. On storage, you can see which particular block is being written. And calculate the table itself, which we upload.
Here is the start of the trace: call the function ( pid, file ) and see this result. It says here when it was a start, and when it was all over, you can count the time and see where this record is being made.
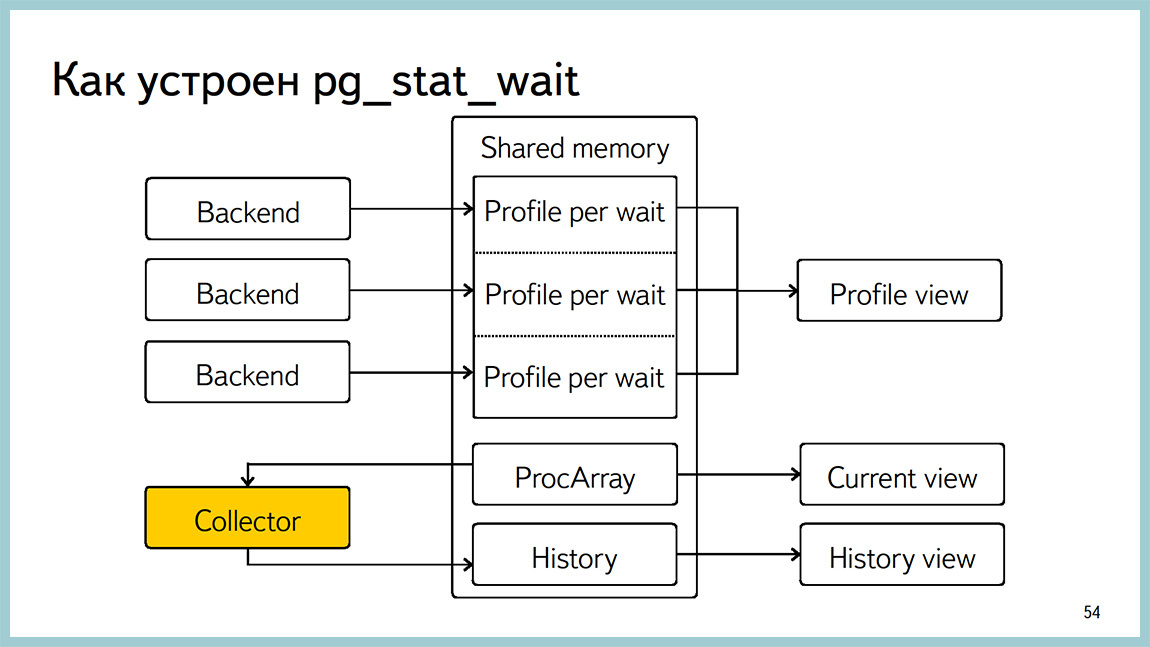
A little bit about implementation. Initially, there was only one parameter in monitoring. These are the five types, and they were going to be sampled, and the profile was made on them. This turned out to be not very useful, because the sampling, firstly, puts a block on the process list. And, secondly, when the search goes, other processes can put locks, and they are skipped. Now done a little differently. That is, each backend collects an aggregation within itself and from time to time throws it into shared memoery. From there, just the profile and is given.
The story is collected by the yellow collector: it goes through ProcArray and records what is happening there now. There is a current viewseparate, which can be seen on what hangs a specific process at the moment. Everything is implemented on block free algorithms to try to avoid the overhead.
Here is an example of how this block free algorithm is made on history. We hold two blocks for each waiting. And when the backend writes to one, we read another. And thus avoid blocking.
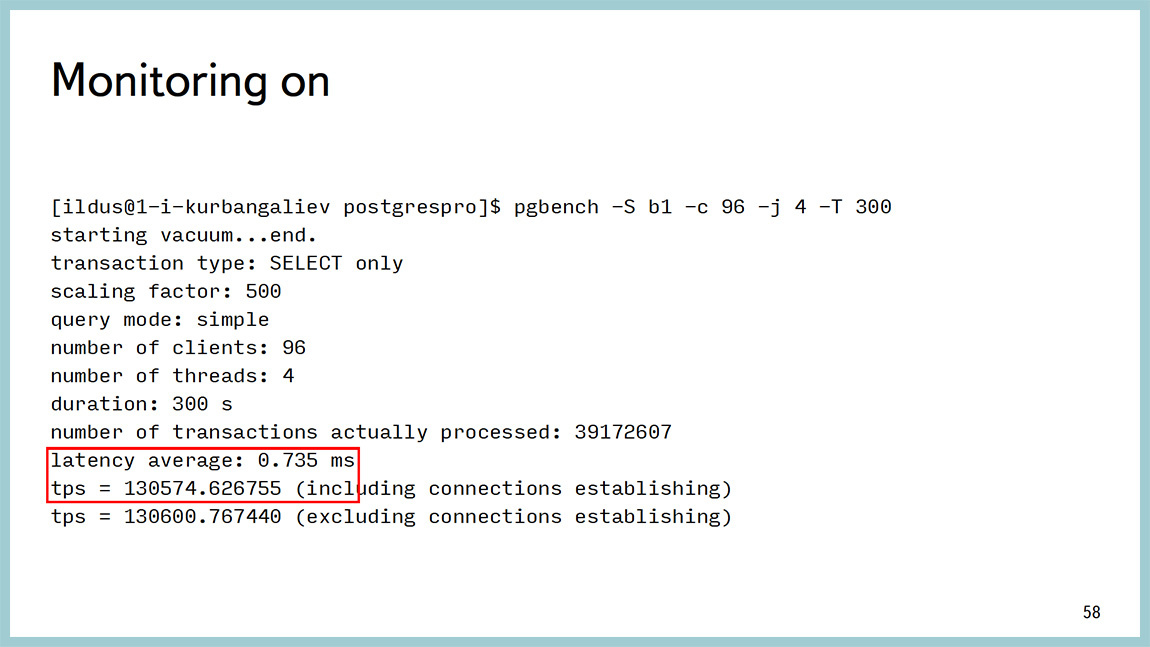
And I did a lot of overhead measurement . These tests showed that our overhead projector is less than, in this case, 0.5%. But I’ll clarify that I tested it on SELECT queries, and therefore the result is pg_bench. There even with monitoring and without it is impossible to evaluate the overhead projector. And if someone comes up with how to do it, I will be very grateful. Because it is very difficult to get a stable result when writing.
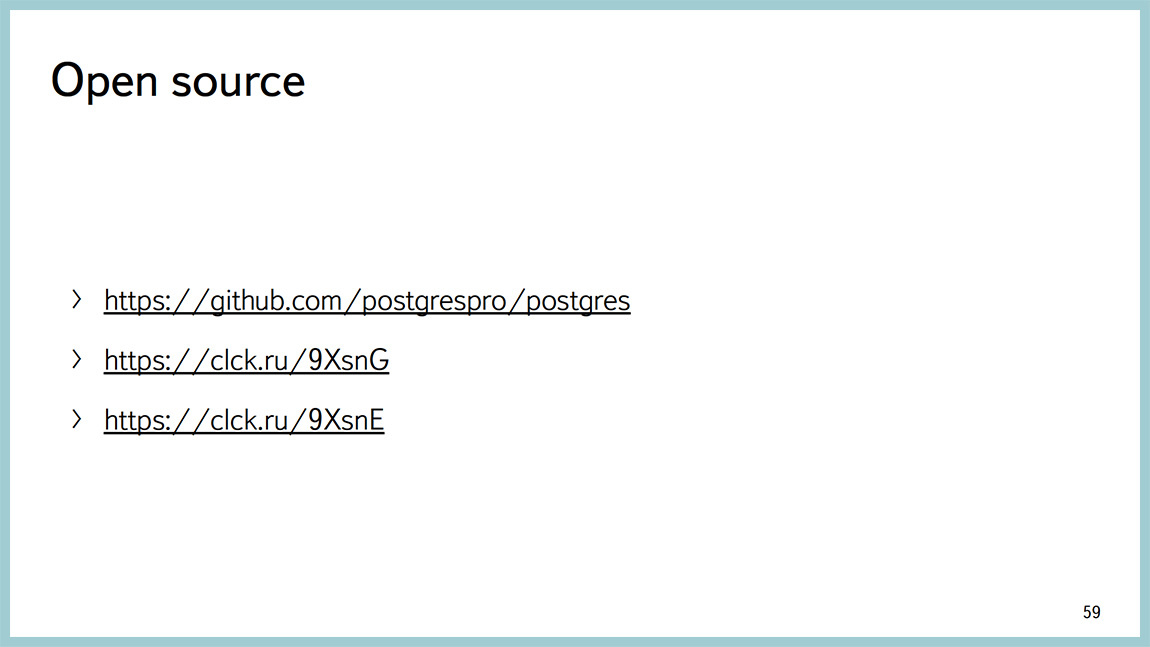
Here the code is open in open source, gitgub has this project, you can create an issue there, if you are missing something, test it, check it in your database, and search for bugs too. It is very useful. There are two more links where you can see the correspondence on these issues, too, to participate there.
There are examples of using this monitoring. Vova will tell about it.
Vladimir Borodin: A little about examples. Ildus said that you can download, try, test, search for bugs. We downloaded, tried, searched, tested. We are already in production on all machines 9.4. The patch is for 9.4 and there is a patch for the current master, who is now jostling upstream .
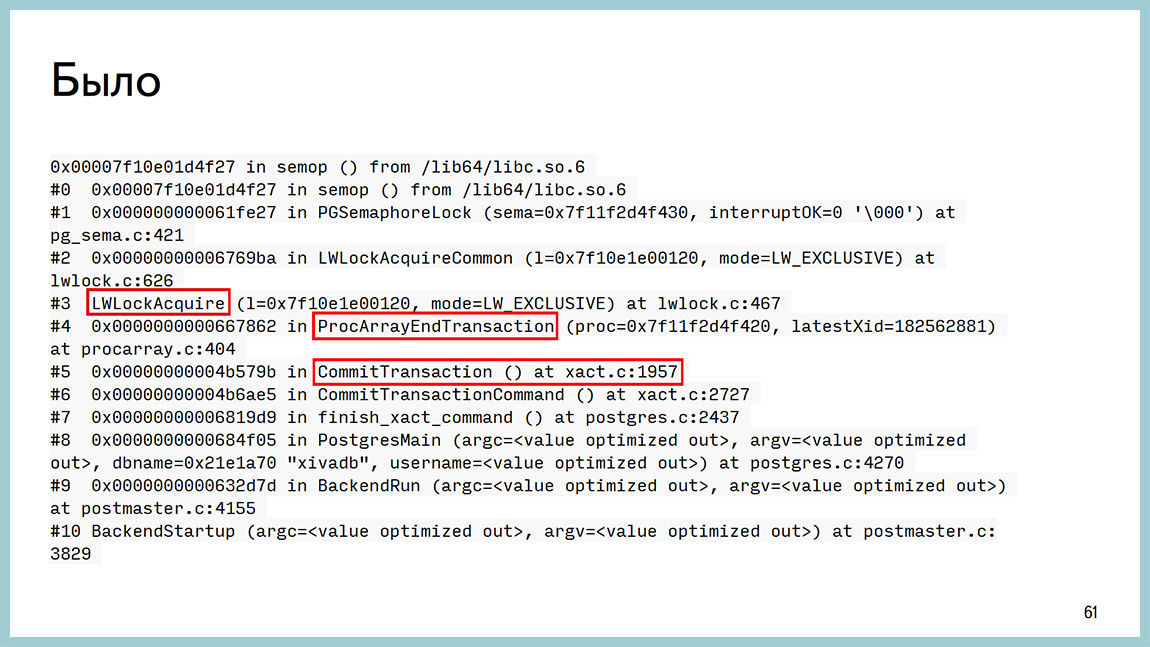
How was it before? We have a base that does not seem to rest on anything, but doesn’t give out further. 20 thousand transactions per second and period. No longer possible. In GDB, we saw that it hangs with us right here: ProcArrayEndTransaction and getting a lightweight lock. Again, with the accuracy of a line of code, we could find out that it is hanging on a ProcArrayLock. This GDB can connect, catch on a particular backend and see it.
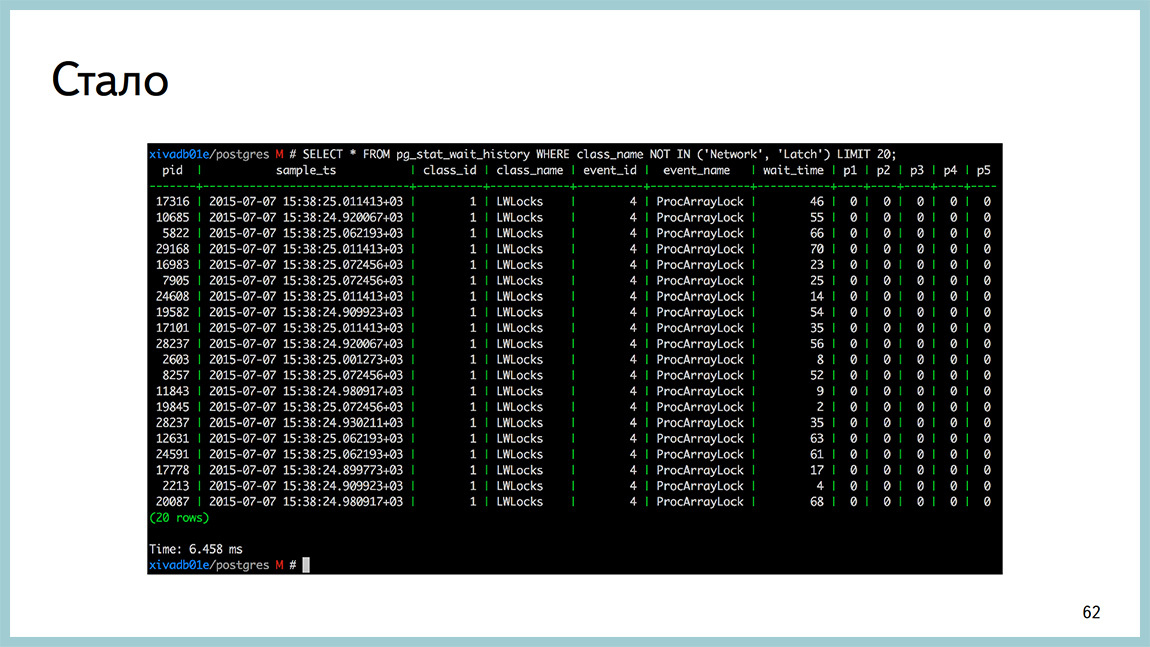
And now this is one SELECT query inpg_stat_wait_current or in pg_stat_wait_history , depending on whether you are watching the situation now or the history of what was once. And here it is clear that they all hang on ProcArrayLock and how much time they spent waiting for this very ProcArrayLock.
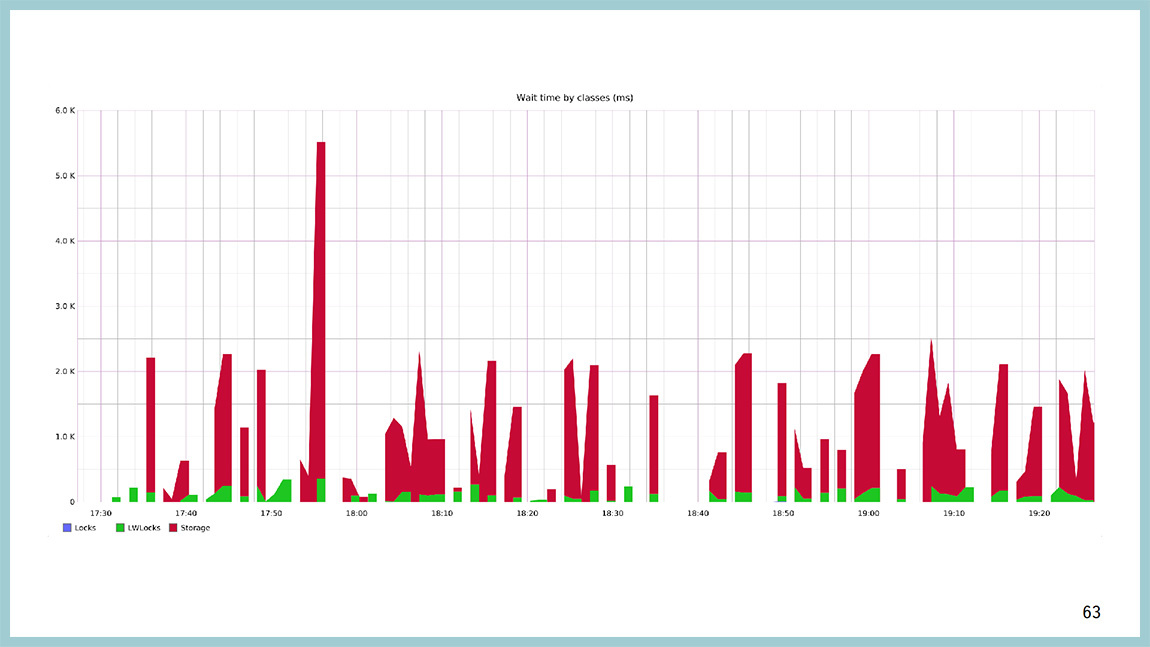
This can be visualized. This is a graph of how much time the base spends in each class waiting. Red is a disk, green is a lightweight lock, blue is a heavy-wait lock. The network and the “latches” are turned off here, because they usually take a lot of time. As long as your backend is hanging and doing nothing, it has a network wait class , there the wait time is very long. When a checkpoint hangs and does nothing, it has a latch waiting class.and the waiting time is infinite. Well, not infinitely, but very large. And here it is obvious that most of the time the base, when waiting for something, it waits for disk IO, but sometimes it hangs on light-weight lokas. On the Y axis - the time we are waiting, and on the X axis - the calendar time.
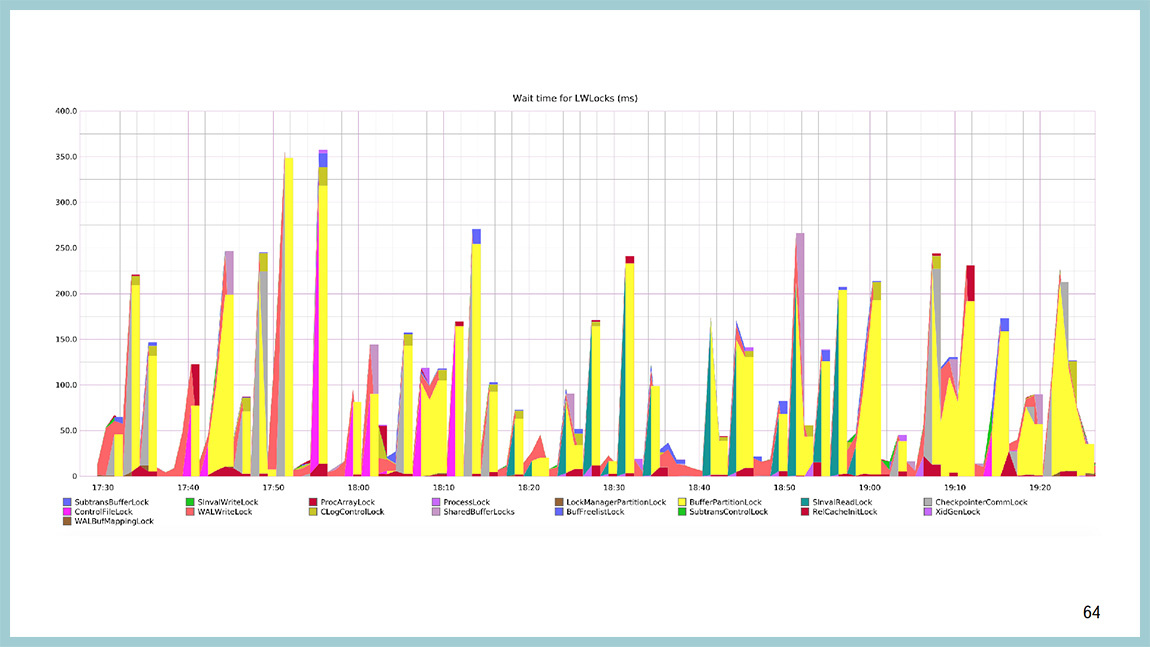
You can build the same schedule regarding what happens inside the light-weight lock. You will see that the most yellow color is here and the yellow color is BufferPartitionLock. Those same locks and buffer cache partitions, and not just like that, we increased them from 16 to 128. Not just like that, in 9.5 they were highly optimized.
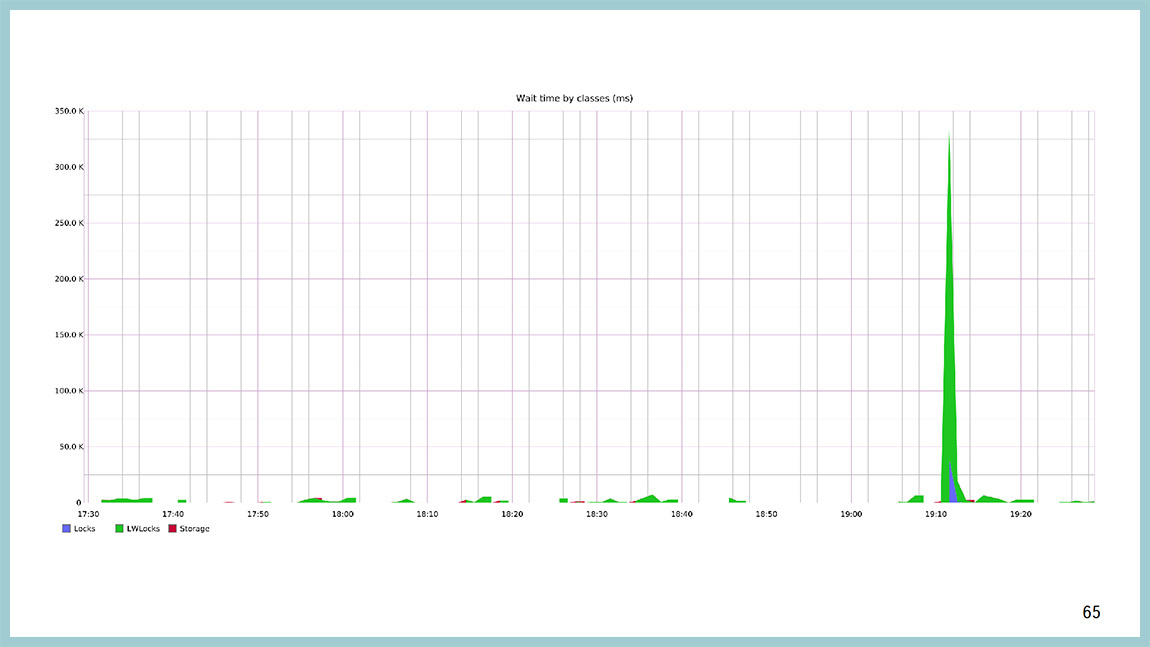
For example, this is how the picture of waiting classes looks like at the moment when everything became bad in the database. It can be seen that they first exploded, and we hung on waiting for lightweight locks, and after some time we were locked at the level of the lines of the plates, on heavy-weight locks.
If you look at which light-weight of locks is to blame, then in theory, there should be ProcArrayLock and BuffFreelistLock. They hung on BuffFreelistLock 'e, and on ProcArrayLock ' there were a lot, because at the moment of time a large number of backends were created, new connections were opened, and this is the load on ProcArray .
The main source of the problem is BuffFreelistLock , which is no longer at 9.5, it was sawed in one of the optimizations.
It's time to sum up. It seems that this is a long-awaited feature that exists in many other databases and makes life much easier for DBA.
Next summer at PG Day'17, Yandex specialists are preparing for you several cool presentations. Vladimir Krasilshchik will talk with the audience about Big Data , Vasily Sozykin will tell the epic migration story on PostgreSQL to Yandex.Money , and Alexey Milovidov , lead developer of the popular analytic DBMS ClickHouse, will tell about the internal structure of his invention . Join now!
Source: https://habr.com/ru/post/329178/
All Articles