Another logging system, now on ElasticSearch, Logstash, Kibana and Prometheus

All developers know the situation when the application has started and the user cannot do what he needs. The reasons are different: the user entered the wrong data, he has a slow Internet and much more. Without a logging system, disassembling these errors is difficult, and sometimes impossible. On the other hand, the logging system is a good indicator of problem areas in the system operation. I will tell you how to build a logging system in your project (yes, again). In the article I will talk about Elasticsearch + Logstash + Kibana and Prometheus and how to integrate them with my application.
2GIS is a web map and directory of organizations. The company may have additional content - photos, discounts, logo and so on. And so that business owners can conveniently manage this good, a Personal Account has been created. Using the Personal Account, you can:
- Add or edit organization contacts
- Upload photos, logo
- See what users do when they open an organization, and more.
Personal account consists of two projects: backend and front-end. The backend is written in PHP version 5.6, using the Yii 1 framework (yes, yes). Actively use omposer to manage dependencies in the project, autoloading of classes in accordance with PSR-4, namespace, trait. In the future we plan to update the version of PHP to the seven. We use Nginx as a web server, data is stored in MongoDB and PostgreSQL. The frontend is written in JavaScript, using our Catbee cooking framework . The backend provides an API for the frontend. Further in the report I will speak exclusively about the backend.
Here is the scheme of our integrations. It reminds us of the starry sky. If you look closely, you can see the Big Dipper:
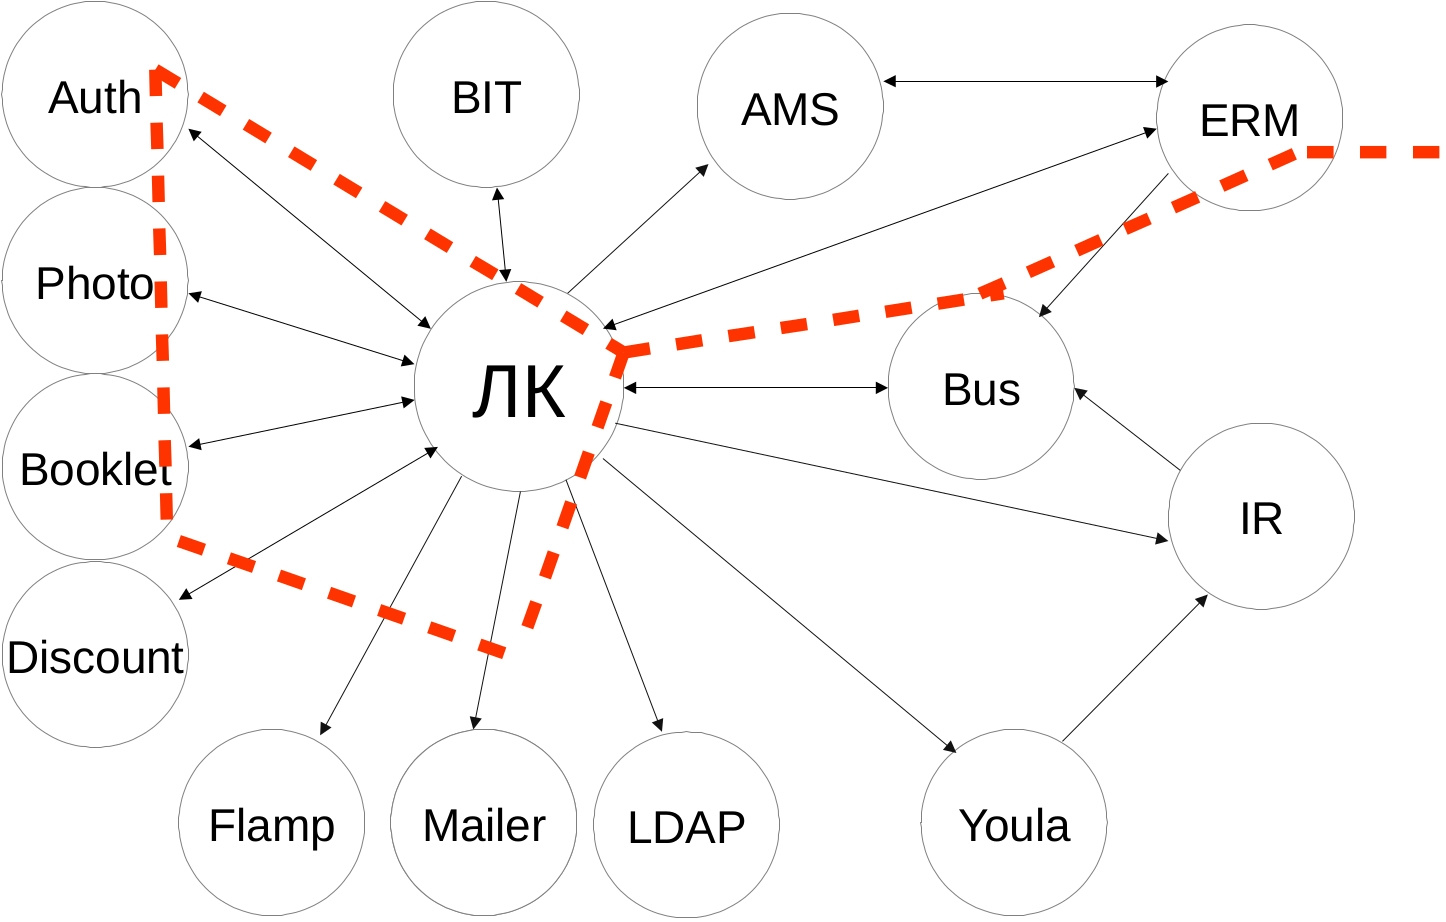
External services are heterogeneous - developed by a dozen teams, with their own stack of technologies and API. Integration scenarios are non-trivial - first we go to one service, we get data, we impose our business logic, we go to several more services with new data, we combine the answers and give the result to the frontend. And if the user has a problem and cannot fulfill the desired, for example, extend the advertising campaign, then without a logging system, we cannot understand where the problem was - either we send the data incorrectly to an external service, or we interpret the answer incorrectly, or the external service is not available, incorrectly impose your business logic.
We had error logging, but with the advent of new services, it became increasingly difficult to track integration and respond to technical support requests for an emerging problem. Therefore, we have developed new requirements for our logging system:
- Need more context about errors - what happened and which user.
- Collect incoming requests in a convenient form.
- If the methods take a long time to respond, you need to notify the team about it
Error logging
Historically, our company uses the Elasticsearch + Logstash + Kibana technology stack, ELK for short, to collect and view logs. Elasticsearch is a NoSQL document repository with full text search capability. Logstash is configured to receive logs using TCP / UDP protocols, reads messages from Redis and saves them to Elasticsearch. Kibana provides a visual interface to search and display collected data.
If the client has something wrong, then he contacts technical support from his account with a description of the problem. We had error logging, but there was no user email, no API method called, no call stack. In the messages there was only a line from the raw Exception of the form "The request returned an incorrect result". Because of this, we were looking for a problem according to the time of the client's request and keywords, which was not always accurate - the client could turn in a day, and it was very difficult to help.
Having tormented, we decided to do something and added the necessary information - the user's email, API-method, request body, call stack and our controller and action, which processed the request. As a result, we have simplified the life of technical support and ourselves - the guys give us the user's email, and we find records in the logs and deal with the problem. We know exactly which user had the problem, which method was called and how much of our code processed it. No comparisons on the time of treatment!
Error messages are sent while the application is running via UDP protocol in Graylog Extended Log Format, or GELF for short. The format is good because messages can be compressed by popular algorithms and divided into parts, thereby reducing the amount of traffic sent from our application to Logstash. Although the UDP protocol does not guarantee the delivery of messages, it imposes minimal overhead on the response time, so this option suits us. In the application we use the library gelf-php , which provides opportunities for sending logs in different formats and protocols. I recommend using it in your PHP applications.
Conclusion - if your application works with external users and you need to search for answers to emerging technical support questions, feel free to add information that will help identify the client and its actions.
An example of our message:
{ "user_email": "test@test.ru", "api_method": "orgs/124345/edit", "method_type": "POST", "payload": "{'name': ' '}", "controller": "branches/update", "message": "Undefined index: 'name' File: /var/www/protected/controllers/BranchesController.php Line: 50" } Request logging
Logging requests in a structured form and collecting statistics were absent, so it was not clear which methods are most often called and how much time they answer. This led to what we could not:
- estimate the allowed response time of the methods.
- the cause of the brakes - on our side or on the side of the external service (remember the scheme with a starry sky?)
- how can we optimize our code to reduce response time.
Within the framework of this task, we had to solve the following questions:
- selection of response parameters for logging
- send parameters to Logstash
We use the Nginx web server, and it can write access logs to a file. To solve the first problem, a new format for saving logs in the configuration was specified:
log_format main_logstash '{' '"time_local": "$time_local",' '"request_method": "$request_method",' '"request_uri": "$request_uri",' '"request_time": "$request_time",' '"upstream_response_time": "$upstream_response_time",' '"status": "$status",' '"request_id": "$request_id"' '}'; server { access_log /var/log/nginx/access.log main_logstash; } Most of the metrics, I think, do not cause any questions, I will tell you more about the most interesting one - $ request_id. This is a unique identifier, UUID version 4, which is generated by Nginx for each request. We are forwarding this header in the request to external services and can track the response of the request in the logs of other services. It is very convenient when searching for problems in other services - no comparisons of time, url of the method called.
To send logs to Logstash, use the Beaver utility. It is installed on all nodes of the application from which the logs are scheduled to be sent. The configuration specifies the file that will be parsed to receive new logs, the fields that will be sent with each message are indicated. Messages are sent to the Redis cluster, from which Logstash collects data. Here is our Beaver configuration:
[/var/log/nginx/access.log] type: nginx_accesslog add_field: team,lk,project,backend tags: nginx_json In the type and tags fields in Logstash, according to our values, filtering and processing of logs are done, you can have your own values. In addition, we add the team and project fields so that we can identify the team and the project that owns the logs.
Having learned to collect access logs, we moved on to defining SLA methods. SLA, the contract for the level of service, in our case, we guarantee that the 95th percentile of the response time of the methods will be no more than 0.4 seconds. If we do not fit into the allowable time, it means that in the application either one of the integrations slows down and we appeal to the associated team, or something is wrong in our code and optimization is necessary.
Conclusion on the collection of access-logs - we have defined the most frequently called methods and their allowable response time.
Here are examples of our reports on one of the measured methods. The first is equal to 50, 95, and 99 percentile response times and average response times:

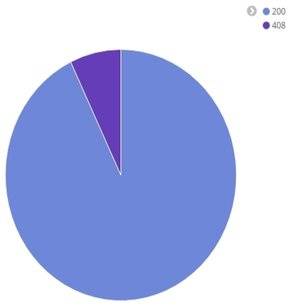
Answer Status Chart:
Average response time for a period of time:

SLA fall command alerts
After collecting the logs we got the idea that we need to quickly find out about the fall in speed. Keeping the browser open with Kibana all the time, pressing F5, comparing the current value of the 95th percentile with the allowable in mind was not very practical - there are many other interesting tasks in the project. Therefore, for the formation of alerts, we added integration with the Prometheus system. Prometheus is an open source system for collecting, storing and analyzing the metrics of a running application. Official website with documentation .
We liked the system because if the trigger is triggered, you can send an alert to the mail. The opportunity is provided out of the box, without problems with access to servers and without writing custom scripts to generate an alert. The system is written in Go, the creators are SoundCloud. There are libraries for collecting metrics in different languages - Go, PHP, Python, Lua, C #, Erlang, Haskell and others.
I will not tell you how to install and run Prometheus. If you are interested in this, I suggest reading the article . I will focus on those points that were of practical importance for us.
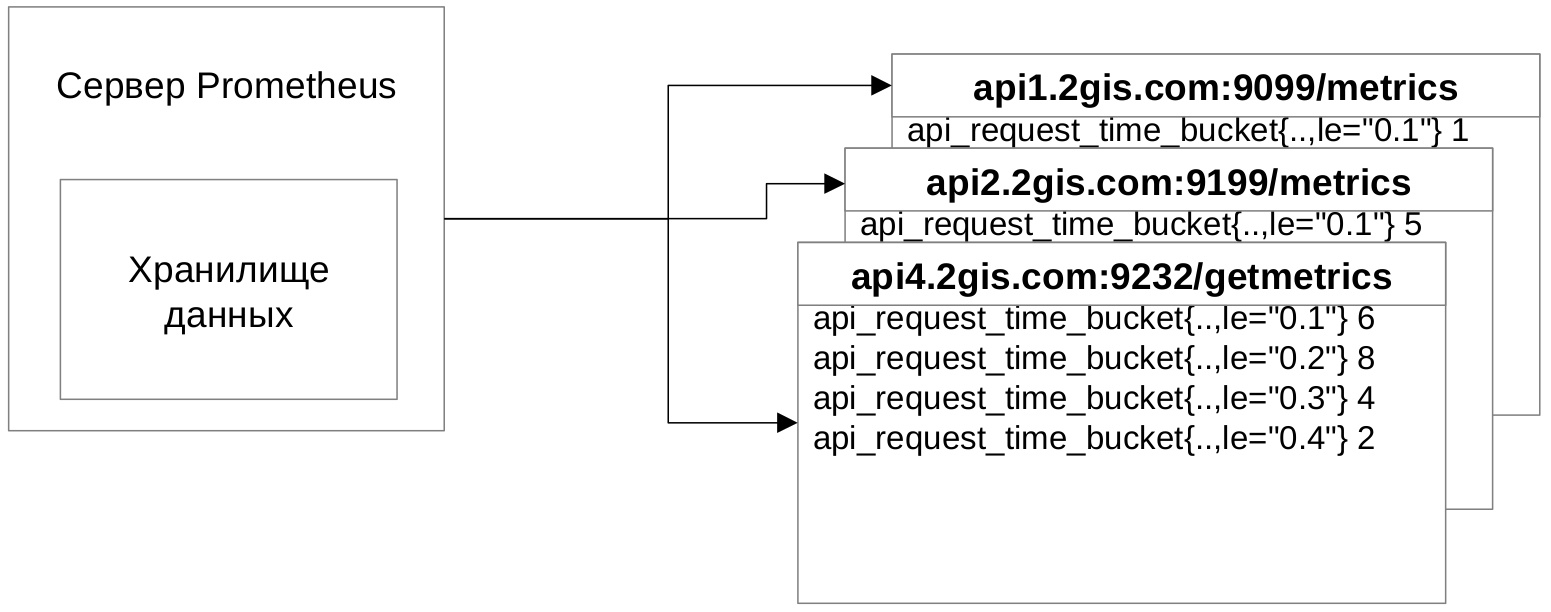
The integration scheme looks like this - the client application at the address gives a set of metrics, Prometheus comes to this address, collects and stores the metrics in its repository.
Let's see what the metrics look like.
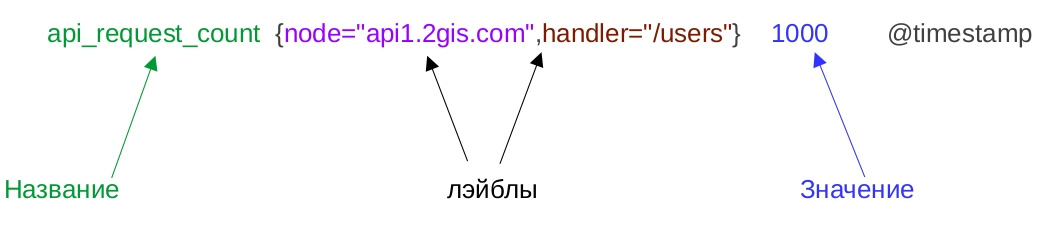
- The name is the identifier of the characteristic being studied. For example, the number of incoming requests.
- A metric has a specific value at a time. Time puts Prometheus when collecting metrics.
- A metric can have labels. They contain additional information about the collected number. In the example, the application node and the API method are specified. The main feature of labels is that you can search for them and make the necessary data sampling.
Time-value data storage is called Time Series Databases. This is a highly specialized NoSQL storage for storing time-varying indicators. For example, the number of users on the site at 10 am, per day, per week, and so on. Due to the nature of the tasks and storage method, such databases provide high performance and compact data storage.
Prometheus supports several types of metrics. Consider the first type, called the Counter. Counter value at new measurements always grows upwards. Ideal for measuring the total number of incoming requests for the entire history - there can not be such that today there were 100 total requests, and tomorrow the number decreased to 80.
But what about the response time measurement? It does not necessarily grow up, moreover, it can fall down, be for some time on the same level, and then grow up. A change can occur in less than 10 seconds, and we want to see the dynamics of change in response time for each request. Fortunately, there is a type of histogram. For the formation, it is necessary to determine the response time measurement interval. In the example, we take from 0.1 to 0.5 seconds, all that more we will consider as Infinity.
Here is the initial state of the Histogram:
api_request_time_bucket{node="api1.2gis.com",handler="/users",le="0.1"} 0 api_request_time_bucket{node="api1.2gis.com",handler="/users",le="0.2"} 0 api_request_time_bucket{node="api1.2gis.com",handler="/users",le="0.3"} 0 api_request_time_bucket{node="api1.2gis.com",handler="/users",le="0.4"} 0 api_request_time_bucket{node="api1.2gis.com",handler="/users",le="0.5"} 0 api_request_time_bucket{node="api1.2gis.com",handler="/users",le="+Inf"} 0 api_request_time_sum{node="api1.2gis.com",handler="/users"} 0 api_request_time_count{node="api1.2gis.com",handler="/users"} 0 For each value in the interval, we create a Counter according to certain rules:
- The title must have postfix _bucket
- There must be a label le, which indicates the value of the interval. Plus there should be a Counter with a value of + Inf.
- Must be Counters with the _sum and _count postfixes. They store the total total time of all responses and the number of requests. Needed for convenient calculation of the 95th percentile with Prometheus.
Let's see how to properly fill in the Histogram with the response time. To do this, you need to find a series in which the value of the le label is greater than or equal to the response time, and increase them by one. Suppose that our method responded in 0.4 seconds. We find those Counters whose le label is greater than or equal to 0.4, and add one to the value:
api_request_time_bucket{node="api1.2gis.com",handler="/users",le="0.1"} 0 api_request_time_bucket{node="api1.2gis.com",handler="/users",le="0.2"} 0 api_request_time_bucket{node="api1.2gis.com",handler="/users",le="0.3"} 0 api_request_time_bucket{node="api1.2gis.com",handler="/users",le="0.4"} 1 api_request_time_bucket{node="api1.2gis.com",handler="/users",le="0.5"} 1 api_request_time_bucket{node="api1.2gis.com",handler="/users",le="+Inf"} 1 api_request_time_sum{node="api1.2gis.com",handler="/users"} 0.4 api_request_time_count{node="api1.2gis.com",handler="/users"} 1 
If the method is responsible for 0.1 second, then we increase all series. If it answers for 0.6 seconds, then we increase only the counter with the value "+ Inf". Do not forget to increase the counters api_request_time_sum and api_request_time_count. Using the Histogram, you can measure the response time, which in a short period can often change.
Prometheus supports two more types of metrics — Scale and Results Summary. The scale describes the characteristic, the value of which can either increase or decrease. We do not use them in tasks, since such indicators are not measured here. The results summary is an extended Bar Graph that stores quantiles calculated on the application side. Theoretically, it would be possible to calculate a 95% percentile, or 0.95 quantile, but this would add code to the calculation on the client side and would deprive the flexibility in the reports — we could only use the quantiles we calculated. Therefore, their choice was stopped on the histogram.
Histogram generation was implemented in Lugin in Nginx. Found a finished project on GitHub , which connects to the Nginx configuration and generates a histogram in the manner described above. We need to collect data from the most frequently called methods, which, as you remember, we determined after sending access logs to Logstash. Therefore, it was necessary to add business logic to check whether the request should be logged or not.
As a result, integration took a week, along with the study of the hardware Prometheus and the foundations of the language Lua. In our opinion, this is an excellent result. Another great thing is that a minor amount, about 5-10 ms, is added to the response time, the overhead is due to the formation of the Histograms and the verification of our business logic, which is less than expected.
But there are also disadvantages to this solution - we do not take into account the time of requests for which the status is not 200. The reason is the log_by_lua directive, to which we added logging, is not called in this case. Here is the confirmation . On the other hand, we are not interested in the response time of such requests, because this is a mistake. Another disadvantage is that the histogram is stored in Nginx shared memory. When Nginx is restarted, the memory is cleared and the collected metrics are lost. You can also live with this - restart Nginx with the reload command, and configure Prometheus so that it takes metrics more often.
Here is the Nginx configuration for creating the Histogram:
lua_shared_dict prometheus_metrics 10M; init_by_lua ' prometheus = require("prometheus").init("prometheus_metrics") prometheusHelper = require("prometheus_helper") metric_request_time = prometheus:histogram("nginx_http_request_time", {"api_method_end_point", "request_method"}) ' Here we allocate shared memory, connect the library and helper with our business logic and initialize the Histogram - assign the name and labels.
This configuration is responsible for logging the request:
location / { log_by_lua ' api_method_end_point = prometheusHelper.convert_request_uri_to_api_method_end_point(ngx.var.request_uri, ngx.var.request_method) if (api_method_end_point ~= nil) then metric_request_time:observe(tonumber(ngx.var.request_time),{api_method_end_point, ngx.var.request_method}) ' } Here, in the log_by_lua directive, we check whether the request should be logged, and if so, add its response time to the Histogram.
Metrics are given via Nginx at endpoint:
server { listen 9099; server_name api1.2gis.com; location /metrics { content_by_lua 'prometheus:collect()'; } } Now, in the Prometheus configuration, specify the nodes of our application for collecting metrics:
- targets: - api1.2gis.com:9099 - api2.2gis.com:9199 labels: job: bizaccount type: nginx role: monitoring-api-methods team: lk project: backend In the targets section, endpoint of our nodes is specified, in the labels section - labels that are added to the metrics collected. According to them we determine the purpose of the metric and the sender.
We set up collecting metrics every 15 seconds - Prometheus enters the specified nodes and keeps the metrics for itself.
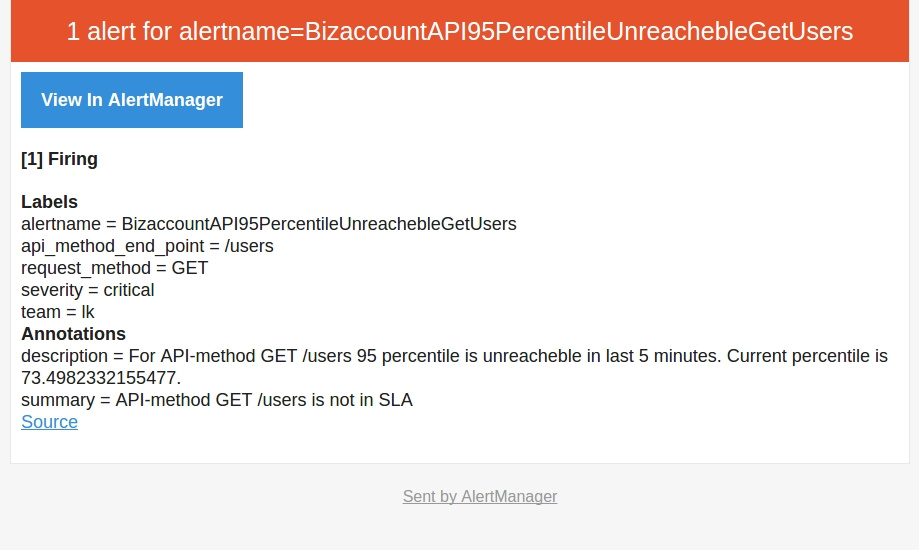
After we dealt with the metrics, learned how to collect them, give them to Prometheus, we moved on to what was started integration - alerts to the command mail when the speed of our application drops. Here is an example alert:
ALERT BizaccountAPI95PercentileUnreachebleGetUsers IF (sum(rate(nginx_http_request_time_bucket{le="0.4",api_method_end_point="/users",request_method="GET"}[5m])) by (api_method_end_point, request_method) / sum(rate(nginx_http_request_time_count{api_method_end_point="/users",request_method="GET"}[5m])) by (api_method_end_point, request_method)) * 100 < 95 FOR 5m LABELS { severity = "critical", team = "lk"} ANNOTATIONS { summary = "API-method {{ $labels.request_method}} {{ $labels.api_method_end_point}} is not in SLA", description = "For API-method {{ $labels.request_method}} {{ $labels.api_method_end_point }} 95 percentile is unreacheble in last 5 minutes. Current percentile is {{ $value }}.", } Prometheus has a laconic query generation language, with which you can select values of metrics for a period and filter by labels. In the IF directive, we use the language constructs to specify the trigger trigger condition - if less than 95 percent of requests in the last 5 minutes are answered in 0.4 seconds. This is considered an attitude. In the numerator, we calculate how many requests fit in 0.4 seconds in the last 5 minutes:
sum(rate(nginx_http_request_time_bucket{le="0.4",api_method_end_point="/users",request_method="GET"}[5m])) by (api_method_end_point, request_method) In the denominator, we consider the total number of requests for the last 5 minutes:
sum(rate(nginx_http_request_time_count{api_method_end_point="/users",request_method="GET"}[5m])) by (api_method_end_point, request_method) The resulting fraction is multiplied by 100 and we get the percentage of requests that are responsible for 0.4 seconds. The rate function here returns the response time for each moment in the specified interval. The sum function summarizes the resulting row. The by operator is an analogue of the GROUP BY operator, which performs grouping by the specified labels.
The FOR section indicates the interval between the first trigger and the moment when it is necessary to send alerts. Our interval is 5 minutes - if in 5 minutes the situation does not change, then you need to send an alert. In the LABELS section, labels with the command and criticality of the problem are indicated. The ANNOTATIONS section indicates the problematic method and what percentage of requests is answered in 0.4 seconds.
In case of repeated alerts, Prometheus can do deduplication, and will send one alert to the team mail. And this is all out of the box, we just need to specify the rules and the trigger interval.
The alerts in Prometheus turned out exactly as we wanted - with a clear configuration, without their bikes with alert deduplication and without implementing the alert triggering logic in any language.
Here is the message:
Conclusion
We have improved our logging system and now we have no problems with the lack of information.
- When an error occurs, we have enough information about the problem. Now, for 99 percent of technical support requests, we have an idea of what happened to the user and accurately orient technical support about the problem and possible fixes.
- With the help of alerts, we identify problem areas in application performance and optimize them, making the application faster and more reliable.
- Through Prometheus, we quickly find out about the fall in speed, and after that we look in ELK and begin to study in detail what happened. We see a great potential for the ELK + Prometheus bundle, we plan to add alerts in case of increasing errors and monitoring external services.
')
Source: https://habr.com/ru/post/329128/
All Articles