[Java Archeology] Context-dependent inlayning of traces in Java
Short article
Inline methods are one of the most important optimizations in JIT compilers (which are called “method based” or “block based”). This optimization extends the scope of compilation, allowing you to optimize several methods as a whole, which improves application performance. However, if you use inlining methods too often, the compile time will become unnecessarily long, and too much machine code will be generated. And this will affect the performance is already negative.
Tracing JIT compilers do not collect everything, but only frequently executed paths, the so-called traces. Using this, you can get a faster compilation, reduce the amount of generated machine code, and improve its quality. In our previous work, we have implemented an infrastructure for recording traces and a tracing Java compiler, modifying Java code HotSpot VM. Based on this work, we calculated the effect that inline tracing has on performance and the amount of generated code.
Compared with inlining methods, inlining traces provides several important advantages. First, the inlining of traces is more selective, because only frequently executed paths are inline. Secondly, recorded traces can contain information about virtual calls, which simplifies the inlining. The third advantage is that the information of the context is context-sensitive, so that different parts of the method can inline depending on the particular place of the call. These advantages allow more aggressive inline when the amount of generated code is still within reasonable limits.
We tested several inline heuristics using DaCapo 9.12 Bach, SPECjbb2005, SPECjvm2008 benchmarks, and showed that our tracing compiler achieves 51% more peak performance than the block client compiler from HotSpot. Moreover, we have shown that expanding the compile domain in our tracing compiler has had a positive effect on other optimizations, such as folding constants and eliminating null checks.
')
Notes on translation
License: CC BY 3.0 (Creative Commons Attribution 3.0 Unported)
The words “trace” and “inlineing” were left without translation because these words were too firmly included in Russian spoken language. If you try to discuss the “embedding of trails” with your colleague, you may be misunderstood.
If one code calls the other, then the caller is called the sender (caller, sender), and the called party is called the receiver (callee, receiver). These words are far-fetched, but they are short and general, and, thanks to this, do not clutter the text.
Inlining-based compilers (method-based compiler) are referred to here as “block compilers”. This neologism was also introduced in order to reduce the clutter of the text and eliminate ambiguities in the Russian version.
Pictures and diagrams are not redrawn, and contain inscriptions in English. Sorry.
The translation is kept close to the text even where it delivers non-illusory pain to the translator. In particular, the endless self-repetition, “introductions” that exceed the content of the article in terms of volume, one hundred times complex sentences are a frequent companion of all sorts of Java research. If you already have the desire to fill someone's face, then contact these desires to the authors.
Notes on translation: target audience
The other day we were steamed in a bathhouse, and in the children of revelry there was a thought that someday they would study the history of software in the same way as now - the history of Russia. Special software archaeologists will dig up wonders from the depths of ancient repositories, gently shake off dust and try to collect.
After returning home, I found that half of the documents from the must read daddy are made up of documents 5+ years old, which, in our times, was already “long ago, in a distant galaxy far”. That is, the excavation can begin right now, why wait.
Therefore, it is difficult to give any recommendation whether to read this article and the following.
Sometimes a diamond can be dug in the dirt, and sometimes rubbish is just rubbish.
On average, the text is intended for enthusiasts in the development of virtual machines.
Brief information about the authors of the text and the translator are given at the very end of the article.
And now we are transferred to 2013, spring, April, the birds are singing, the grandfathers Christian Häubl, Christian Wimmer and Hanspeter Mössenböck are sitting on the bench, and tell us about context-dependent inlineing of traces.
1. Introduction
JIT compilers based on inlining methods (hereinafter referred to as “block compilers”) translate methods entirely, turning them into optimized machine code. Tracing compilers often use executable paths as a compilation block [1]. This increases peak performance while at the same time reducing the amount of generated machine code. Figure 1 shows the control flow graph (CFG) for the three methods and three paths along them. The beginning of the trace is called the anchor (trace anchor), which is represented by block 1 for all the traces in this example. Which blocks will become the anchors, strongly depends on the specific implementation of the recording system of traces.
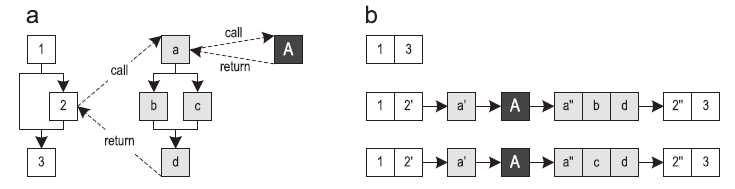
Figure 1. Traces going through three methods: (a) control flow graph (b) possible traces
In a virtual machine, traces can be recorded by instructing the execution of bytecode. Then these traces will be compiled into optimized machine code. If the part of the method that is not yet compiled is executed, the system usually returns to the interpreter mode.
Most of the current implementations of record traces allow traces to cross the boundaries of methods. [1, 2, 10, 12, 18]. This can lead to large traces that must be compiled together.
In a previous paper [14, 15], we implemented a tracing JIT compiler based on a client compiler from Oracle Java HotSpot. Our previous conference article [15] focused on inline tracing and included the following:
- A description of how to inline the trains and discuss its advantages over the inline method
- Description of several inlining characteristics implemented on its own JIT tracing compiler
- Estimation of the influence of heuristic inlining of traces on the compile time, peak performance, and the number of generated machine code for the DaCapo 9.12 Bach benchmark [3].
This article is an extended version of the document described above, and adds the following new aspects:
- A more detailed description of the record and inlining traces
- A description of why compiler intrinsics for native methods benefit from the expansion of the compilation area resulting from inline tracing
- Evaluation of our specific heuristics on benchmarks SPECjbb2005 [23] and SPECjvm2008 [24].
Moreover, we compare the peak performance of our best heuristics with the HotSpot server compiler. - Study of which high-level compiler optimizations benefit from inline tracing as a result of expanding the compilation area.
The rest of this article is organized as follows:
- overview part 2 gives a short introduction to our tracing virtual machine
- Part 3 will show the recording system of traces,
- in part 4 we will explain how to inline
- Part 5 presents to the reader various heuristics.
- Part 6 discusses benchmark results.
- in part 7 we discuss related work
- and part 8 concludes this article.
2. A quick overview
In a previous paper, we implemented an infrastructure for recording traces and a tracing JIT compiler for Java [14,15]. Figure 2 shows the structure of our VM.
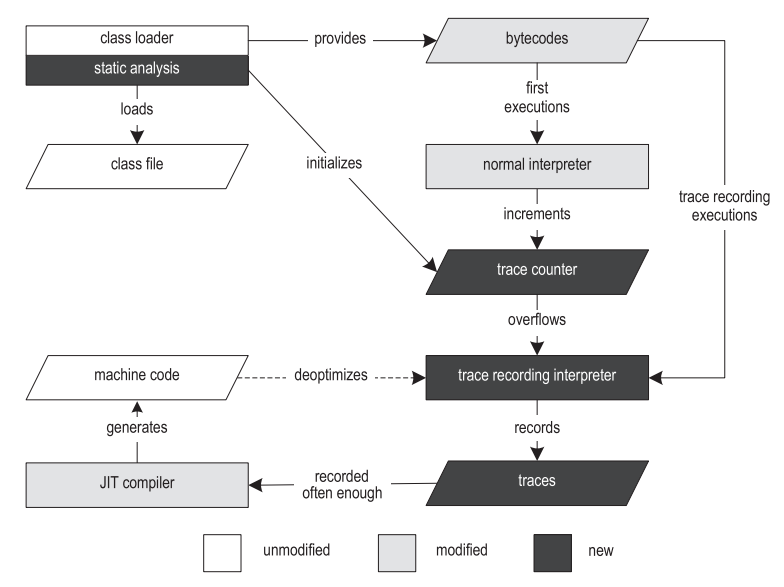
Figure 2. The structure of the tracing virtual machine
Execution begins with a class loader that loads, parses, and verifies class files. The class loader provides runtime data structures such as the Constant Pool and Method Object that refer to other parts of the VM. After the class is loaded, the bytecode preprocessing step is performed, it allows to find loops and creates data structures specific to the tracing procedure.
To record the traces, we duplicated the Template Interpreter from HotSpot [13] and instrumented it. As a result, we have obtained both a regular interpreter and an interpreter with a record of traces. The regular interpreter executes the bytecode at about the same speed as the unmodified VM, and is used for initial executions. When the usual interpreter stumbles upon the anchor of a treys, it takes the call counter of this anchor, and increments it by one. When the counter is full, the anchor is marked as “hot”, and execution is switched to the interpreter with the recording of traces (hereinafter referred to as the “recording interpreter”). The current implementation supports two different types of traces: loop traces with an anchor on the loop header, and method traces with an anchor on the occurrence of the method.
HotSpot provides two different JIT compilers that together use most of the VM infrastructure. The client compiler (client compiler) was created to provide high launch performance and implements the most basic optimizations that are nevertheless quite sufficient for achieving decent performance [19]. During compilation, the compiler generates a high-level intermediate grant (high level intermediate representation, HIR), converted to SSA (static single assignment) [7], which is a control flow graph (CFG). Both during and after building the HIR, such optimizations are applied as convolution of constants, elimination of null checks and inline methods. The optimized HIR is translated into a low-level intermediate representation (low-level intermediate representation, LIR), which is very close to the machine code, but still, mostly, independent of the platform. Then, LIR is used to allocate the registers by linear scanning [27] and code generation.
The server compiler (server compiler) performs much more optimizations than the client compiler, and produces highly efficient code that can produce the highest possible peak performance [21]. It is intended for long-lived server applications, such that the initial JIT compilation introduces only a small overhead compared to the total execution time. The server compiler goes through the following compilation phases: parsing, platform independent optimization, selection of instructions, global code movement and planning, allocation of paint registers to the graph, peephole optimization and code generation. The server compiler can use several additional optimizations, such as loop-invariant code motion (stretching out of the loop), looping and escape analysis.
Our own trace-based JIT compiler is based on the client compiler from HotSpot. Despite the fact that our techniques are sufficiently generalized to be applicable even to the server compiler, its complex structure is much worse for modifications that are needed for tracing compilation, especially in the context of a research project. Therefore, we decided to use the client compiler as the basis.
When traces begin to be created often enough, our compiler first merges them into a graph of traces. This structure is a hybrid between the flow control graph (CFG) and the tree of traces [10], and in it, even with merge points, some paths can be duplicated, if this gives some advantage. At this level, we do general and trace-specific optimizations, such as constant folding, aggressive inlining of traces, and explicit duplication of control flow. The generated machine code is subsequently directly called either by the interpreter or by other compiled traces.
If the precondition of aggressive optimization was violated during execution, our system is deoptimized [18] to a recording interpreter. De-optimizing first saves all the values that are alive in the current compiled frame, and then replaces this compiled frame with one or more interpreted frames. The specific number of interpreted frames created depends on the inline depth of the instruction currently being executed. Then the interpreted frames are filled with the previously saved values, and execution continues in the recording interpreter.
When a recording interpreter takes over, instead of using the main trace anchor, it can write a partial trace that starts directly from the deoptimization point. To notice de-optimizations of the compiled code that are too frequent, the counter is incremented every time de-optimization happens. After reaching the threshold, the compiled machine code is discarded, and a new compilation is launched, which uses both the originally recorded traces and all partial traces. This allows you to take something that will reduce the frequency of de-optimizations - for example, you can increase the coverage of methods or turn off some specific aggressive optimizations.
3. Record of traces
Our approach to recording traces limits the tracing to the bounds of one method [14]. At the moment when we discovered that the anchor began to be executed quite often, the execution switches from the usual to the recording interpreter. To record a trace, each thread carries a stack of traces that stores all the traces that are being written. Information about instructions that can modify a control graph is stored in the topmost trace on the stack, and the stack is modified accordingly to support this rule.
When a method is called during the recording of a trace, the call is recorded in the source of the call source. For calling virtual methods, in addition to this, the receiving class is also recorded. Upon entering the callee method, the new method trace is put on the stack, and the recording goes on.
When the callee is returned, the corresponding trace is taken from the stack and stored in the trace repository. Next, the caller and the called trace are linked by saving the pointer to the callee in the calling trace, and further recording goes to the calling trace. This link stores context-sensitive information about the call across method boundaries, which leads to the appearance of a data structure similar to a dynamic call graph.
When an already saved trace is recorded again, instead of recording it completely on a new one, there is a simple increase in the counter. We believe that traces differ, if they go in different ways, or if they invoke different traces within the called methods. Therefore, linking traces allows us to get accurate information about the call for each executed path that passes through any part of the application. To reduce the number of recorded traces to a reasonable value, we do not associate with the parent trace traces of loops and recursive methods. Immediately after the recording of the trace is performed a certain number of times for the same anchor, it is assumed that all the important traces for this anchor have already been written and compiled into optimized machine code.
Figure 3 shows an example of a trace record in which a record began for the addData method.
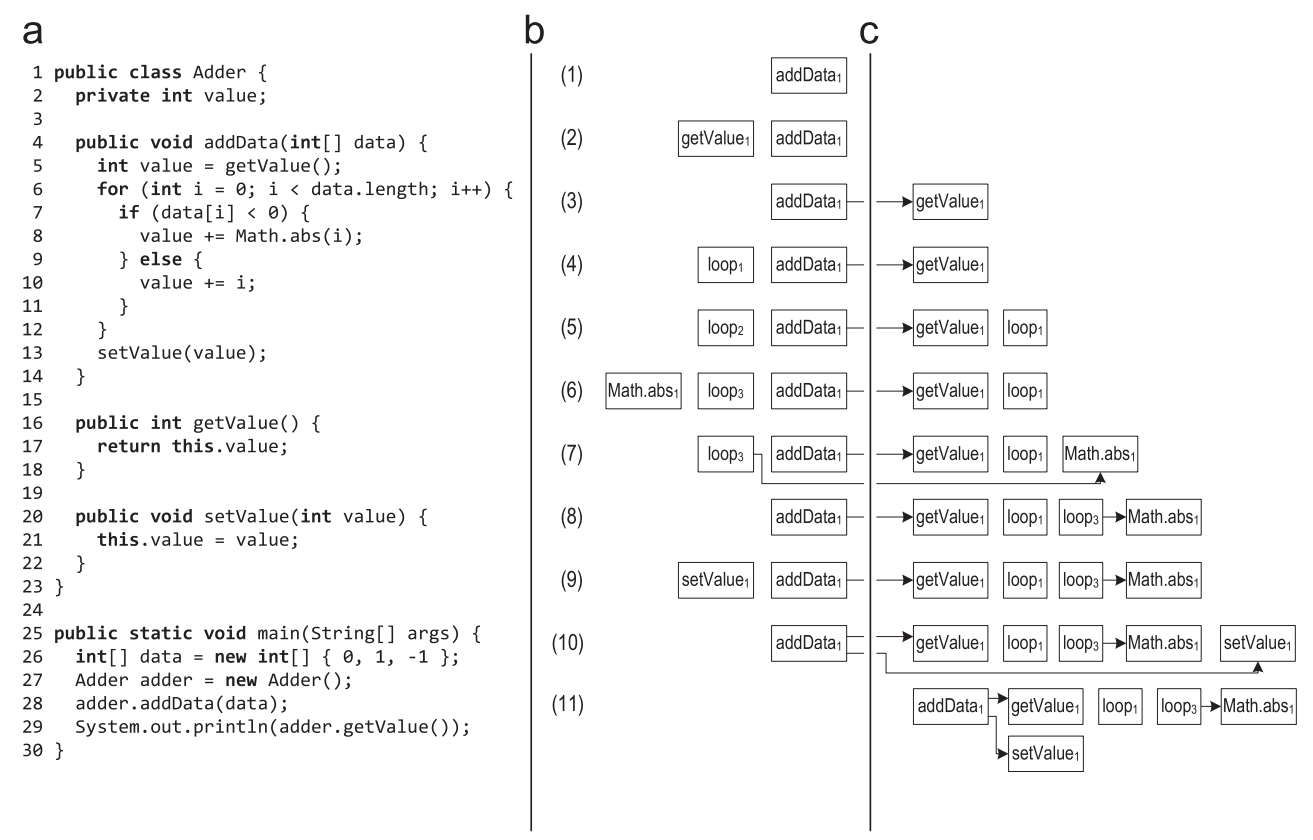
Figure 3. Stack of traces during tracing: (a) source code (b) stack of traces (c) traces stored in the repository
- When the anchor of the addData () method is marked as hot, the execution is switched to the recording interpreter, and the method trace is placed on the stack of traces. The method runs from the very beginning to the virtual method getValue (). When executing a virtual call, the calling class and the receiving class are stored in the calling trace.
- When entering the getValue () method, a new method trace is placed on the stack of the trace and the recording continues in it.
- When getValue () returns, the corresponding trace is taken from the stack and stored in the treys repository. After that, the traces are linked by saving the pointer to the getValue () trace in the getData () trace. Execution and writing continue for addData (), and reaches the loop header.
- To record a loop, a new loop loop is put on the stack.
- After the first iteration of the loop, when execution returns to the loop header, the trace of this loop is taken from the stack and saved. For the next iteration of the loop, a new loop of the loop is put on the stack. The second iteration is performed in the same way as the first, so the system understands that such a trace has already been recorded, and does not save it in a new way, but only increases the counter in the old saved trace.
- The third iteration of the loop follows a different path, the Math.abs () method is called, and a new trace of the method is placed on the stack for it.
- When Math.abs () returns, the corresponding trace is stored and associated with the calling trace.
- After that, execution reaches the loop header, and the loop ends. Trace loop is taken from the stack and saved.
- After exiting the loop, the virtual method setValue () is called. The calling and receiving classes are stored in the calling trace, and the new method trace is put on the stack at the moment of entering setValue ().
- When setValue () returns, the corresponding trace is taken from the stack, stored, and associated with the calling trace.
- In the end, the addData () method returns as well, it also gets from the stack and is saved.
- After that, the stack is empty and the execution is switched back to the normal interpreter.
In this example, we meant that for the called methods and the loop, the traces were not compiled. If the traces for the getValue () method are precompiled, then a call to getValue () would have run the compiled machine code instead of interpreting the method. A recording interpreter would not be able to put a new method trace on the stack, and would not be able to record the flow of control for the called methods. In this case, our approach to recording traces would not be able to ensure that specific information about the control flow is retained when crossing the boundaries of methods. It would be possible not to call the compiled code, and instead at least once force the execution of this code in the recording interpreter, having received all the necessary information. However, this would drastically reduce the launch performance, because the application would be interpreted significantly longer.
For best recording performance, all frequently executed operations (such as writing information about specific instructions) are directly implemented in the recording interpreter in the form of assembler templates. More complex operations, such as saving recorded traces, are implemented in interpreter runtime written in C. Our framework for recording traces also supports efficient multithreading, so any thread in Java can independently switch between the regular and recording interpreter. Each thread uses a thread-local buffer to write the trace to achieve the best write performance.
During recording, several threads can simultaneously work on data structures that store recorded traces in themselves. We noticed that for most anchors a very small number of traces is recorded, so saving a new trace is rarely required, but increasing the execution counter is required all the time. Therefore, we store the stored traces in data structures that use the minimum number of locks and atomic instructions when reading. When it seems to the system that it finds a new trace, we block this data structure for other recording threads, and under the lock, we double-check whether this trace is really new, and only after that we add it to the storage. This simple method, for the most frequent case, we avoid synchronization and atomic machine instructions, which significantly increases the write performance in multi-threaded applications.
4. Inline Tracing
Inline methods replace method calls with copies of the actual executable code. Heuristics inline can be divided into static and dynamic.
The client compiler HotSpot uses simple static heuristics for inlining methods, in which the size of the method is compared with a fixed limit. Virtual methods are inline using static hierarchy analysis (CHA) [8]. This analysis will determine if the method has been overridden by any of the loaded subclasses, and in this case it can be optimistic zainlaynit. If then another subclass is loaded that overlaps the optimistically inline method, the generated machine code is thrown. In contrast, dynamic inliner heuristics use information from a profile, and based on this, it is decided whether to inline the method.
Our tracing JIT compiler supports both types of heuristics at the same time using recorded trace information. As with inline methods, inline tracing replaces calls with copies of the actual executable code. This increases the scope of compilation and can improve performance.
4.1. Benefits of Inline Tracing
Inline tracing has several advantages over inline methods:
- Inline tracing handles only frequently executed traces, and not methods entirely. Block compilers try to use information from a profile to avoid compiling rarely used parts of methods [9,25,26]. This allows you to achieve a similar effect to the inlining of traces, but is just an additional secondary approach.
- The recorded traces contain context-sensitive information about which parts of the methods are used and by whom. This information is retained when crossing the boundaries of methods and can be used in order not to inline those parts of the methods that are generally used very often, but are not needed right now by a particular sender.
- Traces contain information about the recipient of the virtual call, and as a result of linking traces, this information is also context-sensitive. It may be that a specific place of a call is called only by methods that have a very specific type of recipient. This information can be used to aggressively inline virtual methods. Block compilers also use profile information to aggressively in-line virtual calls, but in most compilers this information is not context-sensitive.
4.2. Implementation
Inline starts with calculating the maximum size of the trace that needs to be inlined at the current call site. This mainly depends on the relevance of this call site (see Part 5.1). Then heuristics are used to decide whether to inline the called traces in this place of the call. To a large extent, it all depends on the size of these traces, because too much traces lead to bloat code.
Inline tracing is similar to inlining methods, except that traces usually do not cover the entire bytecode of the receiver. We take traces which need to be zainlaynit, we build from them the graph, and we replace calls of methods with contents of this graph. Then all return operations located inside the inline bytecode are replaced by direct jumps to the instruction following the call instruction, and instructions for throwing out exceptions are associated with exception handlers that are in the sender's trace.
Figure 4 (a) shows the flow control graph for the two methods. The two trains that follow these methods are shown in Figure 4 (b). After the recording of the trace has been performed quite often, the recorded traces are sent for compilation. The resulting graph resulting from the inlining of the traces (but without explicit duplication of the control graph) is shown in Figure 4 (c). Then the graph of traces is compiled into optimized machine code. If one of the removed blocks has to be executed in the future, the compiled code will be de-optimized to the interpreter.
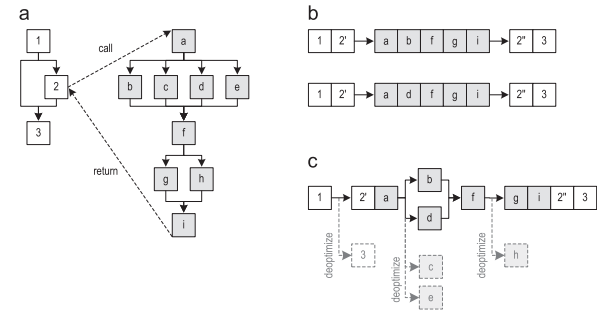
Figure 4. Inline method trace: (a) control flow graph (b) recorded traces (c) trace graph after inlining
It is also interesting that we removed the edge that goes from block 1 to block 3, even though the trace graph does not contain block 3. This is a great idea because it allows you to avoid merging control threads. If the merge was done, it would limit the possible compiler optimizations. Removing non-executing edges results in more optimized machine code.
In most cases, we only inline those traces that are called by the current sender. However, if the receiver's traces were compiled before the trace record was included for the sender, this sender does not know what kind of compiled traces he needs. In these cases, we conservatively believe that all recipient traces are suitable for inline, except for which we can prove that they cannot be called as the current sender, due to the use of certain parameters that the sender transmits to the recipient. Behind this is a technology similar to the removal of a dead code (dead code elimination, DCE) in block compilers, but it allows you to delete entire traces instead of basic blocks. To further reduce the number of inline traces, we also filter out rarely executed traces (see part 4.five).
For calling virtual methods, the information on the recorded trace is combined with CHA from the HotSpot client compiler, which allows you to define a specific recipient class for the current call site. If CHA defines one particular target method, the calls of the called method are inline in the same way as the client compiler inline methods. If CHA finds several possible target methods, we try to use the sender's recorded classes to aggressively inline the method's traces. To do this, we add a runtime check that compares the actual type of the receiver with the expected type and deoptimizes to the interpreter if the types do not match. By combining CHA and context-sensitive information about tracing, we can inline virtual methods more often than most block compilers,creating runtime checks only when really necessary.
In addition to inlining tracing methods, we began to support inline cyclic traces. Figure 5 (a) shows a traces graph constructed for the traces method that caused the cyclic trace. Cyclic traces are not yet inline, so the cycle is represented as a black box, which is still unknown to the compiler. In the next step, a separate graph of the traces is constructed, only for cyclic traces - Figure 5 (b). Further inlineing replaces the black box in the column of the sender with the cycle graph, and connects all exits from the cycle with their correct continuation blocks using jump instructions. In this example, block b is associated with block e, and block c is associated with block d, which leads to the trace graph shown in Figure 5 (c).

Figure 5. Inline cycle trace: (a) graph trace of method (b) cycle trace graph (c) state after cycle
inline During inline cycling, we assume that all traces recorded for a particular cycle are inline candidates. This is necessary because the cyclic traces are never directly associated with their calling trace, and therefore no context-specific information about the call is available. However, we use information about the parameters and local variables that are included in this cycle, and thanks to them we remove those traces for which it is possible to prove that they cannot be caused by the current sender. Moreover, we also remove traces that are not executed often enough.
A more complicated case is when the inline loop has an output whose continuation does not exist in the sender column. In Figure 5 (a), block d may disappear, for example, because it has never been recorded. Despite this, both loop exits can be represented in recorded cyclic traces, as shown in Figure 5 (b). One way this can happen: the cyclic traces were compiled before the recording of the method trace began. Initially [15], we circumvented this problem by explicitly adding de-optimization points to all exits from the cycles that cannot be associated with a continuation, and the execution was de-optimized every time the cycle was completed along this path. Now we simply remove the cyclic traces that end with a loop exit that is unknown to the current sender.This reduces the number of inline candidates and reduces the number of generated machine code.
4.3. Contextual dependency
Our recording infrastructure limits the size of the trace to a fixed depth of 1 method, so the tracing compiler relies heavily on aggressive inlining of traces [15]. The mechanism for recording traces saves context-sensitive information when crossing the method boundary, so each sender knows which parts of the receiver he should be zainlaynit. This helps the compiler to avoid inlining those parts of the method that are generally performed quite often, but not relevant for the current sender. This reduces the number of generated machine code and reduces the number of merge points, which generally has a positive effect on peak performance.
Block compilers also use profile information to remove code that never executes. However, the information in their profiles is usually not context-sensitive, which is why they cannot decide which particular parts of the method are needed by which particular sender. Context-sensitive profile information can, in principle, be recorded for the block compiler, but we believe that writing traces and a tracing compiler greatly simplify this process.
Figure 6 shows the indexOf () method for the ArrayList class from the JDK.

Figure 6. ArrayList.indexOf () method
The first part of the method handles the rare case of a null search, the second part searches for a list of objects that are not null. Most senders need only the second part of the method. However, if at least one sender appears in the application, which executes the first part of the method, the information in the block compiler profile will show that the first part was also executed. Therefore, each time the block compiler inline the indexOf () method, it also inlines and this rarely executed piece of code. We have context-sensitive information, and our tracing compiler can avoid the above-described problem when the sender does not need some part of the method.
Since inlining is more discriminating in that it is going to inline, our tracing compiler can use a more aggressive inlining policy, for example, it can inline traces that follow methods that are too large in size to be completely inlined. This increases the scope of the compilation without the need to inline more Java bytecode than the block compiler does. In particular, for complex applications, this leads to more optimized machine code, and has a positive effect on peak performance.
Figure 7 (a) shows the LineBuilder class, which wraps an Appendable and provides the appendLine () method.
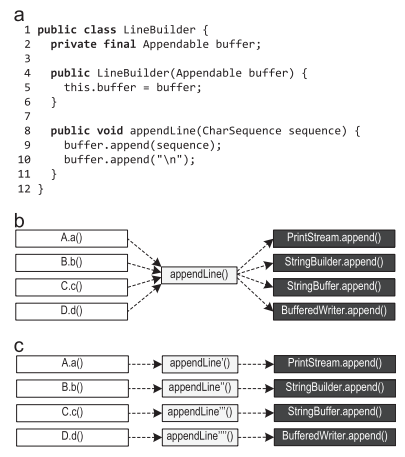
Figure 7. Context-sensitive information: (a) pattern (b) possible method calls (c) preferred inlineing
If multiple LineBuilder objects are used to wrap instances of various classes, such as PrintStream, StringBuilder, StringBuffer, and BufferedWriter, then append () calls on lines 9 and 10 will become polymorphic calls that are not as simple as Figure 7 (b).
If the dispatching in appendLine () depends on the location of the call, for example, because different LineBuilder objects are used at different call sites, inlineing is preferred, as shown in Figure 7 (c). Our context-sensitive information about the trace also stores the recipient of virtual calls. Therefore, our tracing compiler can do exactly this preferred inline from Figure 7 (c), using the available context-sensitive information for aggressive in-line virtual calls. If the compiler does not write context-sensitive information to the profile, but simply collects all the detected types (such as PrintStream, StringBuilder, StringBuffer, and BufferedReader with buffer.append ()), it will not find enough information to back-line such virtual calls.
In the previous version of our tracing compiler, in cases where the record of traces showed that the called method always belongs to the same type of receiver, we used only information about the types. Such inline traces are protected by a “type guard” (type guard), which compares the actual type of the recipient with the expected type, and deoptimizes to the interpreter if the types do not match. In this article, we expanded the inlining of traces in the following ways:
- , , . , , , , (override) . , « » (method guard), . , .
- , , « » , switch, . , , . , .
- – . 8(a) , . , . , 8(b), 2' / , . switch , . , .
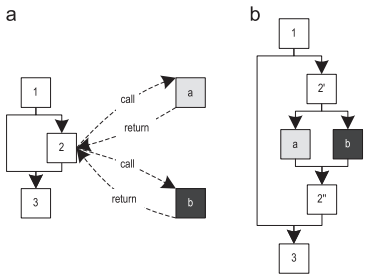
8. : (a) (b)
The server compiler HotSpot also inlines polymorphic calls, but limits the number of methods to be called to a maximum of two, since a large number of them can easily lead to bloatting of the code. Our inline tracing compiler for method chunks is more selective because it has context-sensitive information about recorded traces. Therefore, we can avoid inlining those pieces of the method that were generally performed frequently, but not needed by the current sender. Moreover, the recorded type information is also context-sensitive, which reduces the number of inline candidates. Therefore, our tracing compiler has no limit on the number of inline methods, and instead limits the total number of all inline methods, depending on the frequency of execution of a particular call site.For applications with a high number of polymorphic calls, this leads to significantly better inlining, and, consequently, higher performance, without problems with excessive bloating of the code.
4.4. Native methods
Java code can call native methods using the Java Native Interface (JNI). This mechanism is mainly used to implement platform-specific functions that cannot be expressed in Java in any other way. Since no Java code is executed for these methods, their trace recording is impossible.
HotSpot uses compiler intrinsics for the most important platform-specific methods, so the JIT compiler can inline such methods. If our tracing JIT compiler compiles a trace graph that contains a call to a native method implemented as a compiler's intrinsic, we do exactly the same inline as the block compiler. However, our tracing compiler still has one advantage: traces are less than methods, so our tracing compiler can inline traces more aggressively than the block compiler inline Java methods. This expands the scope of the compilation, and the code that calls the native method has accurate knowledge of the parameters that go into this native method. The JIT compiler can use this information to aggressively optimize inline compiler intrinsics.
Figure 9 (a) shows pseudo-code for the implementation of the System.arraycopy () native method, which is used to copy primitive arrays.

Figure 9. Pseudocode of the System.arraycopy () method for copying primitive arrays: (a) non-optimized code (b) optimized code
Depending on what information about the parameters passed to System.arraycopy () is known to the compiler, it can optimize intrinsics. Figure 9 (b) shows an optimized version of the method where the compiler can optimally exploit the parameter values. The necessary information about the parameters for this particular example becomes available where the source array and the target array are located in the same compilation area in which System.arraycopy () is inline. That is, increasing the compilation area can help us increase the performance of inline compiler intrinsics.
4.5 Filtering traces
When the trace is already recorded, the chances are great that this trace is quite important and will often be executed. However, it sometimes happens that recorded traces are rarely executed. Throwing these traces, we can guarantee that only important paths will be compiled. Figure 10 (a) shows the graph of traces after merging all recorded traces. The edges of the graph are annotated by the frequency of execution.
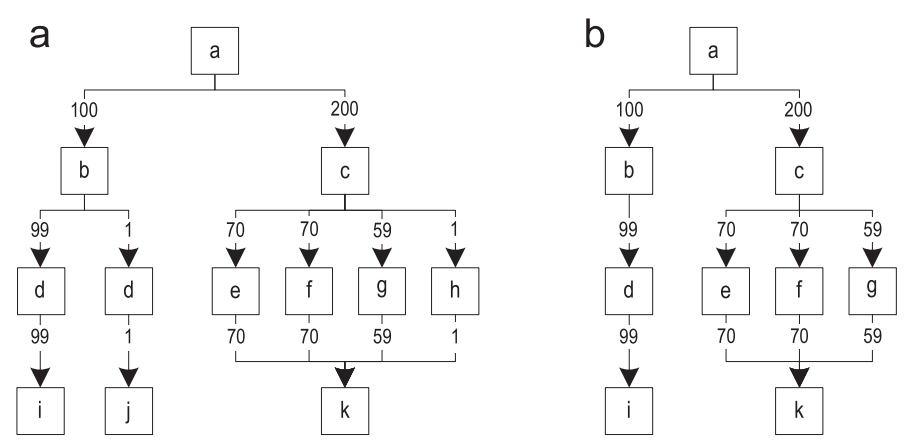
Figure 10. Filtering rarely executed traces: (a) original traces graph (b) traces graph after filtering
For each block, we determine the most frequently executed outgoing edge, and compare this frequency with all other outgoing edges of the same block. Then, we remove the edges with a frequency that is a hundred times smaller. After processing all the blocks, remove from the graph no longer available blocks. Figure 10 (b) shows the resulting graph after filtering.
The recorded information about the traces saves the behavior of the program, which was observed only during a specific time window. In later stages of execution, rarely executed (and therefore remote) paths may become important again, because program behavior changes over time. This leads to frequent de-optimizations, since non-compiled paths start to run. If unnecessarily frequent de-optimization is detected, the old compiled machine code is thrown away and a new compilation is started. This compilation avoids filtering traces for those cases that led to frequent deoptimization.
Filtering traces has several difficult cases that need to be taken care of separately:
- , , (. 5( c )). , . , , . .
- . , . , , .
5.
All inlining heuristics presented in this section are similar in that they first calculate the relevance of the call site, and then use the relevance value to calculate the size that needs to be inline. A specific decision about the need for inlining is a simple comparison of the maximum size with the actual size of the traces that we decided to inline. For evaluation, we used a combination of several heuristics with various relevance calculation algorithms.
5.1. Call Site Relevance
The relevance of the call site is determined by the relevance of the block in the trace column in which the call site is located. We checked three different relevance calculation algorithms and illustrated their behavior with two examples of traces graphs, A and B, shown in Figure 11.
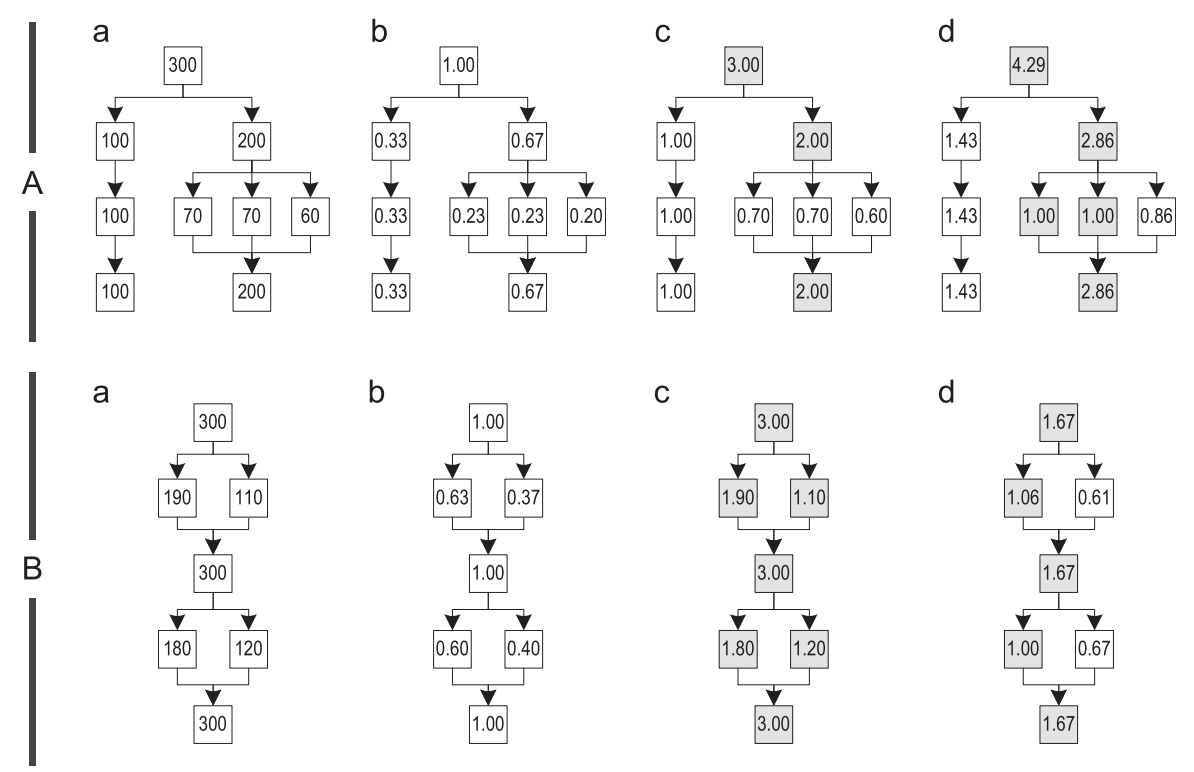
Figure 11. Different relevance calculation algorithms: (a) count of executions (b) simple (c) most frequent (d) path-based
Example A is built from four different traces, which are unlikely to have any identical blocks. Example B represents a graph constructed from four traces, but each block in them is common for at least one other treys.
To calculate the relevance of the blocks, we first determine how often the recorded traces execute each of the blocks. Figure 11 (a) shows graphs in which each block is annotated with the corresponding frequency of executions. Then, we calculate the relevance of each block by dividing its frequency of executions by some initial value. Depending on this value, the relevance is scaled differently. One of the following algorithms is used to select the initial value:
- Simple : – , . ]0,1], , , 11(b).
- Most frequent trace : , , - . , , , , . , , , ]0,1] , . 11( c ), , , 1, B.
- Path-based : . . «» , , . (. 11(d)). , . , , , , , , [1; ∞], ]0,1[.
5.2. Configurations
We started with 15 heuristics inlining, both static and dynamic. For each heuristic, we performed a systematic search for good parameters. In the course of this assessment, all dynamic heuristics have overtaken all static performance, so in this article we will not provide detailed results for static heuristics. Moreover, we will describe only those variants of dynamic heuristics that showed good peak performance or a small amount of generated machine code.
- Minimum code : 35 , . 1 , 1 – . «path-based», . «simple», , , . .
- Balanced : 40 , , . 1 , 1 . , , . «path-based» , .
- Performance : – 150 , , 1. . , «path-based». , , .
- Greedy : , – 250 , 1. , , «most frequent trace». , . , , 6, . , , .
As with block compilers, all of our heuristics check that small methods, such as setters, getters, always inline. This makes sense, since calling small traces may require more machine code than inline itself. Another strategy that is used in the HotSpot server compiler is to avoid inlining methods if the receiver has already been compiled separately, or if the compilation will result in a large amount of generated machine code. It implies that a sufficiently wide compilation area already has enough information for good compiler optimizations, so an increase in the compilation area beyond certain boundaries is not advisable. We use this technique for all our in-line heuristics, because it reduces the amount of generated machine code without a measurable impact on performance.
To reduce the likelihood of inlining nested traces, we verify that inline traces inherit relevance from the parent call site. To do this, we multiply the relevance of each called block by the relevance of the calling block. However, we limit the maximum inherited relevance to 1, since otherwise the relevance may rise with the inlining level. Again, the inheritance of relevance reduces the number of generated machine code without a measurable negative impact on performance, so it is used by all our heuristics.
6. Testing and evaluation
We implemented our tracing JIT compiler for IA-32 architecture for HotSpot VM using early access version b12 of the JDK8 being developed [20] (this happens in 2013 - translator comment). To test inline heuristics, we chose SPECjbb2005 [23], SPECjvm2008 [24], and DaCapo 9.12 Bach [3], since they cover a large number of different checks. The bench on which the benchmarks were launched has the following configuration: Intel Core-i5 processor with 4 cores at 2.66 GHz, 4n256 kb L2 cache, 8 MB of shared L3 cache, 8 GB of main memory, and Windows 7 Professional instead of the operating system.
The results are presented in relation to the unmodified block client compiler HotSpot, which is taken as 100%. For a tracing JIT compiler, the amount of generated machine code also includes data specific to the tracing compilation, such as additional information about de-optimizations needed to fall through to the interpreter. Each of the above benchmarks was performed 10 times - the results show the average of these results with a 95% confidence interval.
6.1. SPECjbb2005
This benchmark simulates a client-server business application, in which all operations are performed on an in-memory database, which is divided into so-called warehouses. The benchmark is executed with a different number of warehouses, and each warehouse is processed by a separate thread. We used a stand with 4 cores, so the official throughput of SPECjbb2005, measured in business operations per second (bops), is defined as the geometric average of the performance of warehouses 4-8. For all measurements, a 1200MB hip was used.
Figure 12 shows peak performance, generated machine code, and compile time for SPECjbb2005. All our versions of the tracing compiler turned out to be much faster than the client compiler in terms of peak speed. More aggressive inlining of traces led to greater peak performance, but this led to an increase in the number of generated machine code and took more time to compile, as this resulted in very large compilation blocks. Peak performance of SPECjbb2005 is clearly improved from the configuration of "performance" due to the increased aggressiveness of inline tracing. The “greedy” configuration raised peak performance, but very slightly, generating much more machine code. In terms of compile time and the number of generated machine code, the "minimum code" configuration proved to be particularly efficient, while providing decent peak performance.
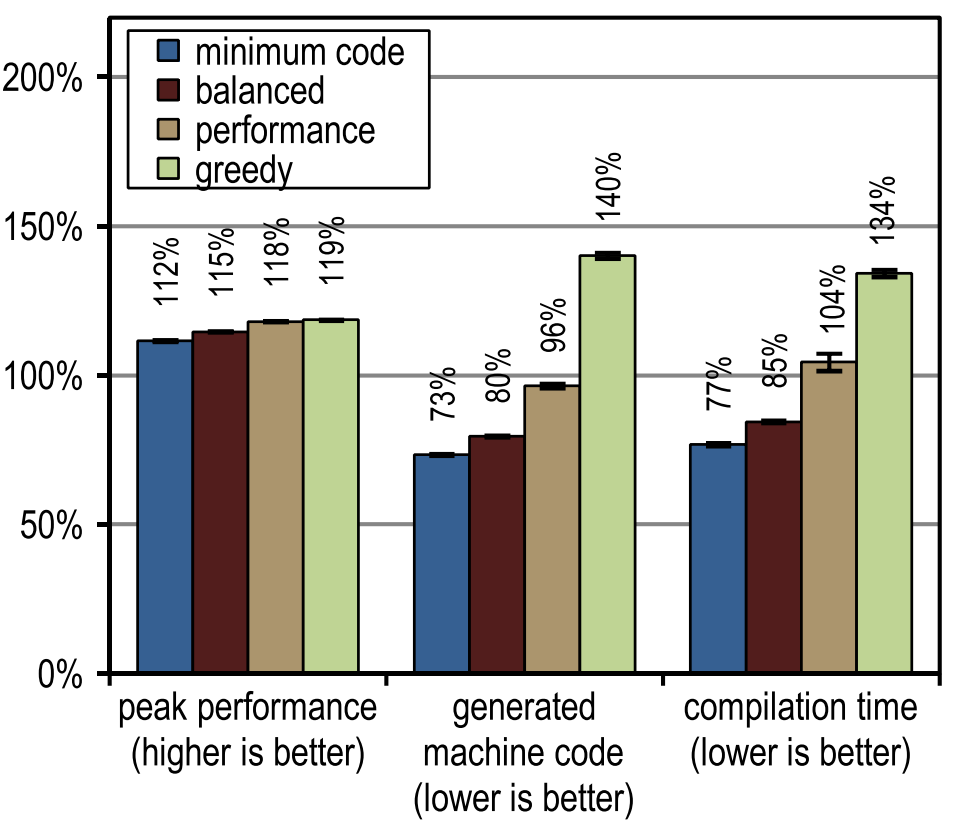
Figure 12. SPECjbb2005 results
Figure 13 represents the peak performance of SPECjbb2005 for different numbers of warehouses and different in-heuristic heuristics. The maximum peak productivity is reached at 4 warehouses, as each warehouse is processed by a separate thread, and our stand has just 4 cores. The figure shows that our configuration overtakes the block client compiler, regardless of the number of warehouses.
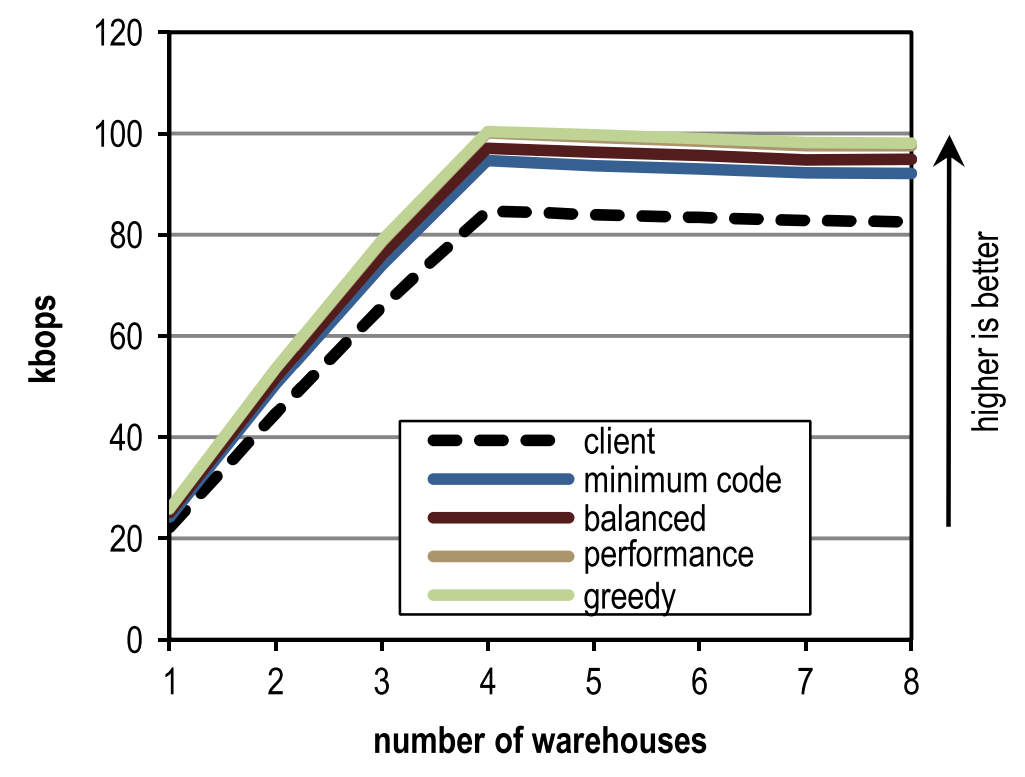
Figure 13. Peak performance for different number of warehouses in SPECjbb2005
6.2. SPECjvm2008
SPECjvm2008 consists of 9 categories of tests that measure peak performance. Right after the individual test results, the geometric mean of all the results is given. For all tests a 1024 MB hip was used.
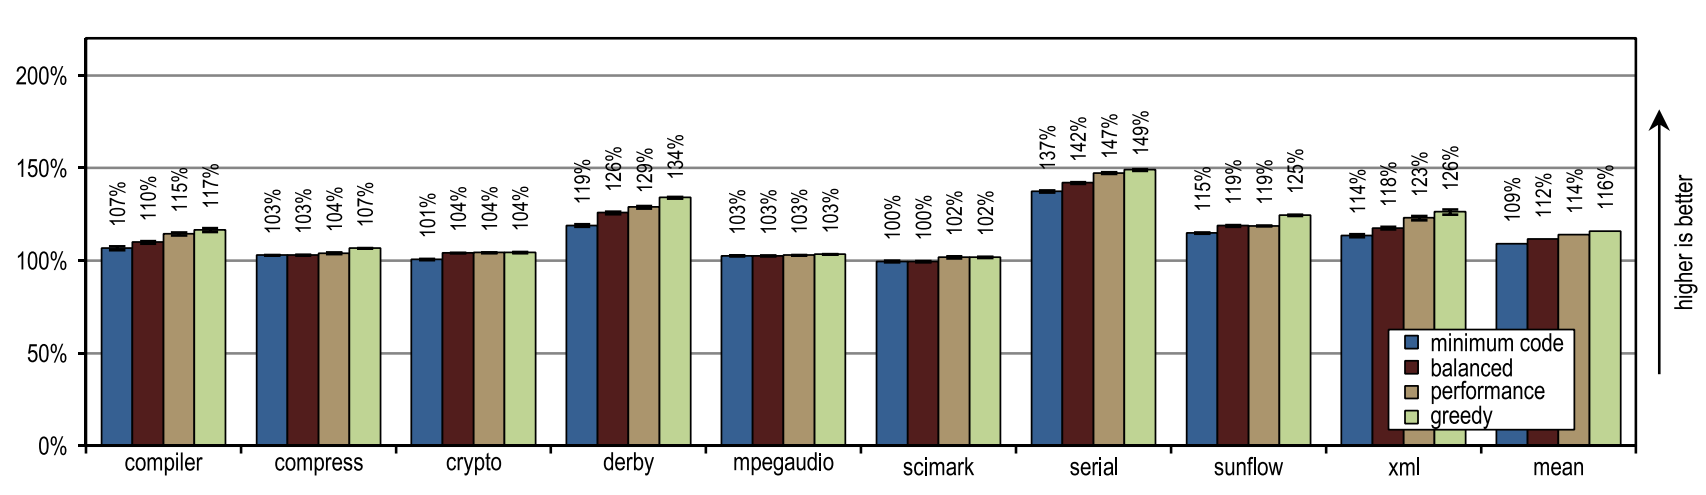
Figure 14. Peak performance SPECjvm2008
Figure 14 shows that all our configurations have overtaken the HotSpot block client compiler. These configurations showed maximum acceleration on derby and serial tests. The inlining of traces on them made it possible to achieve a larger compilation area than the inlining of methods used in the client compiler HotSpot. The very aggressive policy of inlining traces, such as in the “greedy” configuration, did not lead to an increase in peak performance, especially for derby and sunflow benchmarks. Moreover, aggressive inlining of traces increased both the number of generated machine code and the time of JIT compilation (see Figures 15 and 16).
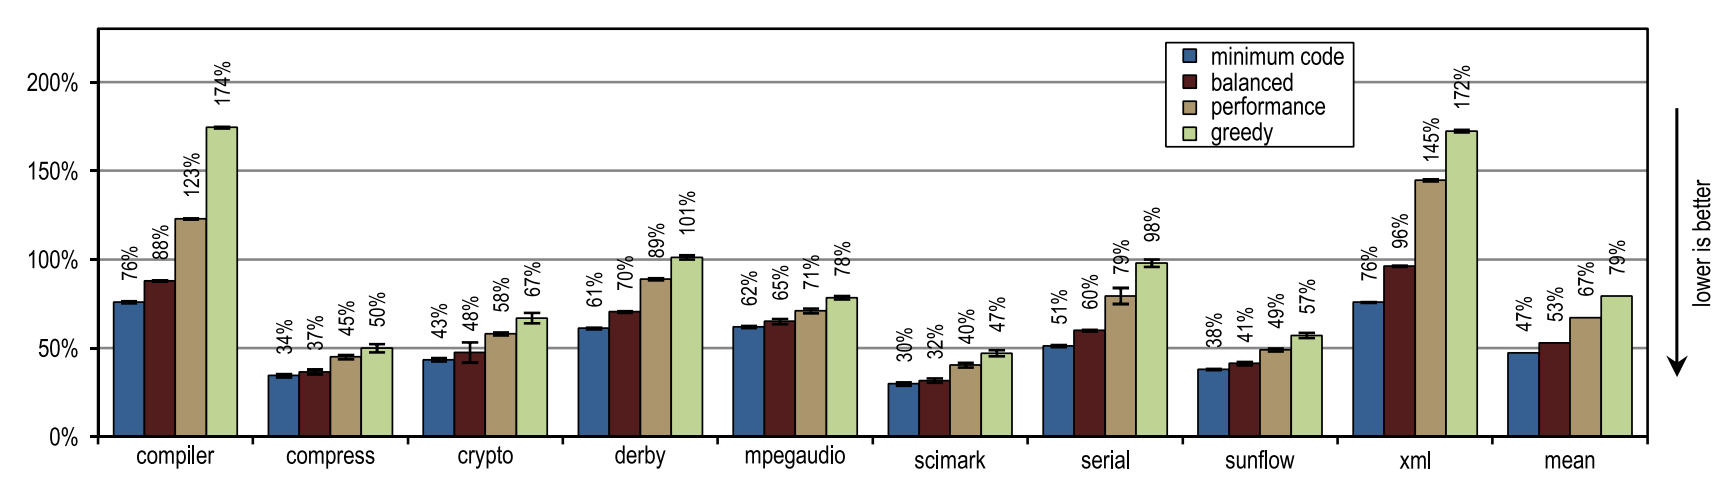
Figure 15. Number of generated machine code in SPECjvm2008
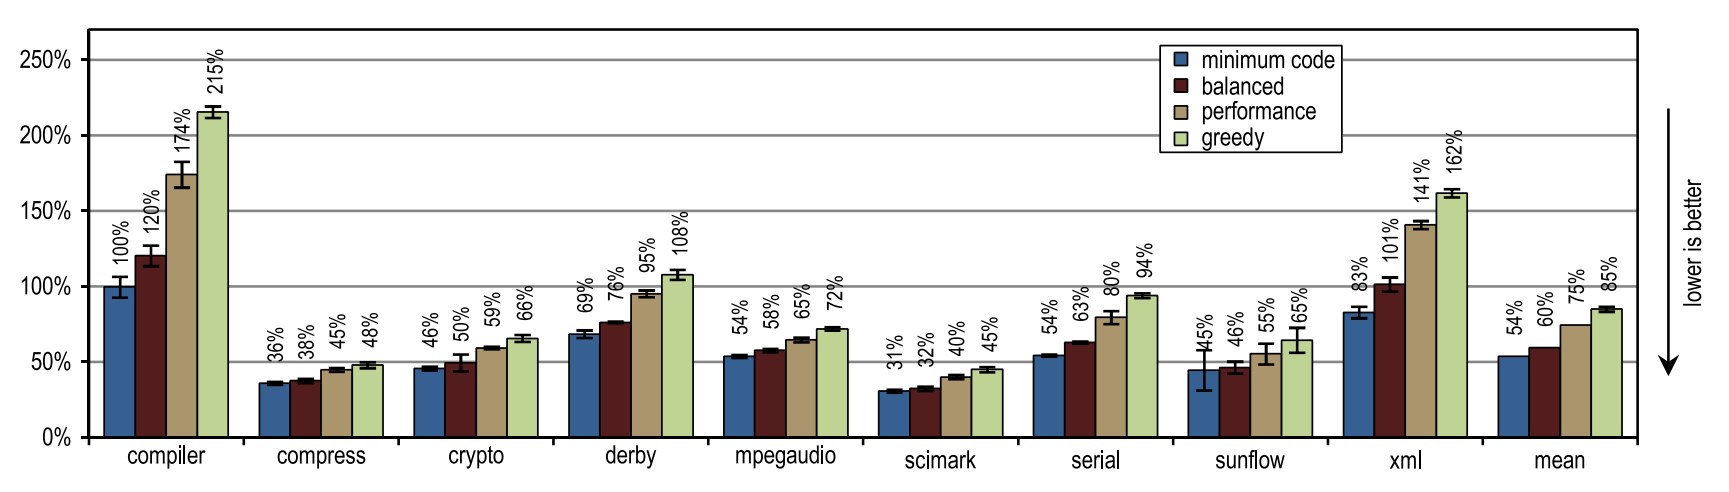
Figure 16. Compile time in SPECjvm2008
Small tests with intensive use of cycles crypto, mpegaudio and scimark showed almost no increased peak performance, since the block client compiler HotSpot was also able to reinstall all the calls in performance-critical cycles. Due to the small size of these tests, our tracing compiler was able to achieve only a comparable size compilation area. However, our tracing compiler zainlaylny traces instead of the entire contents of the methods, which led to the creation of significantly fewer generated machine code and reduced compilation time (see Figures 15 and 16).
Figure 15 shows that the amount of generated machine code depends on the size of the inline, so that you can suddenly generate too much code. However, small and cycle-intensive benchmarks do not show excessive code spread, even when our most aggressive inliner heuristics are used. On such benchmarks, inlining heuristics should be very conservative, and should never act too aggressively.
6.3. DaCapo
DaCapo 9.12 Bach consists of 14 applications written in Java. Using the default data size, and the hip size is 1024 MB, each test was run for 20 iterations, so the execution time converges. We show only the fastest run for each of the tests, and the geometric average of all the results. A heap size of 1024 MB was used for all measurements.
Figure 17 illustrates the peak performance of DaCapo 9.12 Bach, and Figure 18 shows the number of generated machine code. The greedy inlining heuristics showed the best peak performance, but it generated more machine code than the unmodified HotSpot client compiler. In particular, luindex, pmd, and sunflow benefited from the use of “greedy” because it provides the maximum inline size. However, in some tests this heuristic is so aggressive that an excessive amount of machine code is generated without significant changes in peak performance.
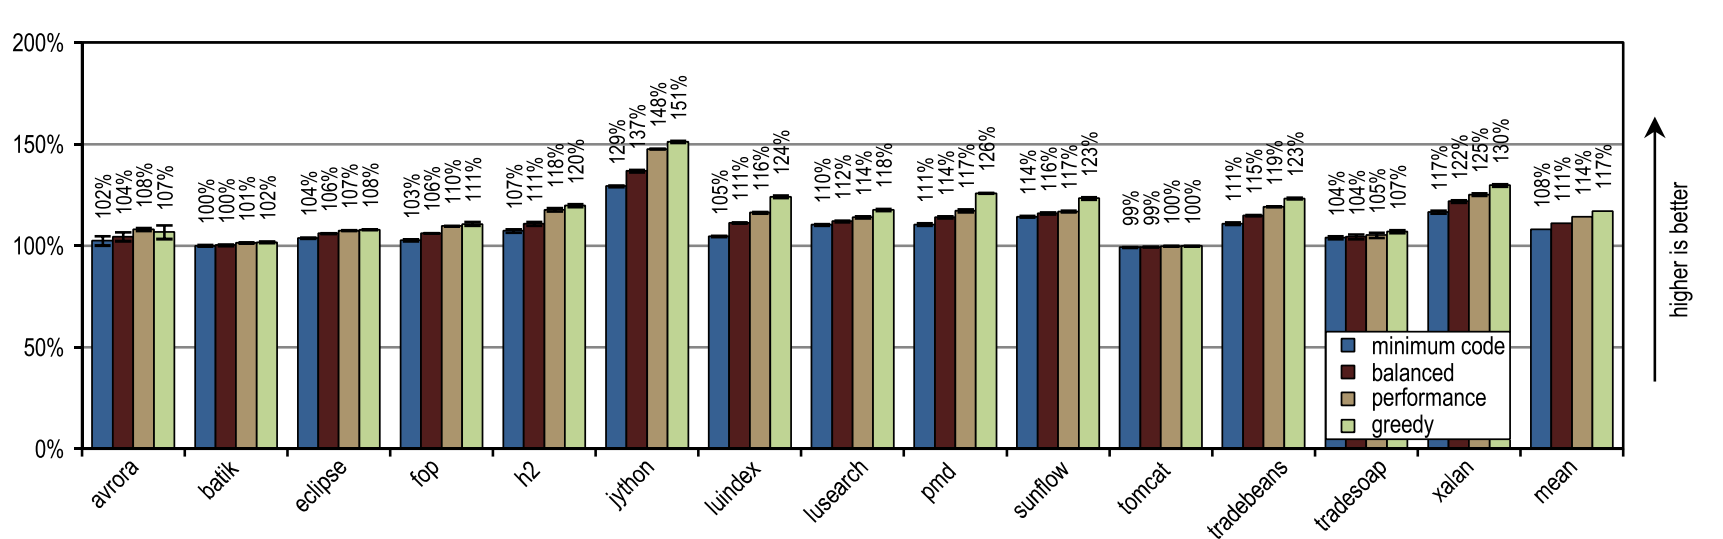
Figure 17. Peak performance in DaCapo 9.12 Bach
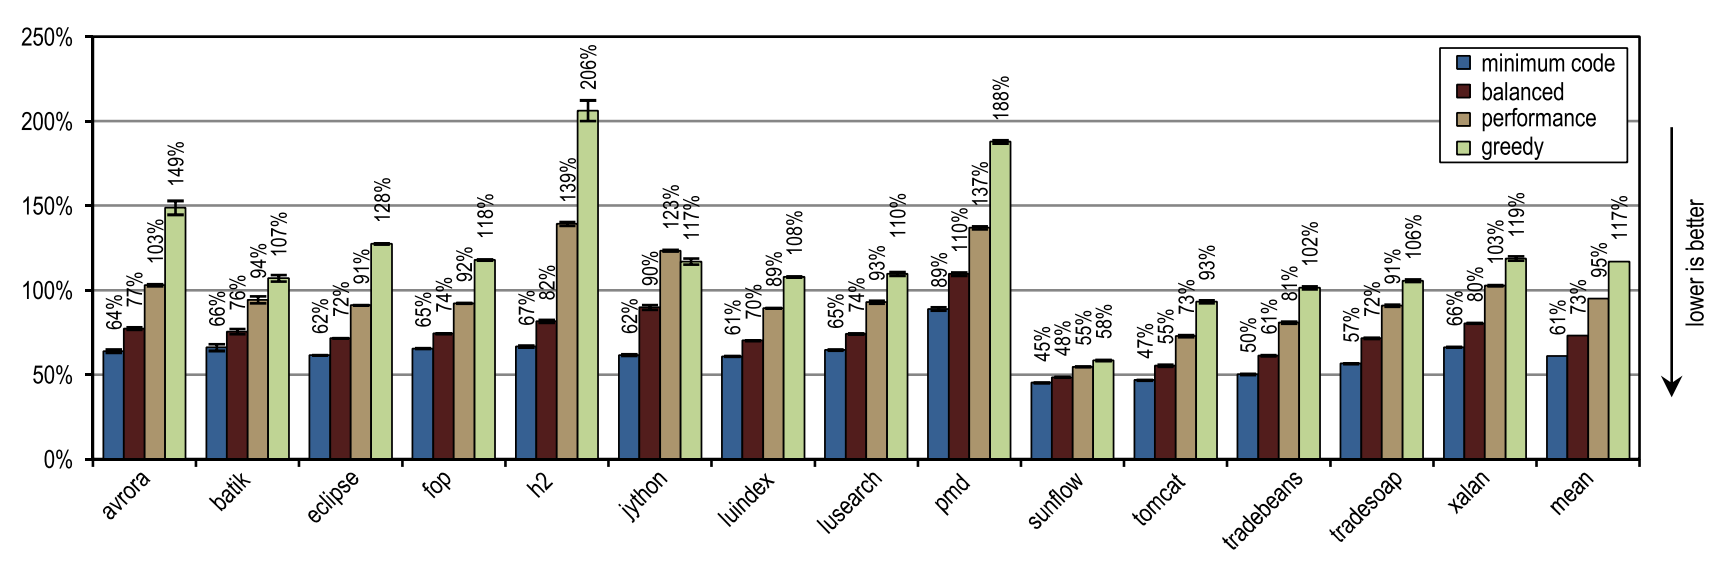
Figure 18. Number of generated machine code in DaCapo 9.12 Bach
Our configurations have the greatest advantage on the jython test, which makes a huge number of virtual calls. Our trace compiler uses recorded trace information to aggressively inline virtual methods. Here he got an increased compilation area, which resulted in high peak performance.
On average, all inlining heuristics except “greedy” generated less machine code than the HotSpot block client compiler, while also showing a higher average peak performance. One of the static heuristics, which compared the size of traces with a fixed maximum value, reached almost the same peak performance as the “minimum code” configuration, but generated more machine code. This result, which is very good for static heuristics, was achieved because the compiled trays contained only frequently used paths, by definition. But for methods without a large flow, it is enough just to compare the size of the trace with a fixed threshold value. As long as the maximum inline size continues to be low, this static heuristic will show decent results, but as soon as the maximum inline size increases, a huge amount of machine code will be generated, without any positive effect on performance.
In terms of the time needed for JIT compilation, Figure 19 shows that our tracing compiler is so highly efficient that even the most aggressive “greedy” configuration on average only requires the same compile time as the HotSpot block client compiler requires.
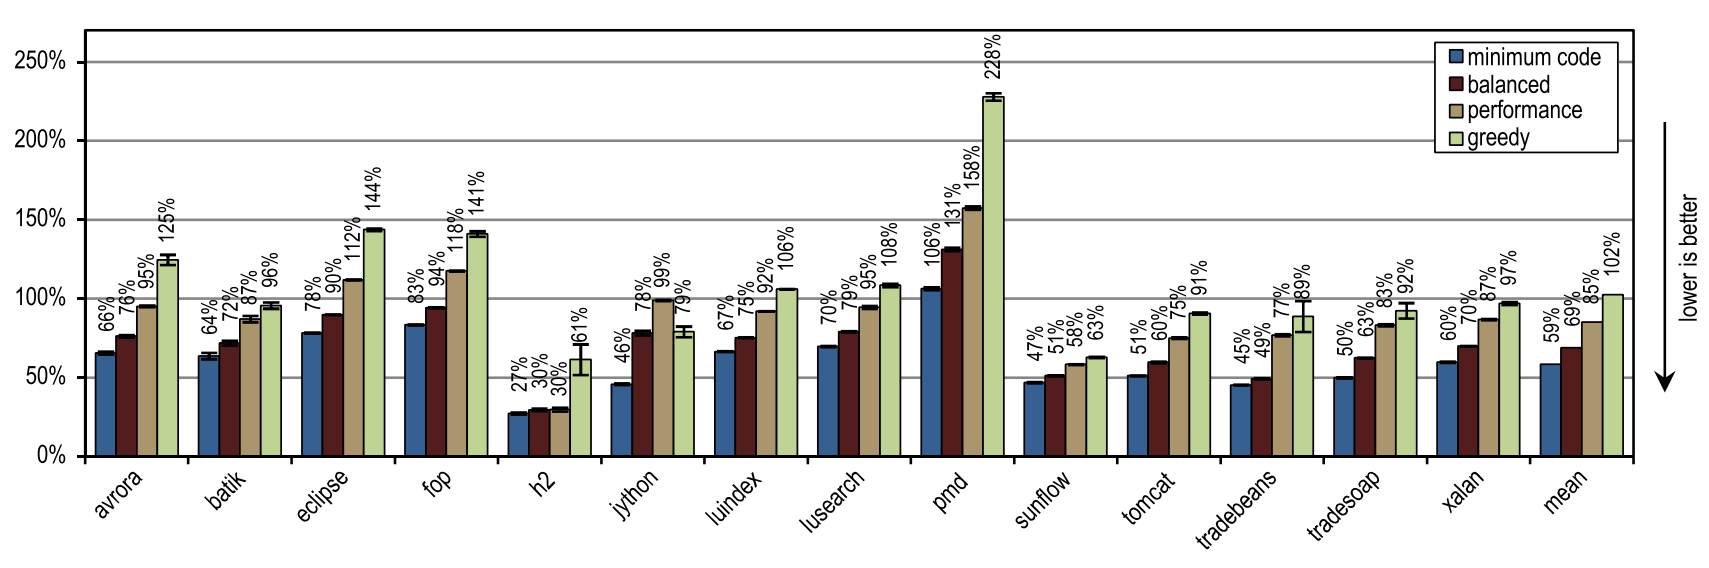
Figure 19. Compile time in DaCapo 9.12 Bach
6.4. High-level optimizations
Just like inlining methods, inlining traces is an optimization that produces a positive effect on other compiler optimizations as it increases the scope of the compilation. Figure 20 compares the contribution to peak performance of various high-level optimizations that are used both in the block client compiler HotSpot and in our tracing compiler. The optimizations marked as 1 are local optimizations that are applied directly during the parsing of bytecode, and the optimizations marked as 2 are global optimizations that run in a separate phase after the graph is built.
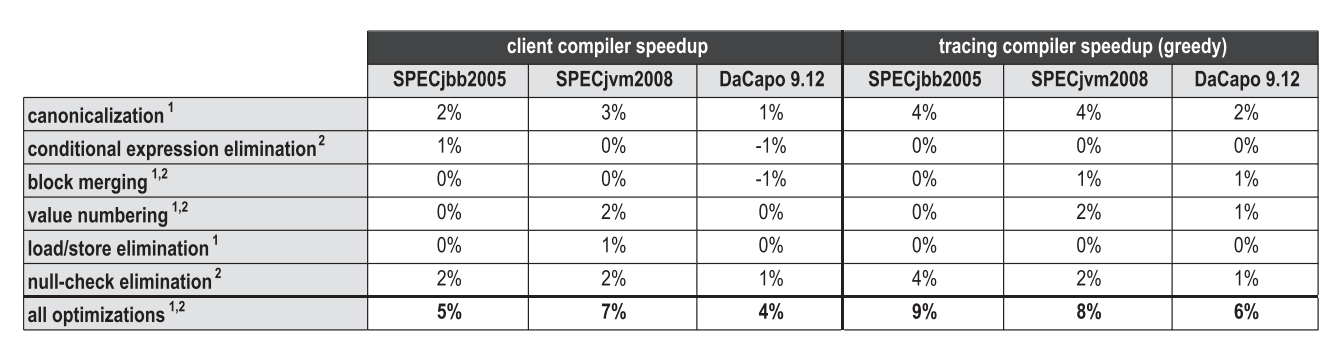
Figure 20. The effect of high-level optimizations on peak performance
In general, aggressive inlining of traces increases the compilation area, which has a positive effect on many optimizations. However, depending on the benchmarks and specific optimizations, at the same time completely different sides of the issue are revealed. For SPECjbb2005, our inlining of traces especially increased the effectiveness of the canonicalization test, as well as when testing how to perform simple optimizations, such as convolving constants or deleting dead code. But SPECjvm2008 already contained too many small and cycle-intensive tests in which our tracing compiler could not reach a much larger area of compilation. Therefore, it is unlikely that high-level optimization got there at least some advantage. On DaCapo 9.12 Bach, the performance was smeared with a thin layer over all the optimizations listed.
6.5. Server compiler
HotSpot contains two different JIT compilers that reuse most of the virtual machine infrastructure together. Our tracing compiler is built on a client compiler (client compiler), which is designed for the best time to start the application, and implements only the most basic optimizations, nevertheless giving out decent peak performance. The server compiler (server compiler) is designed for long-lived server applications, and performs much more optimizations, resulting in highly efficient code. The server compiler can use a few additional optimizations, such as removing checks of array boundaries, loop-invariant code motion (stretching out of a loop), expanding loops, and escaping analysis. Therefore, the code generated by it has the best peak performance, but it compiles 6-31 times longer (an average of 13) on the SPECjbb2005, SPECjvm2008 and DaCapo 9.12 Bach benchmarks. The server performs mostly long-lived applications, so a long compilation brings in only a small overhead compared to the total execution time.
We compared the best peak performance of the “greedy” configuration with the HotSpot server compiler, and the results are shown in Figure 21.
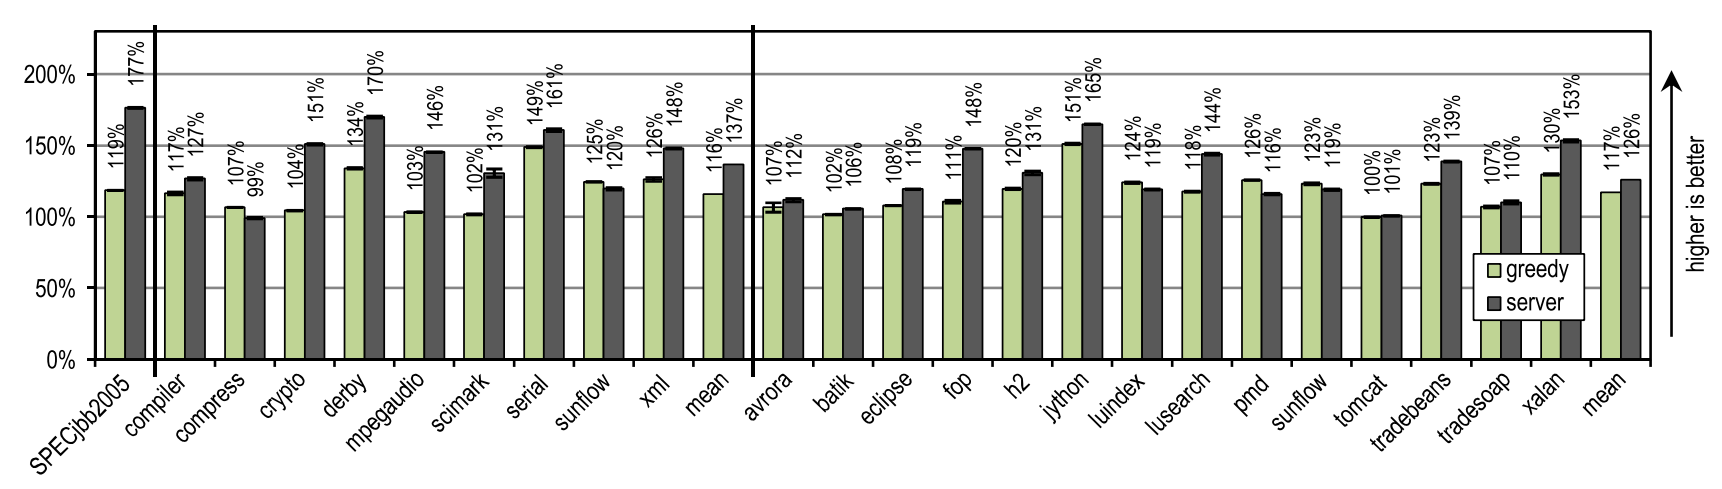
Figure 21. Peak performance in SPECjbb2005, SPECjvm2008 and DaCapo 9.12 Bach
SPECjbb2005 got a strong advantage from some optimizations, the execution of which requires a lot of time, and which the server compiler can produce, so that our tracing compiler achieved only 67% of the performance relative to it.
For SPECjvm2008, our “greedy” configuration has reached an average of 85% of the server compiler performance. This benchmark contains a lot of cycle-intensive texts, such as crypto, mpegaudio and scimark, in which the server compiler shows significantly higher peak performance because it applies deletion of checks on array boundaries and uses smart optimization of loops. However, as a result of aggressive inlining of traces, our tracing compiler overtook the server compiler on the compress and sunflow benchmarks.
On DaCapo 9.12 Bach, which contains significantly more complex tests that use far fewer cycles [14], our tracing compiler has reached an average of 93% of the peak performance of the server compiler. Despite the fact that our tracing compiler produced only the most basic optimizations, it exceeded the peak performance of the server compiler on luindex, pmd and sunflow tests. This is made possible by aggressive and context-dependent inlayning.
6.6. Launch speed
Both the HotSpot client compiler, and the server-side compiler, and our tracing JIT compiler, were all designed with multi-threaded compilation in the background. We tested startup performance in the following scenarios:
- In the first scenario, 1 application thread was executed, while the VM used up to 4 threads of the JIT compiler. Therefore, on our 4-core stand, up to 3 cores were exclusively occupied by JIT compilation.
- In the second scenario, 4 application threads were executed simultaneously with 4 threads of the JIT compiler. On our 4-core bench, the JIT compiler threads began to compete with the application threads. VM HotSpot assigns a higher priority to threads with the JIT compiler, because JIT compilation has a positive effect on launch speeds.
All presented results are normalized by the performance of the “client” configuration with a single stream of JIT compilation. We did not show any launch speed results for SPECjbb2005, since This benchmark was created to measure peak performance, showing first results only after 30 seconds, after which all configurations approach their peak performance.
For SPECjvm2008, we measured the launch speed by performing one operation for each test. Figure 23 shows that both the HotSpot client compiler and our trace compiler achieve good results in scenarios where application threads compete with compiler threads, i.e. when compile time is essential.
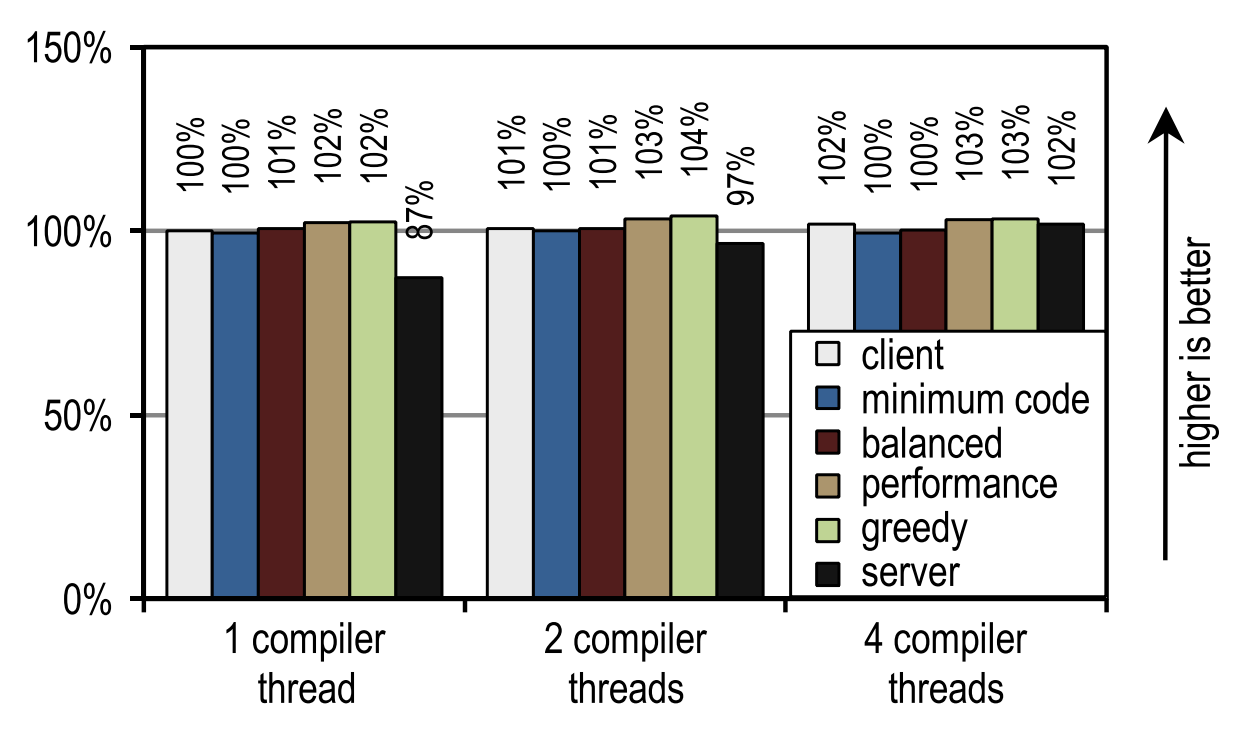
Figure 23. SPECjvm2008 startup time on 4 application threads
Figure 22 shows another scenario in which you can use kernels that would otherwise be idle for JIT compilation.
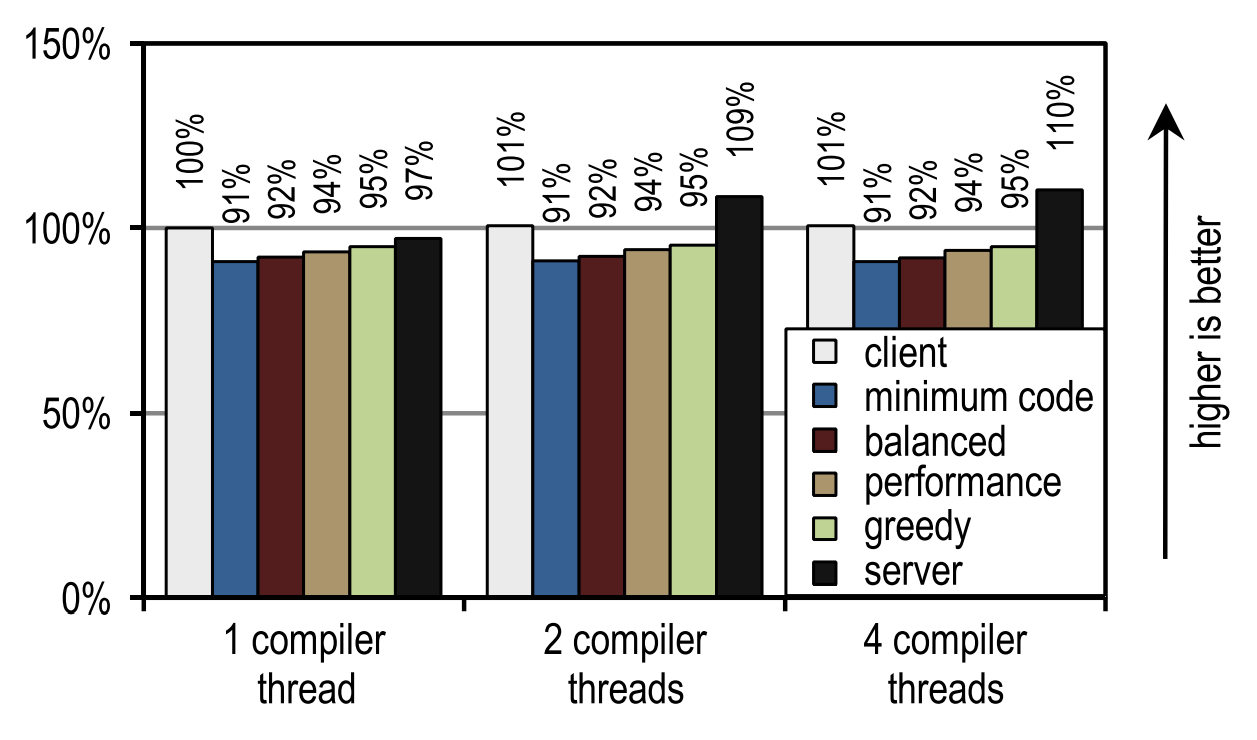
Figure 22. Startup time of SPECjvm2008 on 1 application flow
In this case, the HotSpot server compiler shows the best launch speed, because SPECjvm2008 contains several small tests that need to be compiled quite a bit and which reach their peak performance immediately after the compilation of the deepest cycle. This is an ideal case for a server-based compiler that optimizes cycles especially well, and therefore has an advantage in peak performance, which has an effect on run speed if there are idle kernels that can be shifted to compilation.
This image also shows that the number of compiler threads does not affect either the client compiler or our trace compiler, since both JIT compilers require a relatively short compile time. The server compiler requires much more time, and therefore has a strong advantage in the presence of more than one compilation thread, especially if there are idle kernels that can be used for these purposes.
For DaCapo 9.12 Bach, we measured the launch speed by running one iteration for each test. The test results are shown in Figures 24 and 25.
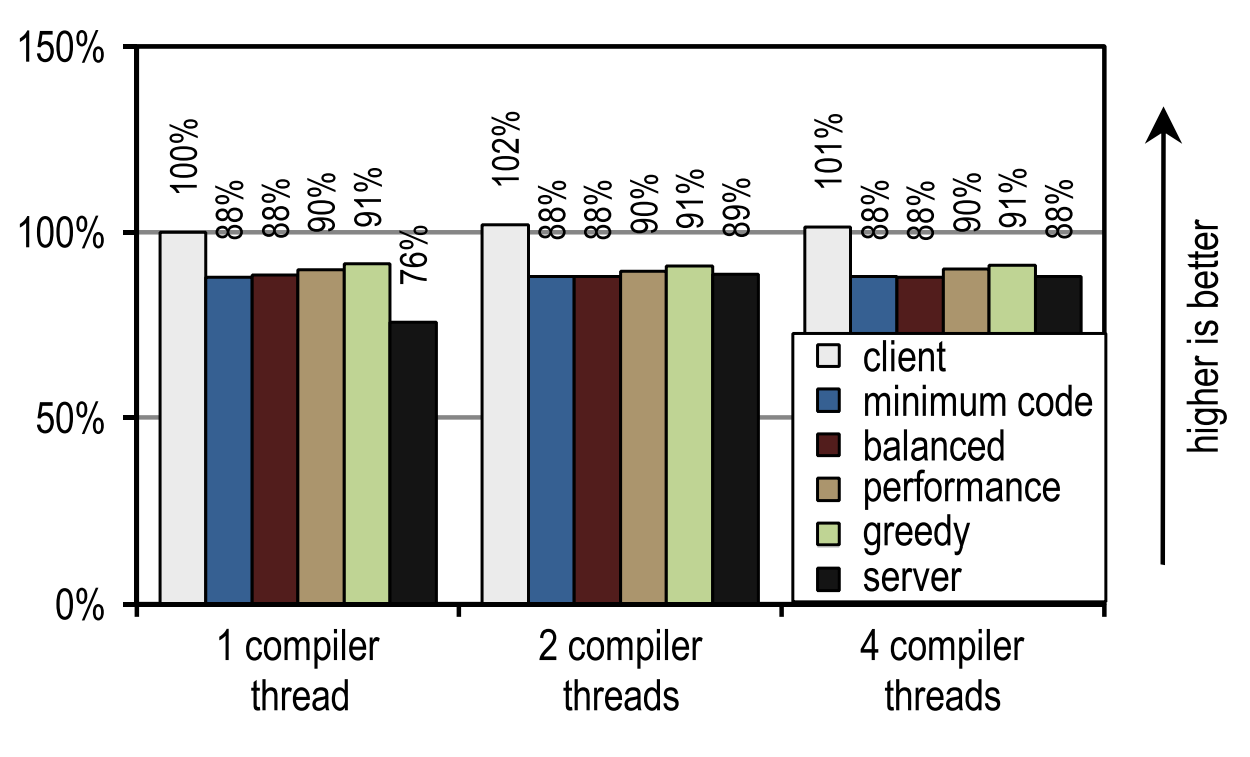
Figure 24. DaCapo 9.12 Bach start time on 1 application flow

Figure 25. DaCapo 9.12 Bach start time on 4 application threads
And again, the number of compilation threads did not affect either the client compiler or our tracing compiler, as they compile quickly.In contrast, the server compiler takes advantage of when more than one stream can be used for JIT compilation. However, several of our configurations are always faster than the server compiler, even if it uses all idle kernels for JIT compilation. This is because DaCapo 9.12 Bach is significantly more complex than the tests in SPECjvm2008 [14], so the speed of JIT compilation is the dominant factor for the speed of launching an application.
On tests from DaCapo 9.12 Bach, our trace configurations show about 10% slower startup than on the HotSpot client compiler. Despite the fact that our tracing compiler usually requires even less time for JIT compilation than the HotSpot client compiler, in this case it gives a lower launch speed because it introduces an additional overhead to record traces and deoptimization, which usually occur at the moment of launch . However, this disadvantage is outweighed by a significantly better peak performance. Unlike the client compiler HotSpot, our tracing compiler does not need idle kernels to achieve a good launch speed.
7. Related works
Bala et al. [1] implemented a trace compilation for their Dynamo systems, to optimize the flow of native instructions. Hot instruction sequences are identified by launching a binary application under the interpreter. Then, these traces are compiled, and the machine code generated from them is executed directly. The overhead of the interpretation decreases with increasing number of compiled traces, which sooner or later leads to acceleration. In contrast to them, we identify suitable anchors of traces in bytecode, and for them we use static analysis during class loading. We limit individual traces to a depth of one method by associating recorded traces to preserve context-sensitive information when passing through the method boundary. This allows us to postpone the decision about the need for inlining until compile time,instead of doing it directly while recording.
Rogers [22] implemented such a JIT compiler for Java, in which frequently executed base blocks are noted and compiled. When related blocks that can stretch across multiple methods are performed quite often, they are grouped and optimized as one entity. In comparison with block compilation, less bytecode is compiled, up to 18%. Our system, however, records and compiles traces, and uses context-sensitive inlayning of traces to increase peak performance, while at the same time generating a very modest amount of machine code.
The following approach is implemented in a variety of trace compilation options for Java [2,11,12,18]. However, all these approaches have in common - traces can be stretched by several methods, and therefore in-lining must be done while recording traces. In contrast, we assume that one method is the maximum possible area for capturing a trace, and binding is used to save information between traces. This allows you to postpone the decision about the need for inlining until compilation time, that is, until much more useful information is available. Therefore, our inlining is more legible, and uses simple heuristics, which lead to an increase in peak performance and fewer generated machine code.
Gal et al. [11,12] implemented a trace compiler on hardware limited in resources. Traces are run on frequently executed reverse brunch targets, and on the side exits of already existing treys. Any trace can be stretched by several methods, so inlineing occurs during recording. After recording a trace, it is compiled into machine code and associated with the rest of the compiled treys, forming a tree-like structure. This simple structure of compiled traces simplifies many optimizations, but can lead to excessive tail duplication and bloatting of code. A similar approach is used in Dalvik VM [4,6] in Android. In contrast, before compiling we merge individual traces into a graph graph, and thus avoid unnecessary duplication.
Bebenita et al. [2] implemented a trace compilation for Maxine VM. Maxine uses the base JIT compiler instead of the interpreter for initial executions. This basic JIT compiler is modified to generate the instrumentation used to write traces. Even before the start of the JIT compilation, the recorded traces are merged into “regions of traces”, which have an explicit flow of control over the merge points. This allows you to circumvent unnecessary tail duplication. As a result of various loop optimizations, the JIT compiler achieves superb acceleration on tests that use loops intensively. However, it works much worse on compiling methods in tests where cycles are used less frequently. Our work is complementary to their approach, as it concentrates on complex applications that rarely use loops, such as DaCapo 9.12 Bach jython. In our tracing compiler, we have achieved excellent acceleration for these applications, but at the same time all tests with cycles showed very little acceleration, because our compiler does not perform any intelligent cycle optimizations yet.
Inoue et al. [18] added a tracing JIT compiler to the IBM J9 / TR JVM, modifying the block JIT compiler. They record linear and cyclic traces without any external merge points, and compile them into optimized machine code. In terms of peak performance, their trace compiler achieves the performance of a similarly optimized block JIT compiler. Wu et al. [28] expanded this work by avoiding short-lived traces and unnecessary duplication. Although this does not affect peak performance, it reduces both the amount of generated machine code and the compile time. We also base our work on the existing industrial quality JVM, but limit individual traces to a depth of one method. Therefore, we can defer the inlining decision until compile time,which increases peak performance.
Bradel and Abdelrahman [5] used traces to inline the methods in Jikes RVM. Traces are recorded using an offline system with feedback. Then, frequently executed call sites are identified in already recorded traces, and this information is used to inline the methods. They conducted tests on benchmarks SPECjvm98 and Java Grande, which showed not only a 10% increase in performance, but also an increase in the amount of generated machine code by 47%. Our system records traces during execution on the interpreter, after which it compiles and inlines only those parts of the methods through which the traces passed. This increases peak performance and can reduce the amount of generated machine code.
Hazelwood and Grove [16] implemented context-sensitive in-blocking in a block compiler. Sampling using a timer and recording call information is used to decide the inlining at compile time. The number of generated code and compile time fell by 10% with no change in performance. In our system, recorded traces contain even more detailed context-sensitive information. Depending on the inlining heuristics, this increases either peak performance or reduces the amount of generated machine code.
Inlining methods is a well-researched issue that is often explored in the relevant literature. Accordingly, the rest of the work focuses on the inlining techniques of individual sections of the methods rather than inline them entirely, and this is close to our work. Nevertheless, these methods are complementary to the compilation of traces, since parts of the methods are explicitly excluded from them, while in our country the number of generated machine code is achieved using the trace record.
Partial compilation of methods [9, 26] uses profile information to detect rarely performed parts of methods in order to discard them from compilation. This reduces compile time, increases startup speed, and can also have a positive effect on peak performance. Our approach is even more selective, since we record and compile only frequently executed traces. Moreover, we use the resources saved on compilation to provide more aggressive and context-sensitive inlining, which increases peak performance.
Suganuma et al. [25] implemented a compilation with regions, in which rarely performing parts of a method are thrown out of compilation using heuristics and profile information. Then, using heavy inlining methods, often executed code is grouped into one compilation block. This reduces compile time by more than 20% and increases peak performance by 5% on average on the SPECjvm98 and SPECjbb2000 benchmarks. We compile only the frequently performed parts of the methods through which the traces pass, and to increase the performance we use the inlining of these traces.
8. Conclusion
In this article, we introduced a tracing Java compiler that performs inlining during a JIT compilation, instead of, as usual, doing it during the recording of a trace. Traces are better here because they capture only the parts of the methods that are actually executed. Postponing the decision on inlining to the time of JIT compilation allows for more selective inlining of traces, since much more information is available at this point. Moreover, all of our recorded traces are context-sensitive, so we inline various parts of the methods based on the specific call points. This allows you to do more aggressive inlining traces, while generating a reasonable amount of machine code. Additionally, we suggest removing rarely executed traces before compiling to ensurethat only the most frequently executed traces will turn into machine code.
Testing on benchmarks SPECjbb2005, SPECjvm2008 and DaCapo 9.12 Bach showed that the correct inlining of traces can increase the peak performance, while generating less machine code than the inlining of methods. In addition, we also showed that inline tracing broadens the scope of compilation, increasing the efficiency of basic compiler optimizations and, over time, leading to increased peak performance.
Thanks
When creating this work, the authors were supported by the Austrian Science Fund (FWF): project number P 22493-N18. Oracle and Java are registered trademarks of Oracle and / or its affiliates. All other names may also be registered trademarks of their respective owners.
This translation would never have been made without that uplifting, which per person is provided by attending conferences like Joker and JPoint , which are organized by the JUG.RU team . Once you return home from a conference, and you realize that you must write something, too.
Links
- Bala V, Duesterwald E, Banerjia S. Dynamo: a transparent dynamic optimization system. In: Proceedings of the ACM SIGPLAN conference on programming language design and implementation. ACM Press; 2000. p. 1–12.
- Bebenita M, Chang M, Wagner G, Gal A, Wimmer C, Franz M. Trace-based compilation in execution environments without interpreters. In: Proceedings of the international conference on the principles and practice of programming in Java. ACM Press; 2010. p. 59–68.
- Blackburn SM, Garner R, Hoffman C, Khan AM, McKinley KS, Bentzur R, et al. The DaCapo benchmarks: Java benchmarking development and analysis. In: Proceedings of the ACM SIGPLAN conference on object-oriented programming systems, languages, and applications. ACM Press; 2006. p. 169–90.
- Bornstein D. Dalvik VM Internals. Presented at the Google I/O developer conference, 2008. 〈http://sites.google.com/site/io/dalvik-vm-internals〉.
- Bradel BJ, Abdelrahman TS. The use of traces for inlining in Java programs. In: Proceedings of the international workshop on languages and compilers for parallel computing, 2004. p. 179–93.
- Cheng B, Buzbee B. A JIT compiler for Android's Dalvik VM. Presented at the Google I/O developer conference, 2010. 〈http://www.google.com/events/ io/2010/sessions/jit-compiler-androids-dalvik-vm.html〉.
- Cytron R, Ferrante J, Rosen BK, Wegman MN, Zadeck FK. Efficiently computing static single assignment form and the control dependence graph. ACM Transactions on Programming Languages and Systems 1991;13(4):451–90.
- Dean J, Grove D, Chambers C. Optimization of object-oriented programs using static class hierarchy analysis. In: Proceedings of the European conference on object-oriented programming. Springer-Verlag; 1995. p. 77–101.
- Fink S, Qian F. Design, implementation and evaluation of adaptive recompilation with on-stack replacement. In: Proceedings of the international symposium on code generation and optimization. IEEE Computer Society; 2003. p. 241–52.
- Gal A, Eich B, Shaver M, Anderson D, Mandelin D, Haghighat MR, et al. Trace-based just-in-time type specialization for dynamic languages. In: Proceedings of the ACM SIGPLAN conference on programming language design and implementation. ACM Press; 2009. p. 465–78
- Gal A, Franz M. Incremental dynamic code generation with trace trees. Technical Report. Irvine, USA: Donald Bren School of Information and Computer Science, University of California; 2006
- Gal A, Probst CW, Franz M. HotpathVM: an effective JIT compiler for resource-constrained devices. In: Proceedings of the international conference on virtual execution environments. ACM Press; 2006. p. 144–53.
- R. Griesemer, Generation of virtual machine code at startup. In: OOPSLA workshop on simplicity, performance, and portability in virtual machine design. Sun Microsystems, Inc.; 1999
- Häubl C, Mössenböck H. Trace-based compilation for the Java HotSpot virtual machine. In: Proceedings of the international conference on the principles and practice of programming in Java. ACM Press; 2011. p. 129–38.
- Häubl C, Wimmer C, Mössenböck H. Evaluation of trace inlining heuristics for Java. In: Proceedings of the ACM symposium on applied computing. ACM Press; 2012. p. 1871–6.
- Hazelwood K, Grove D. Adaptive online context-sensitive inlining. In: Proceedings of the international symposium on code generation and optimization. IEEE Computer Society; 2003. p. 253–64.
- Hölzle U, Chambers C, Ungar D. Debugging optimized code with dynamic deoptimization. In: Proceedings of the ACM SIGPLAN conference on programming language design and implementation. ACM Press; 1992. p. 32–43
- Inoue H, Hayashizaki H, Wu P, Nakatani T. A trace-based Java JIT compiler retrofitted from a method-based compiler. In: Proceedings of the international symposium on code generation and optimization. IEEE Computer Society; 2011. p. 246–56
- Kotzmann T, Wimmer C, Mössenböck H, Rodriguez T, Russell K, Cox D. Design of the Java HotSpot client compiler for Java 6. ACM Transactions on Architecture and Code Optimization 2008;5(1):7.
- Oracle corporation. Java platform, standard edition 8 developer preview releases; 2011 〈http://jdk8.java.net/download.html〉
- Paleczny M, Vick C, Click C. The Java HotSpot server compiler. In: Proceedings of the Java virtual machine research and technology symposium. USENIX, 2001. p. 1–12.
- Rogers I. Optimising Java programs through basic block dynamic compilation. PhD thesis. Department of Computer Science, University of Manchester; 2002.
- Standard Performance Evaluation Corporation. The SPECjbb2005 Benchmark; 2005 〈http://www.spec.org/jbb2005/〉.
- Standard Performance Evaluation Corporation. The SPECjvm2008 benchmarks; 2008 〈http://www.spec.org/jvm2008/〉.
- Suganuma T, Yasue T, Nakatani T. A region-based compilation technique for dynamic compilers. ACM Transactions on Programming Languages and Systems 2006;28:134–74.
- Whaley J. Partial method compilation using dynamic profile information. SIGPLAN Notices 2001;36:166–79
- Wimmer C, Mössenböck H. Optimized interval splitting in a linear scan register allocator. In: Proceedings of the ACM/USENIX international conference on virtual execution environments. ACM Press; 2005. p. 132–41.
- Wu P, Hayashizaki H, Inoue H, Nakatani T. Reducing trace selection footprint for large-scale java applications without performance loss. In: Proceedings of the ACM international conference on object oriented programming systems languages and applications. ACM Press; 2011. p. 789–804.
The authors
Christian Häubl is a PhD student at Johannes Kepler University Linz in Austria, working on tracing Java compilers. He holds a Computer Science and Networks and Security degree, both from Johannes Kepler University Linz. He is interested in research in areas related to compilation and virtual machines, but sometimes switches to security and web applications.
Christian wimmer- Researcher at Oracle Labs, worked on MaxineVM, on the Graal compiler, and on other projects that are related to dynamic compilation and optimizations. His research interests are in compilers, virtual machines, and secure systems for component software architectures. He received his PhD in Computer Science (supervisor: Professor Hanspeter Mössenböck) at Johannes Kepler University Linz. Before joining Oracle, he was a doctoral candidate at the Department of Computer Science at the University of California. Worked with Professor Michael Franz at the Secure Systems and Software Laboratory on compiler optimizations, dynamic programming languages, and language security.
Hanspeter Mössenböck- Professor of Computer Science at Johannes Kepler University Linz and Head of the Christian Doppler Laboratory for Automated Software Engineering. He received his PhD CS at the University of Linz in 1987, was an assistant professor at ETH Zurich from 1988 to 1994, working with Professor Nicklaus Wirth on the Oberon system. Current research interests include programming languages and compilers, as well as object-oriented and component programming. He is the author of several books on learning programming.
Translators
Oleg Chirukhin - at the time of writing this text, he is working as an architect in the company Sberbank-Technologies, developing architecture for automated business process management systems. Before moving to Sberbank-Technologies, he participated in the development of several state information systems, including state services and the electronic medical map, as well as in the development of online games. Current research interests include virtual machines, compilers, and programming languages.
Source: https://habr.com/ru/post/329120/
All Articles