Choosing a DBMS for storing time series

Pavel Filonov ( Kaspersky Lab )
Today we will talk about the storage of time series. I will try to tell you what approaches I used to try to throw out as much of my subjectivity as possible, replace it with something more objective, and leave my subjective view somewhere right at the end.
Almost always lately in my practice, I notice that it is almost never necessary to invent something new to solve standard problems. Almost always you just need to choose - how to choose yogurt in the store. You come, there is a shelf, there these rows are all forced, and you need to decide which one to choose: the usual, try a new one, either the most delicious or the most useful. And they are all bright, beautiful, with advertising. All one another is better.
')
The great ones have long said that this is a big problem. The fact that these bright curtains can slightly overshadow our choice.
How can we try? Anyway, honestly, objectively completely fail. There will always be a subjectivity in the choice, otherwise it can not be. But, maybe, it is possible to level this subjectivism somehow? Maybe, hold in some kind of controlled framework to get something out of this?
Today I will try to tell you what approaches I used to try to throw out as much of my subjectivity as possible, replace it with something more objective, and leave my subjective view somewhere right at the end.
Before this, however, I want to first talk a little about the task that stood. In my opinion, an understanding of the real problem, which in some sense can be touched - it always clarifies the situation. It allows you to better understand those or other decisions that have been made. Therefore, I will start with John McClain.

This is John - my hero. Who in childhood, when he watched him beating terrorists, wanted to be the same as John McClain? Not all, yes, I see. So I really wanted to!
I watched as he beat the terrorists in the first part, in the second, in the third. And I began to think, quite recently, that I somehow resembled him. It's hard to see similarities, I understand. Probably not external, but a little bit - what we begin to do with him. In particular, in the fourth part of his adventures, he fought not just terrorists, he fought very harmful cyber-terrorists, who not only tried to seize and terrorize someone, who tried to hack gas stations, tried to break power lines, who tried to rebuild traffic lights in a big city. Can you imagine what will happen if the traffic lights in Moscow are chaotically rebuilt? Perhaps nothing will change, but there is a suspicion that you should not do this right away.
The film was released in 2007, he was a clownish, humorous. What are these cyber-terrorists, what is the management of power plants, what kind of destruction?
The problem arose a little later, after the release of the film, around 2010, when it seems that the film was watched by many. Some even penetrated. Unfortunately, not all of those who have penetrated are good people. In particular, the name that sounds in the middle is one of the quite popular malware that was discovered about six years ago, which had a lot of skills, a lot of appointments.

One of his most unpleasant assignments was hacking of automated process control systems (APCS) and causing not only commercial harm by stealing information or erasing something, but reprogramming technological processes to cause physical harm. In particular, because of his actions, the uranium enrichment program, in my opinion, in Iran, was thrown back several years ago. He simply disabled part of the enrichment plants. The situation, unfortunately, was repeated. Several cases have been officially registered. Reports were created that confirmed that these plants failed not on their own, but directly due to the testing of some attacks, targeted attacks on the process control system.
This task began to lead to a search for a solution. This is a problem, many believe that this is a problem. The process control system is not very good with safety. It is necessary to introduce new security elements there and try to protect these objects. What kind of objects? Here, so that some image was in front of my eyes, I just took some picture:

Some small factory, most likely an oil refinery, which does a very important and useful thing. And we need to try to protect it from the threats that may be viewed from the cyber side. This is a difficult task, it is very multi-layered, I would say.
You can look at this little factory from different angles. For example, you can look at it from the point of view of network behavior: you can draw a network topology, look who interacts with whom, who you can interact with, who you cannot. This is one solution layer.
You can go down below and watch how end stations behave, what programs are running on them, these are allowed programs or prohibited programs. You can follow this layer.
I work in the department, which is still on another layer, which monitors how the technological process itself works, how the relays turn on, the conveyors work, the tanks heat up, and the fluid runs through the pipelines. And we, for example, look at this object like this.

Any technological process, in fact, is a dynamic system that changes over time. It is multidimensional, it has many characteristics. Here I drew five rows, for an average object there may be thousands, maybe tens of thousands. This is just some kind of artificial example to present what our data will look like with small eyes.
Of course, the main task is processing on the stream. Because the historical data on hacking is interesting, but not so. But in order to implement it, this data not only needs to be processed, but it is also desirable to save somewhere. For historical investigations, for forensic. For example, it is very important for us to save large amounts of historical data for training our online processing systems.
From here a specific technical problem begins to arise. If we have such data here (I’ll tell about the models a little bit), and we have their characteristics with which these data enter the system, how we can rationally and efficiently organize the storage subsystem to which we will access, in order to conduct historical analysis, or request for our specific research? So we come to the problem.
Before the problem, however, a little bit about the data schema, so that you could imagine what it was all about. Already in such a little specific language.
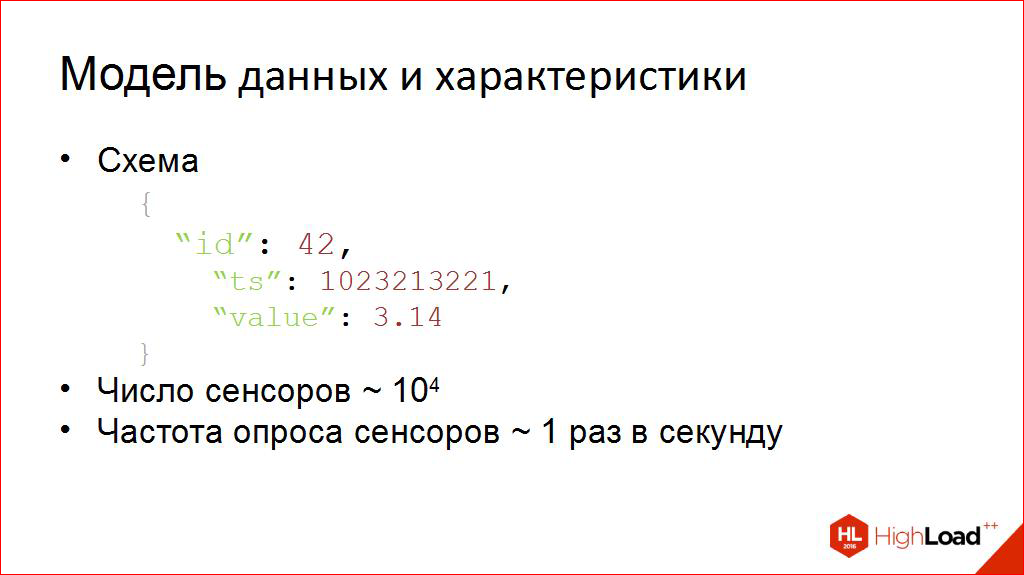
One point in the same row is usually characterized by three numbers: this is its certain identifier (channel number), 42 is temperature, 14 is pressure, 13 is on / off relay (possible). The moment in time when something changed in this dynamic system, and the value at which it changed. The value can be real-valued, it can be integer, it can be logical. Substantial describes them all.
A little bit about the characteristics, so that it can be seen that, probably, it has something to do with the subject of the conference. There is not so easy with the volumes.
Unfortunately, for an average object the number of such rows is of the order of tens of thousands, in exceptional cases it can be an order of magnitude more. With intensity, thank God, a little bit better. Usually sensor values are collected on average once a second. Maybe a little more, maybe a little slower, but according to real objects, the characteristics are approximately as follows.
And we are starting a little bit already trying to imagine the volumes in which we have to work. This is a very important point, because, in fact, from these numbers you can begin to derive something without which I, for example, feel very uncomfortable - without non-functional requirements.
When they sometimes say: “Make it quick and good,” and I don’t understand such words. I begin to torture a person: “What is“ fast ”? And what is “good”? And what is your data? And how many volumes do you have? And what are your intensity? ". Only after this check list has been passed, and the main points are known, can I begin to try at least to imagine solutions.

There, however, is not so simple, there are many solutions, there is absolutely not one. I am sure that each of you can calmly now add five more of his favorite DBMS to this list. Of course, everyone here simply does not fit. They are different. Some work well in one case, some work better in another, some probably work well for the task I was talking about.
But which ones? How to understand? How to choose? This is a big problem. I come across it often and constantly. It is very rarely necessary to invent a new one, almost always you just need to choose wisely somehow from this set.
There are several approaches to this choice. First, I called it the “non-engineering” approach.
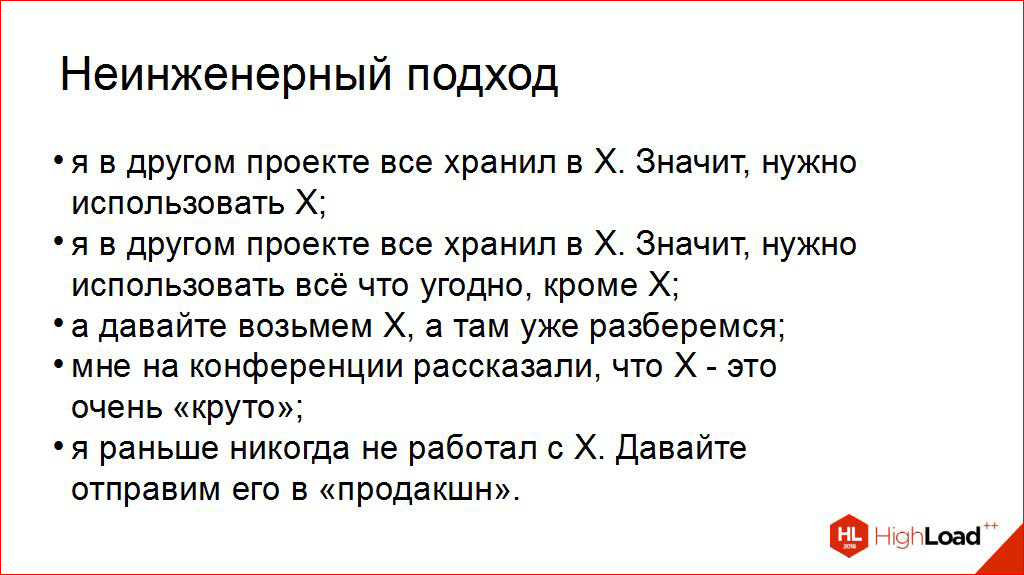
Unfortunately, or maybe I do not know, fortunately, he is sometimes promoted. What are some examples of non-engineering approach?
- For example, like this - everyone kept it in X, let's use it here too. It doesn't matter that the task is different, the subject area is different - we know how X works.
- Or here is such a sick way, when "We used it there, do not do this, in any case, please." I met such people.
- The third is my favorite. Yes, I feel many with me in solidarity. But dangerous, slightly dangerous, but loved.
- We are at the conference with you, here they talk about databases. I probably do not remember the conference, where they talk more about databases than here. And of course, the first thing - people come after, the next day to work, they say: “We were told about such a thing, let's try it!”.
- I also like this one very much - an article has been published somewhere, everything is great there: the graphs are simply exponential, they fly to the top, the dollar is drawn at the top, everyone is happy. Let's choose this one.
Of course, the slide is humorous, but let's be honest - and who can now stand up bravely, introduce themselves and say that "indeed, I am such and such, and I used the non-engineering approach before"?
And can I ask someone from the assistants? Please mikrofonchik.
Please introduce yourself and say it. Bolder!
Comment from the audience: I am Vladimir Myasnikov. We used the approach "Let's take X, and there we'll figure it out."
Thank you very much, Vladimir! Let's applaud!
By the way, we posted in open access the video of the last five years of the conference of developers of high-loaded systems HighLoad ++ . Watch, learn, share and subscribe to the YouTube channel .
It is like that part of the therapy. Do you know, yes? To deal with a problem, you must first realize it and admit to yourself. Vladimir is clearly a brave man, and many here are brave, they are ready to admit that this is a bad approach. Maybe there is another?

Let's call it "engineering." Probably a little more complicated. Maybe it is even somehow structured and decomposed. I tried my decomposition, it does not claim to be common. Let me tell you point by point and, in fact, this will be, at the same time, the content of the further part of the report.
- First, a good read after all. What is what has appeared in recent years? Because I am waiting with fear when the article “10 new databases that you have to learn this week” comes to me at Fidley. I feel that sooner or later this will happen. Everything appears there at such a speed that it is difficult to keep pace with the follow-up, and it is necessary to get acquainted constantly with literature. Including, by what you are listening to at the conference: who tried what, who is pleased with what, who is dissatisfied with what. And so we spread our experience to other people.
- Generally speaking, it would be nice to understand if we choose, then by what criteria - price, speed, scalability? They need to decide. Select by all criteria is not possible. Most likely, your non-functional requirements can tell you which of the criteria in this task, and only in this task, you should consider first and which in the second.
- This is the most interesting, such a long-awaited item: you must choose who to compare. There must be competitors. Unfortunately, it is difficult to compare all. There must be some sort of preliminary selection. When, even before you reach specific numbers, you realize that this seems to be suitable as a solution, and this cannot. Or you just understand that you do not have enough strength to measure everything, and then you need to choose what seems to be the most adequate for now. But, of course, this list is unlikely to consist of one item, hardly even two.
- About the fourth point, I will say, probably the most. If we choose what we measure and even choose whom we measure, then the question is very thin and very interesting: “How do we do it?”. Because even if you take two people, and they choose that they measure the same thing and the same people, they can do it completely differently, and the numbers can turn out very different. Therefore, somewhere, maybe I will go into extra nuances, but, in my opinion, this is the most interesting part: how they measured how to reproduce it in one way or another. Here we devote a lot of time to this.
- This is quite a hard part, because then it must be implemented. She herself is so long, it requires some labor, work. We will talk about this later. In general, to conduct this testing, for each of the contestants to understand which tsiferki correspond to him. This needs to be done by hand, even writing code. Oh my God!
- By the way, sometimes the results are not enough. If you bring a beautiful sign with the numbers "your" and say: "Here is the result." They will say: “Well, good. So what? ”There should be an analysis. Numbers are not enough. Always behind the numbers should be normal words that explain them, they reveal them, trying to convey the meaning of this result, and not just leave it in the form of bare numbers, saying: "Everything is clear."
- And in the end, some specific recommendations are required. Moreover, they can hardly be very strict, that "only this will fit all." In fact, of course, there may be several solutions. It must be said, perhaps, with what degree of confidence this or that solution will do. For example, in the form of a report and specific recommendations.
- Complicated approach. When I wrote it down, more than three points are generally difficult, but here they turned out to be as many as eight. This approach, I see it, but very rarely, and I understand why. He is laborious. Indeed, it is necessary to spend time on this, man-hours, if you like, some kind of effort, although it would seem: "Let's take X, and then we'll figure it out further."
But here, if we waste time, we do it for some reason. Somewhere we want to save it. For example, I once realized that testing is very time saving on parsing "bugs". Maybe here we can save time? This is possible.
Who faced the situation when he had to change the database from release to release in production? Why, few people have encountered. And who liked it? There are no hands at all. It is very dangerous.
If the choice was made unreasonable and blind, you have the risk of not getting into the nonfunctional requirements you need. Especially if they start to change. Who have they changed in their time? Yes, this is also possible. Therefore, these labor costs can be paid off, in the future, of course. That is, it is difficult to predict how much they will pay you back, but believe me, sometimes it's worth it.
Here is our plan. Let's go for it. Let's start with a critical review of the literature.
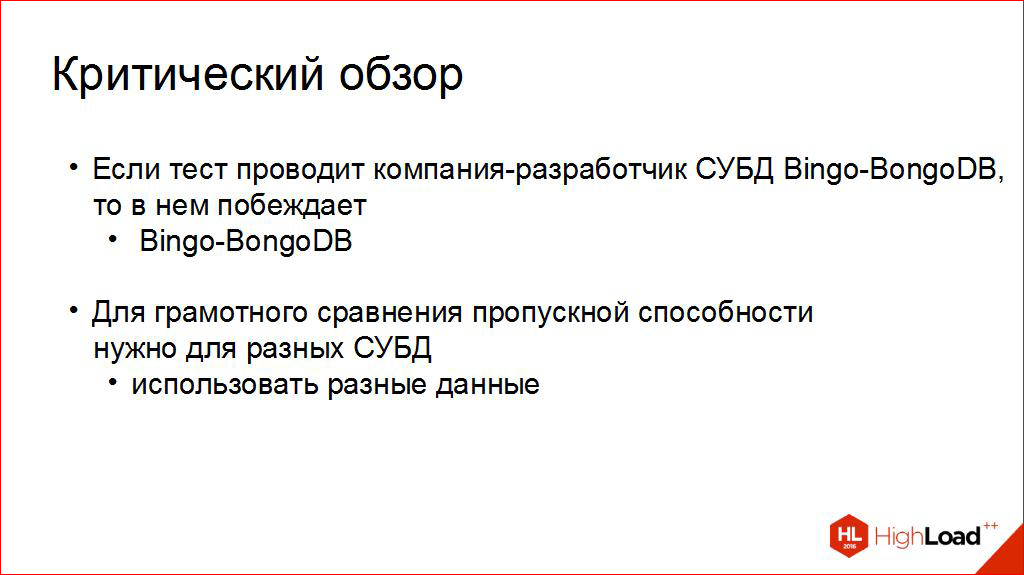
I basically tell you what I didn’t like when I started reading. Some specific points. For example, a lot of database comparisons for a particular task are carried out - who do you think? - The developers of these databases themselves.
I noticed one hundred percent correlation, really one hundred percent. If the developer of the base Bingo-Bongo, which I had just invented, makes comparisons, then there wins - who knows the correct answer? - Bingo-BongoDB wins there. Yes, always. Amazing It doesn't matter what kind of comparison it is. I am confused by this result. I am not ready to immediately trust him just like that. In general, I am a very gullible person in life, but when I put on the engineer cap, I immediately begin to doubt very much in many ways. For example, here in such reviews.
Another interesting point that made me laugh, but I saw him often. What do we need to do to properly compare different DBMS with each other? Of course, take different data. The funny thing is, when one article refers to another article, it says: “That's where they got that number, and we got that number. They had the same data there - we have other data. They have one server - we have other servers. ” Actually, what are you comparing? Also not very nice.
There are more good sources, at the end of the slides for those who want will be a link to what I liked just.
And most of the authors say that if you really want to choose correctly, solve your problem, do not look at what data they have and what load profiles they have. Take your load profiles, take your data and measure only on them. Only these figures, and not 100% certainty, will give you an idea of how this will work further, for a long time. Why not 100%? Most likely, if your system should work for two years, you are unlikely to test it for two years first. Your testing time will be more limited. Therefore, there is still danger, but of course, it is greatly reduced.
Let's go about the criteria. What will we compare?

I chose the most important for my task. There are not all criteria by which a comparison can be made. I will not say what I have dropped. Let me, I rather leave it to additional questions: "Why do not you compare according to this criterion?" I will tell you about what I am comparing.
- For example, write bandwidth. It's important for me. I need to keep up with it to persist, fall onto the disk and withstand the loads that I have registered. But the question turned out to be very difficult, incredibly difficult. When I see an article somewhere where they say: “Bandwidth is so much,” I begin to doubt - and under what conditions was it tested? Because, in my experience, there is always a dependency. For example, it varies with the size of the "batch" (how many in the data packet at a time we are trying to write there). It varies with the number of customers who write to the database. It is even slightly different if we write to the database for a long time. For example, if we write 5 minutes, maybe one digit, and if 12 hours, then there may appear other numbers that do not always look like what is usually called “peak performance”. And it seems that this criterion in itself is not very trivial. It can already be viewed from different angles. ( ), .
- , . , , . - . , . — , . , , . ? , : , , , . , . , . , , ? , « ».
- — . , , . , . , , , . , . , , — , — , - . , . - , , . .
Here are our criteria, so I’ll talk about them first. And we start with the bandwidth, we still have HighLoad. This is one of the most interesting characteristics, not so trivial, though, as it turns out.
Before this, our "contestants". We will compare these four:

Here I immediately want to describe one interesting point, which, most likely, many of you will emerge. Why do I compare specialized solutions (and this is OpenTSDB and InfluxDB - they are “we are only a time series, this is our patrimony, we can’t practically keep anything else”) with a general-purpose DBMS? After all, it would seem, most likely the answer will be obvious, that in many characteristics the specialized ones are better.
The answer here is, in fact, I will immediately give it: on the one hand, yes, a specialized solution is good, but what if you have all the solutions for non-functional requirements? Should you fence the zoo of different systems? After all, most likely, you will store not only the time series, most likely, you still have some kind of metadata and some richer model data. Most likely, they will also need to be put somewhere. What if you don’t produce a zoo of specialized solutions, but show that one solution copes with this and that? Therefore, it was interesting for me to take solutions that, in principle, are already being used. In order to see how well they cope with this situation. In order, as a last resort, not to produce a zoo.
Who happened to have multiple databases in the project? Who had two? Who has three? Who has four? Who has five? There are a few people left ... This is also not very good. Yes, colleagues agree with me. Thank. It fits into good requirements, but for administration it is not a very convenient thing.
Here we will talk about these four.
A little bit tsiferok, where without numbers. What we compare to. Here, too, this slide is very important, because I want to insert such a disclaimer, and that you understand it.
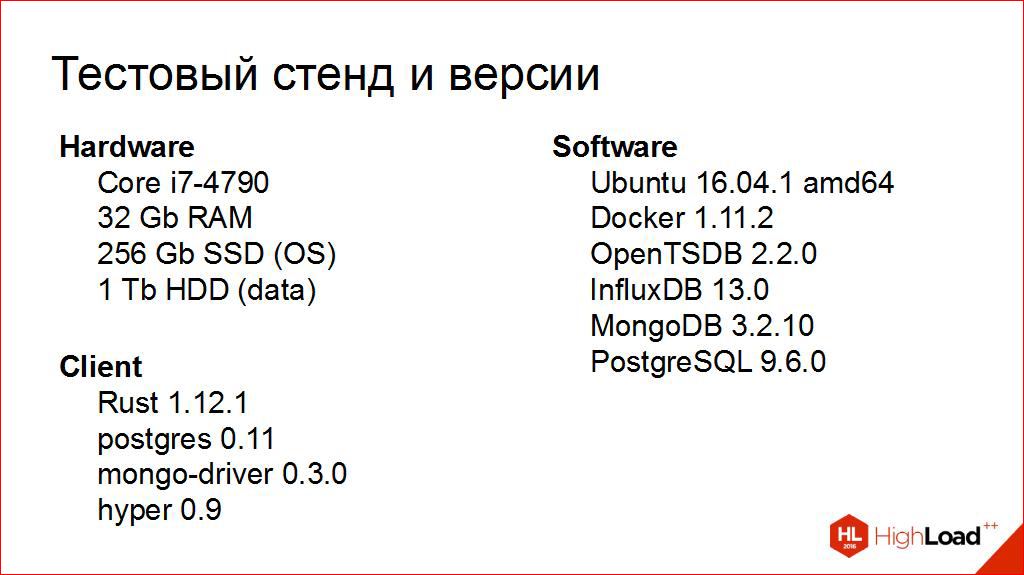
I will measure now not a DBMS. I will measure them in a whole bundle, that is, I automatically measure, as it were, the client. Because I don’t, frankly, wonder how the DBMS works, I don’t sell them. I wonder how they will work precisely in my task, in my infrastructure, with my clients, with something close to reality.
Therefore, keep in mind - and this is a very important point - that the numbers that I will give refer to non-pure DBMS, they still attract everything described here. The fact that there is a Docker (where now without it is very convenient, I like it). There are specific clients that have one very interesting feature - they have not yet very optimized storage drivers, so in some places there may be problems with the drivers. And this is the reality of our world - not every programming language has ideal drivers for all the DBMS that we need. Sometimes in these drivers - oh my goodness! - there are bugs, sometimes these performance bugs, and with this we also need to cope and understand this.
And now to the most interesting.

The graphics are gone. About bandwidth is a very complicated thing. For a long time I tried to understand what it is, what is this value? Is this a number? It is addiction? This, God forbid, integral? Thank God, it turned out, it seems, no.
At first, I tried to understand first what I would measure and how I would do it. Let me try to clarify what the blue graph is and how it is built. This is about testing methods.
I have a “volume knob”, very simple - how much I will try to record. I actually have two “pens” there: how many sensors do I have in the system, and with what frequency do they log their values. For example, I can “twist” the number of sensors by fixing that each of them logs its values every second. And then I begin to “twist the handle” on the horizontal axis, my supposedly expected throughput, that is, 20 thousand - these are 20 thousand sensors, and each of them logs values every second.
What is the vertical axis, where is the blue graph actually postponed? We take this “voltmeter” neat and begin to measure: how much have we really recorded in the DBMS? And it turns out, too, it can be done in different ways and cunning! For example, here each point (well, they, of course, with an approximation) is obtained in the following way: we start with such a load for five minutes, log each second how much we recorded at that second, build a histogram of the distribution of these points and choose the median. Very cool, I like it, this is such a bandwidth, to the left of which there is exactly half of these points that we measured. That is, it guarantees us that at least half the time we wrote at such a speed and not less than it.
Sometimes you can choose the average, but here it will give you a smaller number. Why? Average, just averaging, it is sensitive to emissions. What if you accidentally had a hard disk there for some amount of time, or someone else connected to your system and did something for a couple of seconds? Then you may have a few failures for a few seconds. Average - it is very sensitive to these failures. I did not draw it here, but the average is always less, and in this case, in my opinion, it does not show approximately the real state of affairs. Median shows better. I understand what it means. At least half the time we will write "no slower than so much."
We begin to be selected to the most interesting, you probably paid attention. Here is this flat line - level. That is, we are turning the “volume knob”, but “louder” is not becoming. It would seem, probably, it is. Here it is - bandwidth. It is impossible to write more to this DBMS, it seemed to me at first, but what if we slightly change the way we write? What if we start writing not one point at a time, but two points at a time? What happens then? And you’ll get another graph, the red one:

When on every insert, we do bulk insert. We insert not one point, but two whole points, and “twist” the same “pen”. It turns out that this threshold rises. So what is bandwidth? Blue or red? And, in general, why so?
Here a stupid example comes to my mind, you will excuse me, but it is somehow close to me. Few related to the DBMS. Let's assume such a picture that in the evening the company is well rested, having fun and deciding to send someone for a bottle of milk. It seems to me that milk is best here. What is a man doing? He dresses, shoots, takes the keys, goes out, goes down the elevator, goes to the store, searches for the shelf, takes milk, walks to the checkout, makes “peak!”, Takes the bag, bottle, rises, undresses, brings to the refrigerator - that's it! We have made a system with a capacity of "one bottle of milk for the time he went."
Now we will think: "What if you ask him to take two bottles of milk?". What is the difference in time? The fact that the checkout will not be “peak!”, But “peak-peak!”, And the rest of the time will be one and the same. And we get a system that has almost twice the bandwidth.
If we return to the world of the DBMS, then how will this scene look? Probably, this is preparing a request, opening a socket, establishing a network connection, sending a request, server-side parsing a request, preparing it, executing, possibly raising from a hard disk, preparing an answer, serializing the response, packaging, sending to a socket, client-side deployment and reading. Probably, here, if you also ask to write down two points, and not one, here are common pieces, this will allow us to start saving a little.
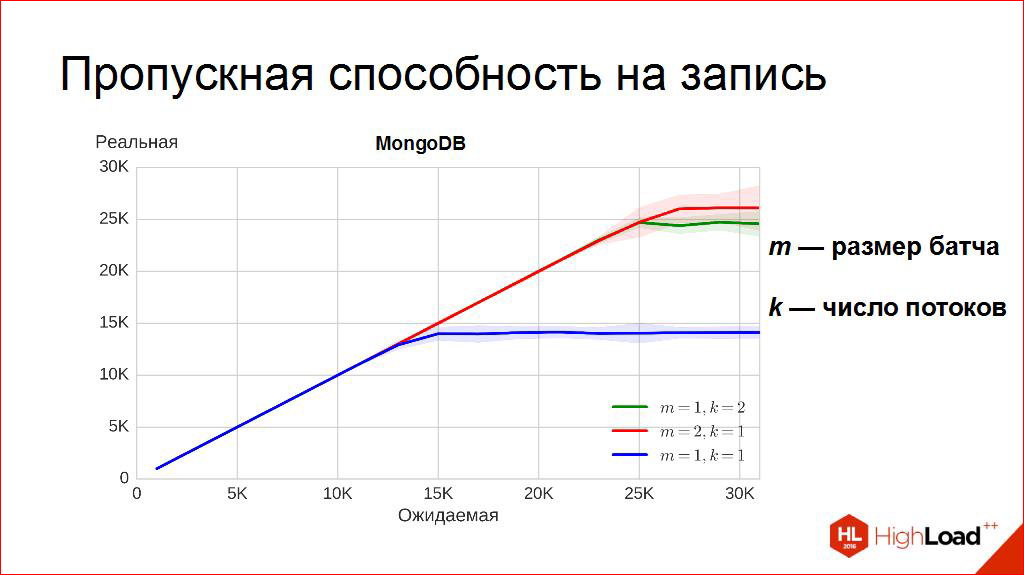
There is another interesting approach, it turns out. Another axis that can be “twisted” - and what if we send two people for a bottle of milk? What if we write in two streams? There is also an interesting effect. We really do it faster than at one point. Greens are two streams, but one point at a time. It is curious, by the way, that they did not overlap each other. Greens slightly smaller. True, within the limits of fluctuations, but still the characteristic median is smaller than that of the red one.
That is, there are two axes, you can still twist the "handles." You can “twist”, how much we write at a time, and you can “twist”, how many clients we write to this system.
Let's twist them, it's interesting. These are the “pens”, you can “twist” them, see what happens. For example, we will "turn" the batch. This is one of my favorite "pens", it is very simple to implement, so I love to "twist" it.
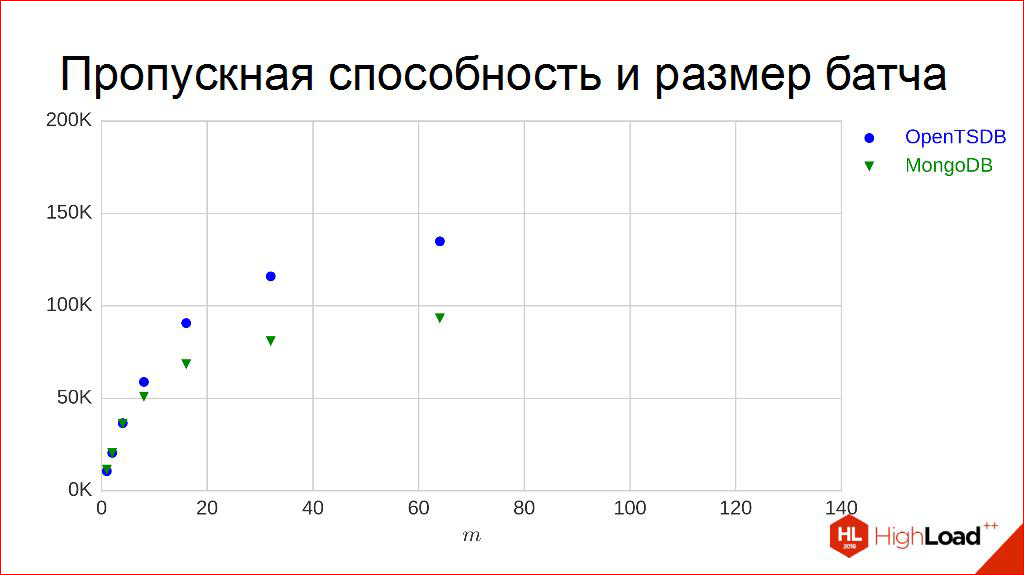
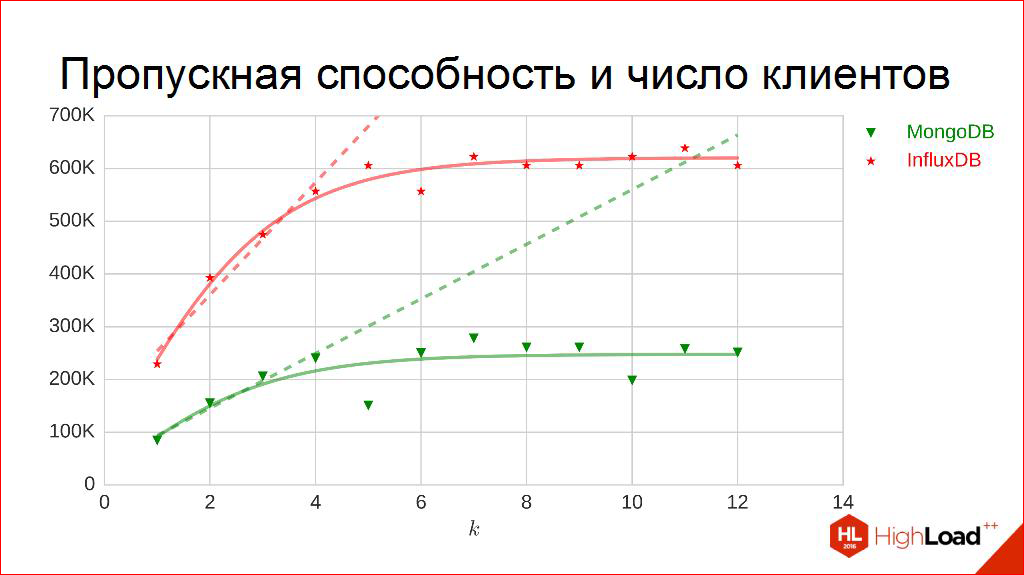
Let's go on other schedules. Take different batches, emki, and build our points. Here it is clear that for the powers of two they are taken. The points are constructed in exactly the same way: the experiment lasts for 5 minutes, and the median is calculated from all throughput capabilities per second that are obtained. For two contestants. An interesting pattern is visible, that, yes, it grows, but, by the way, somehow it starts to bend a little bit, that is, it clearly grows not to infinity, maybe not very linear. Another interesting point - if at some points they are very similar and behave approximately the same, then at others they start to differ slightly and behave differently.
Is bandwidth really this curve? Any kind of addiction? Maybe. But working with curves and dependencies is terribly inconvenient. They are inconvenient to enter in the table. Convenient to work with numbers. What would we have come up with, to take and turn each of them into a number, into a number that is convenient to measure: more or less. Because everyone is inconvenient to post on this schedule, they can begin to overlap. Ambiguities. Let's think about how this can be done.
The first is that when I see such a thing, my hand suggests itself to take a pen and do something like this — to make some kind of curvature:

As though some laws, probably, dependences. Then comes the moment of truth. You need to be very tense and guess what kind of a crooked link it can be. Need to pick something that looks like. There are many selection methods. One of the easiest and most loved and used by me is to play a little bit with the axes. What if we start postponing not batchy along the horizontal axis (now we’ll have to strain a little), but logarithms from the batch? Logarithmic axis. Rarely, maybe, he knows why it is used, but it is very useful in such situations, because in it this picture looks a bit simpler:

With direct work more convenient. Which, by the way, tells us that before this graphs really were logarithms. Direct understandable. Probably, even these angles can be calculated. Here the title of the slide even reveals how it is done. There is a not very complicated linear regression method, which will give us these angles, more precisely, the tangents of these catches.
Next is a subtle point like that. He is very debatable, and I really hope that someone will tell me later where I got this from. I am sure that somewhere this was once described and well thought out. And the idea is this: let's take these angles, or rather, the tangents of these angles, instead of taking these graphs. The bigger the angle, the better it feels, the bigger the better. The smaller the angle, the worse it is, the smaller the tangent will be. That is, we can try to introduce this order relationship more strictly here.
For example, for our contestants (these are not angles, these are tangents of angles, I have recorded here) we have obtained approximately such measured dependencies of throughput on the size of a batch. In this case, for two.
Summarize the rest. And we will do one more trick.
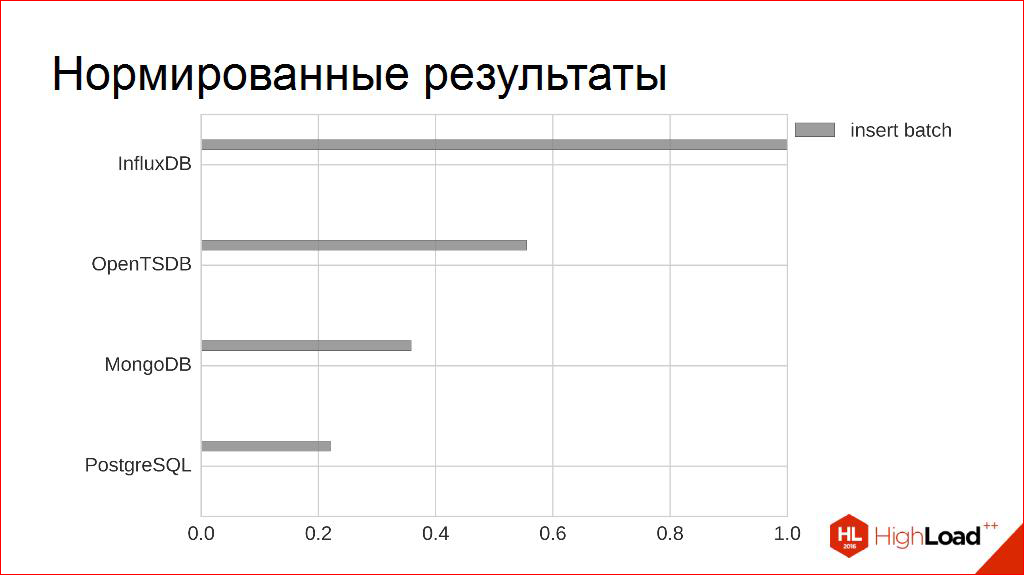
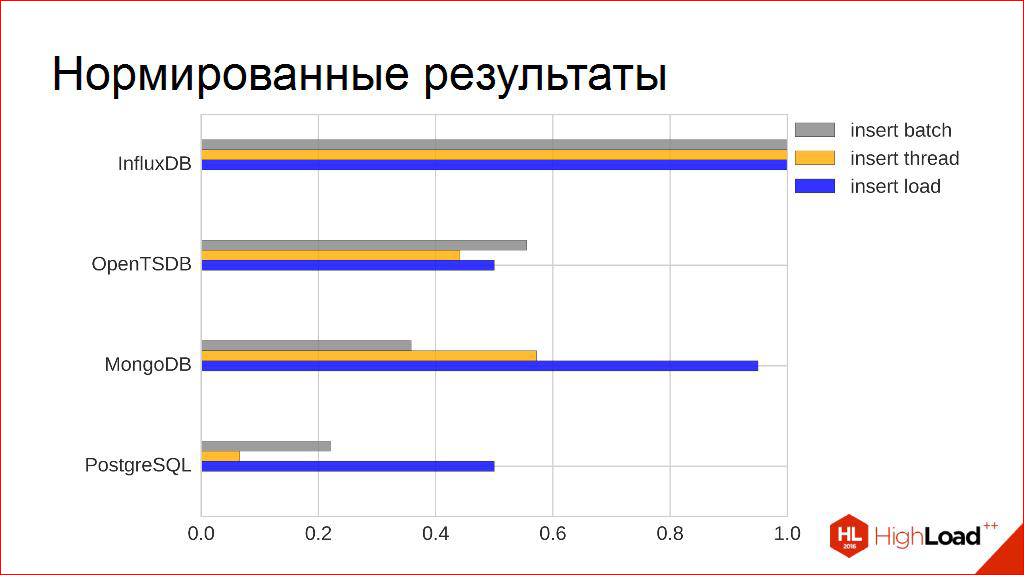
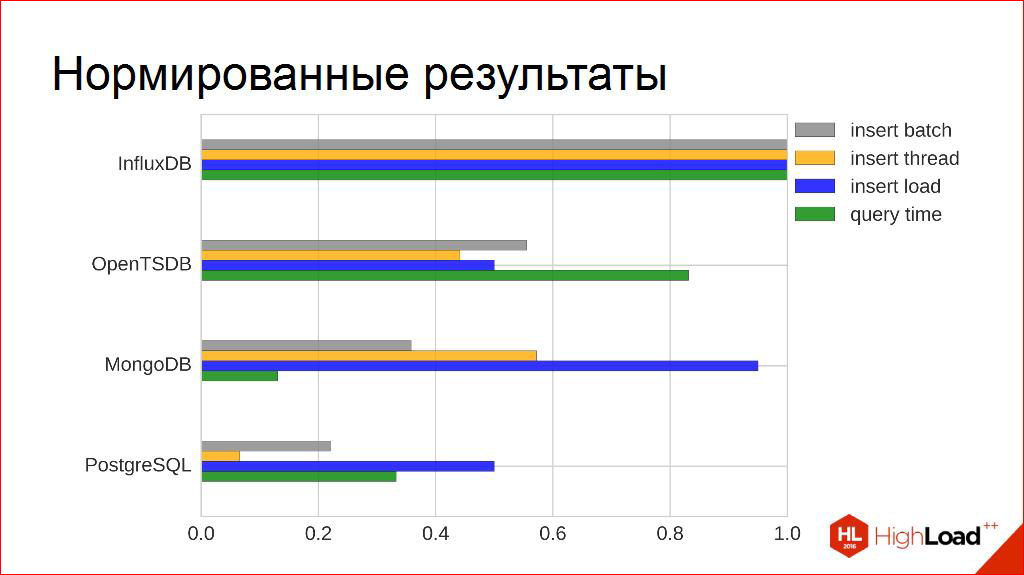
Absolute numbers - 20 thousand, 100 thousand, 200 thousand - they are smart for advertising leaflets, but I don’t really need them. By the way, I only know that I need a minimum. I know, for example, that each of the contestants for peak performance fits into my non-functional requirements, even with a margin, some with a large margin.
In order to then compare them with other criteria, I use a simple technique. I simply normalize them to the maximum, and I get such a relative value from zero to one — who is more, who is less. Figuratively, by this criterion - who is better, who is worse.
It is clear that there is still room in this plate for other columns to appear, according to other criteria. Let's try to finish them.

For example, bandwidth on the number of clients. Same. We measure. Only now on the horizontal axis we postpone how many streams they write with us, we get these points. It can be seen that they begin to tremble a little. Here you can guess that krivulinki can also be held. They will be logistic functions, that is, with saturation. They really go to such a threshold and do not go further.

Why, by the way looks like this? Why so strange? In fact, our nature is limited and, for example, on a machine on which they are tested, or rather, the environment is also limited by the number of cores that a DBMS can consume. And, I think, from this graph, it is immediately clear what the number of cores is.
I suggest. And, let's, try to think, and now let's all together say how many cores are issued by this DBMS? One two Three? Four? Some guessed, really four.
As soon as the cores run out, terrible competition begins, and to work in this area is practically meaningless. We need to work in the field earlier, so here I use a different approach. I do not want to measure these curves entirely, I want to measure only in those parts where they are linear, where there is no this tough competition yet. You never know, I have this machine with four cores, but what if I transfer to 20 cores, and what if someone is very lucky, he has 60 cores. There probably will be other curves, so here I will measure only the linear part. Here there generally lays more or less on some linear piece.
And the reception is the same - straight, the tangent of the angle of inclination - here it is. We can get tsiferki dependence, figuratively, throughput on the number of clients, as I propose in this report to understand, and fill the plate with orange rectangles.

Get a measurement on this characteristic. Go further and deeper. For example, look, and what happens under load? There, in general, the most interesting happens. These are the most expensive experiments, because they last 10, 12 hours each. My longest experiment, in my opinion, is three days. For different DBMS, how they behave. Some interesting general patterns are observed. For example, this is OpenTSDB under a load of 60 thousand:

In principle, everything is quite predictable, everything is fine. Sometimes the DBMS leaves on the DBMS-shny affairs, something does there. Judging by the logs, she very actively communicates with HBase, that is, HBase does something very active, then comes back. This, by the way, means that you need to be prepared for this, customers should be ready. This is, in general, a good practice, because the DBMS can “go into itself” a little. If she leaves forever, we don’t need it, but maybe a little. But the rest of the time everything is fine, everything is stable, well done!

80 thousand. Also. It seems that stability is sufficient, and even I will tell you more - stability is understood here a little bit formally. If the median (sometimes called its fifty-percent quantile) means half of it is to the left, then here I measured the ninety-nine percent quantile. That is, it interests me that in 99% of the total time, the record in the DBMS is at the level at which I want. That's 80 thousand indeed it is. At some moments, of course, we can fall out, but they do not exceed 1%.
So it still looks like “OpenTSDB healthy person”.
And here is the "OpenTSDB Smoker":
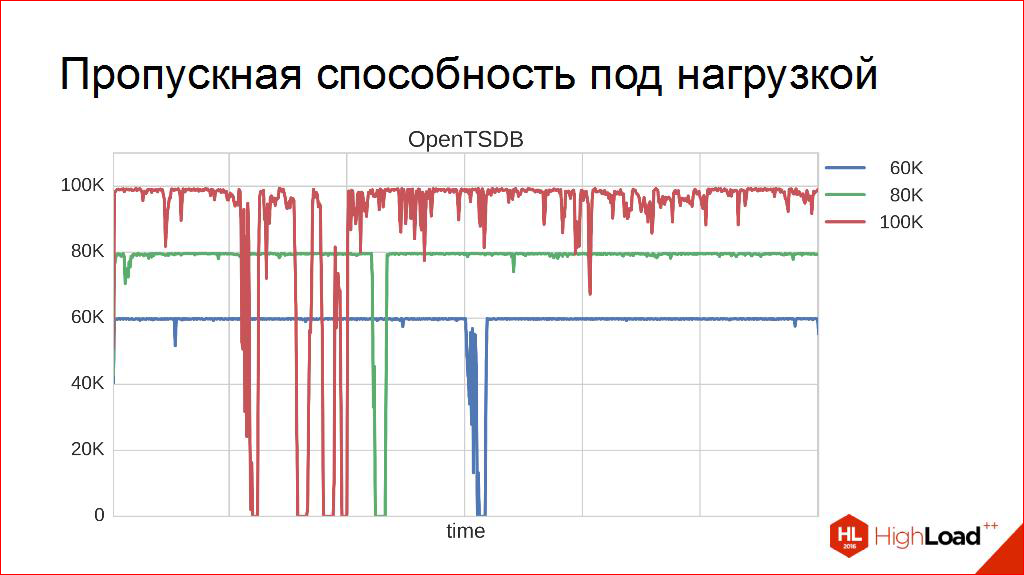
It can work on such a load, but obviously the ninety-ninth percentile, you see, this is not a hundred, it will obviously be much less. “It goes into itself” more often - you can understand, it’s still necessary to withstand such loads. And this means that, looking at such a schedule, I would say: well, this piece under a hundred should not be kept in this installation. Under eighty - hold. One hundred for a long time do not turn on! At peak load, it withstands even more, but I would not recommend keeping a hundred for 12 hours.
And then this threshold appears. Unfortunately, I could not calculate it accurately. The experiments went with a very big step. I stopped at the last step, where this characteristic was satisfied. So that for 12 hours the system could work stably under the desired load.
And tsiferki work under load. Naturally, they are much smaller than the peak ones, but in this sense they are a bit more interesting, because they describe how it will last for days, and not how it will work for only five minutes. And here they are blue bars:
A little bit of "captaincy", probably, is already visible here. Although, if you look at others, there are already some interesting interconnections, we will talk about this later.
Let's go further. Query execution time.
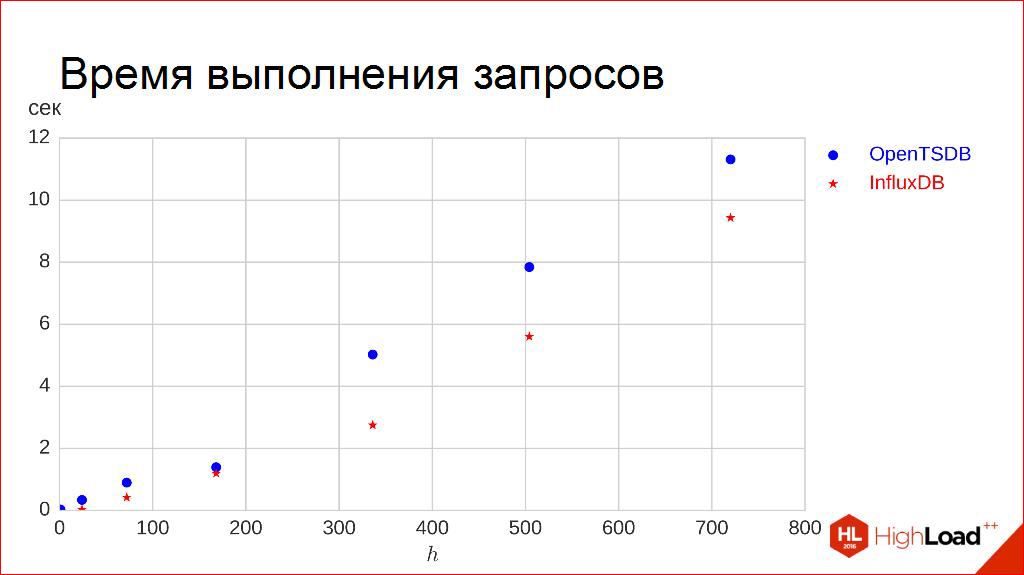
Here, thank God, a little bit simpler. Putting on the horizontal axis the length of the interval, how much we want. We want to request data - for a day, for three days, for a week we want to upload them to ourselves. We make 100 requests and measure the ninety-fifth percentile of the execution time, that is, I want 95% of requests to be executed shorter than in the time specified there.
For me, this is more important, so there is no median here. Why? Because this is the most critical thing - the user has pressed the button, and the circle is spinning.And it does not suit me here that in half the circle will stop spinning faster than in 5 seconds. I want 95% of users to complete this circle spinning earlier than in the allotted time.
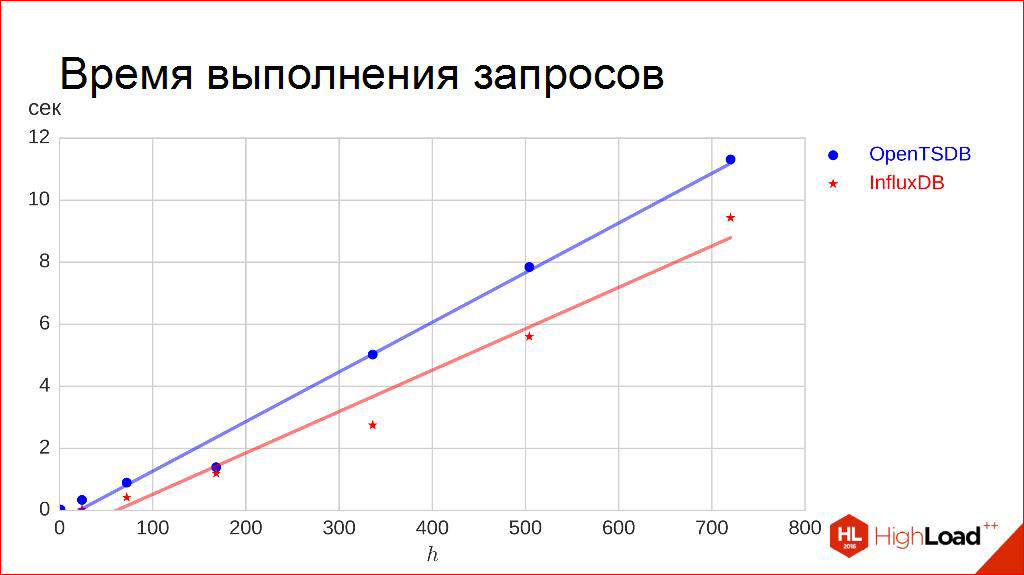
Here everything is quite predictable. The dependence is very well approximated linearly, which is quite expected, so the reception is the same. Here the only thing is that here we have to turn the situation a little. Here the more, the longer we wait, the worse. Therefore, here we take not the tangent of the angle of inclination, but the reverse to it. Then the reverse law, feedback, works. We get green squares:
Yes, yes, I understand that at first a little bit of “captaincy” will be. I tried to do everything honestly, with myself, at least to be honest. And I just give the results that I honestly received and can even reproduce them. I ensured that these results were reproduced, and these graphs did not tremble. Let us assume that such a schedule on Monday is not much different from such a schedule on Friday, so that they settle down in this sense.

About compression. Probably, I practically can only show results. The measurement is very simple. We load the approximate amount of traffic per month, we know how much it takes in its raw form, we look at how much the DBMS has occupied on the hard disk. Including all the meta-information, even I did not consider that she could reserve something extra for herself. Here I was a little rude. I just take it - how much did it take to disk additionally. Received coefficient ratio. And here it is, the compression ratio.
Someone, by the way, was even more than one, because there is a lot of meta-information, we still need to store indexes, we still need some additional identifiers, official fields. Someone had less than one, it is clear that good compression works. Especially for those who knew that they would add real numbers. Yes, they are very tight, really.
Got our intermediate result. It seems that, yes, the result is obvious, but I still wanted to go further, I did not want to dwell on this chart. Although, here it is already possible to draw some conclusions. If you wanted to bring it to some kind of automaticity, reproducibility and think: “If the situation were a bit more complicated, what would I do next with these graphs?”. What if there were no top, top competitor? After all, there is very strange. Someone in one is good, someone wins in another. How can we make this multi-criteria comparison?

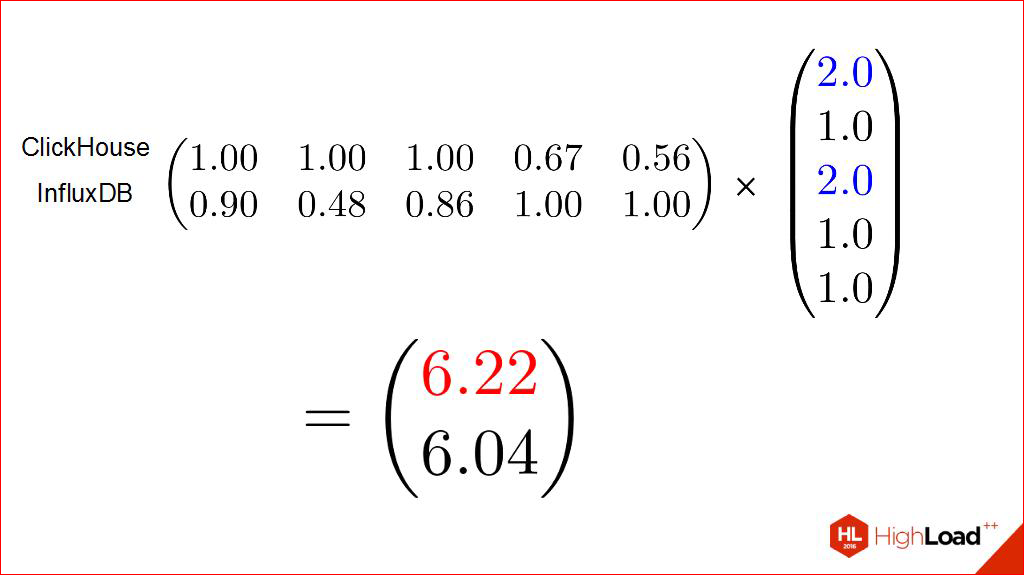
Let's get a little bit of math involved. Take this tablet and rewrite it. I would not say that it is more convenient, but more convenient for us, the view. Nameplate of numbers. The lines are our competitors, and the columns are our criteria that were on the last chart. Now we’ll add the thing I’ve been waiting for and wondered where to add it: which of these criteria is more important to me than others; more important, less important.
I can, in principle, make way, but my colleagues really know. It seems that this approach is familiar to many.
This we declare out of competition. We enter our weight matrix. Further, I think you can guess what will happen. Multiply. We get. Outside of the competition, while we remove.
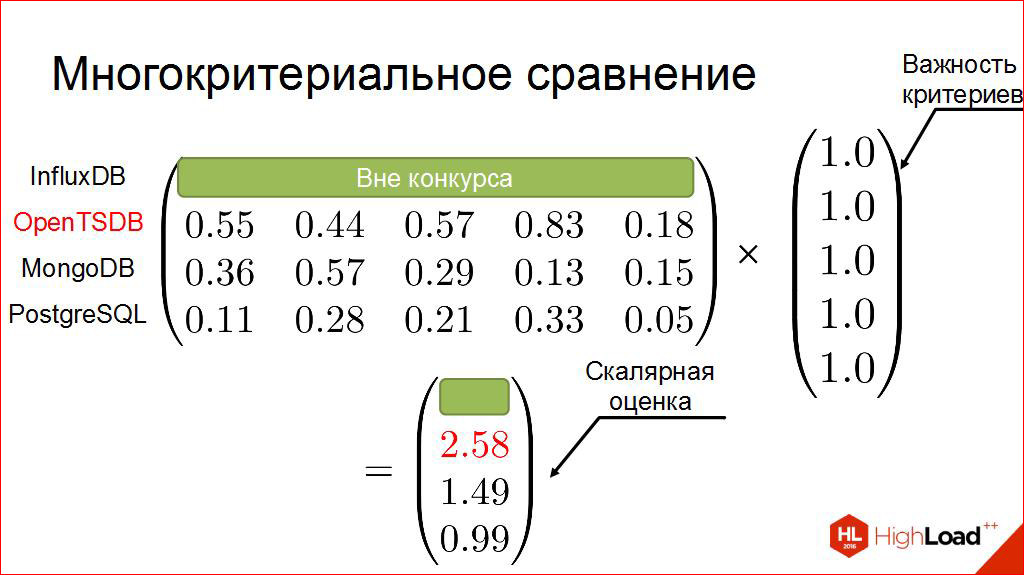
Here he is our winner.
What if we slightly change the weights matrix? What if we highlight something more important?
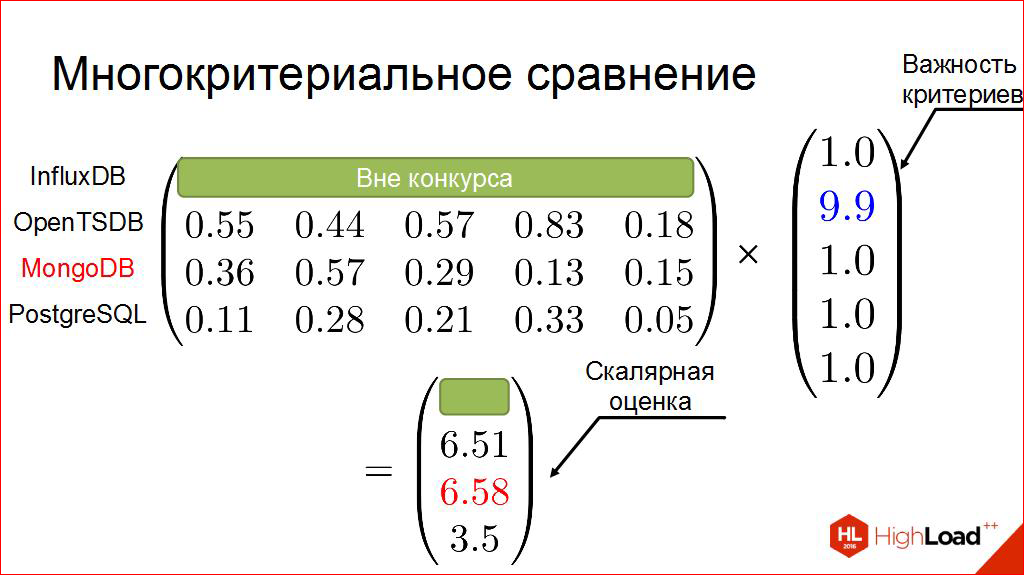
I will first show an artificial example, the second criterion is very important to us (this is the dependence of throughput on the number of clients). If we then do everything formally, we will have a different winner.
Here, of course, this is all a slightly artificial example. Such a small "captaincy", because the one whom I excluded out of the competition, he, it seems, is good. And when I got this result, yes, I was at first a little ashamed - that I would come to the people, would I tell them some extra things, and everything is clear there?
Therefore, I began to look for, maybe something that I do not know.

Maybe find someone who will compete, some dark horse who can show himself in comparison with our competitor.
Began to study who left recently. Stumbled upon one very interesting project. The last contestant who looked interesting by advertising booklets. The source could be read, they are sane, I liked. And it was interesting to drive him through the same chain.
I, probably, will only show the final result, where unexpected effects began to appear. And I have never seen such unambiguity in them. If we now leave only the obvious leaders, and try for them the same trick, then there it may well make sense.
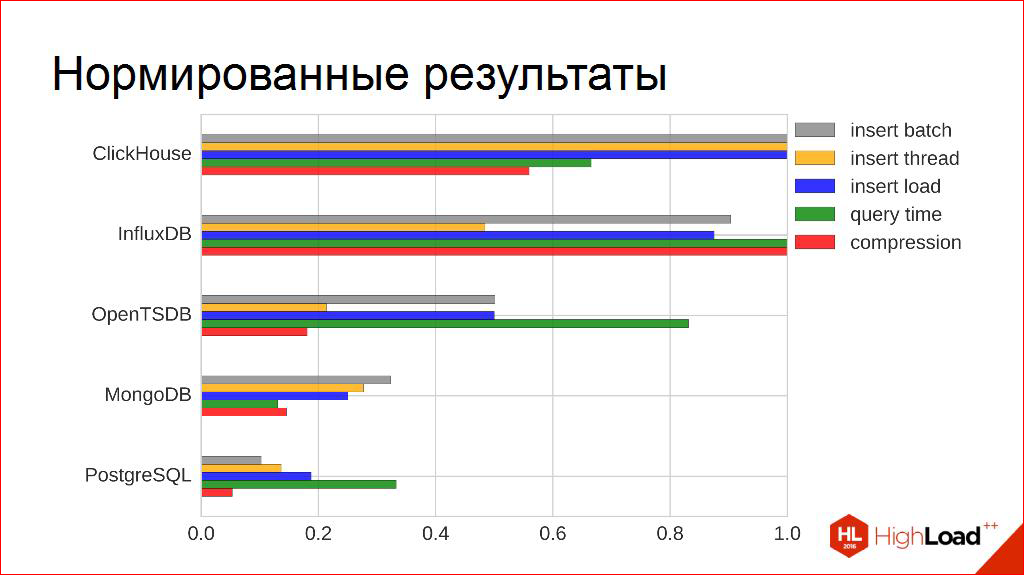
Equally, when all the same - we have one winner.

If we single out some criteria, like a little more important, it is different. They begin to change. And it is here that we are trying to bring in our subjectivity. Look, we subjectively measure non-competitors, we subjectively measure the criteria for which it is important for us to look for something. And depending on this, we get different results.
In principle, these are probably the main thoughts that I wanted to convey, so I move smoothly to a conclusion. Besides, the time I have, I think so, is running out.
My conclusion is “captain's”, which I myself am trying to formulate:
- check on your data, on your systems - this is very useful;
- a little bit of mathematics never hurts, believe me, it makes you smarter in the eyes of others;
- This is an interesting point that colleagues, apparently, are well aware of - one can also measure a subjective assessment. The main thing - know that you measure it.
Basically, that's all.

Thanks for attention.
If you are interested, you can follow the links below, and I have everything.
Sources:
- Y. Bassil . A Comparative Study of the Top DBMS Systems - paper
- C. Pungila, O. Aritoni, TF. Fortis . System for Sensor Readings - paper
- B. Cooper ,, A. Silberstein, E.Tam, R. Ramakrishnan, and R. Sears . Benchmarking Cloud Serving Systems with YCSB - paper
- T. Goldschmidt, H. Koziolek, A. Jansen . Scalability and Robustness of Time-Series Databases for Cloud-Native Monitoring of Industrial Processes – paper
- T. Person. InfluxDB Markedly Outperforms Elasticsearch in Time-Series Data & Metrics Benchmark – blogpost
- . -. In-memory NoSQL ? - slides
- B. Schwartz . Time-Series Databases and InfluxDB – blogpost
- K. Eamonn and K. Shruti . On the Need for Time Series Data Mining Benchmarks: A Survey and Empirical Demonstration – paper
- R. Sonnenschein. Why industrial manufactoring data need special considerations – slides
- S.Acreman . Top10 Time Series Databases – blogpost
- J. Guerrero . InfluxDB Tops Cassandra in Time-Series Data & Metrics Benchmark – blogpost
- J.Guerrero. InfluxDB is 27x Faster vs MongoDB for Time-Series Workloads – blogpost
- ClickHouse - blogpost
Thank you, I am ready to answer your questions.
Question: Hello. Thanks for the report. Such a question: when you measured under load, what was the end of all? Rested in iron, in memory, in the processor? Or were these the limitations of the engine itself?
Answer: This is, shall we say, ancillary work, which the engine must constantly do. That is, it is clear that, most likely, the recording goes constantly to the memory first, but it is necessary to periodically flush it to disk. And at this moment the drawdown began. This was clearly visible both in the logs and in the way the system behaved. Because, I did not draw here, I have automatically written the graphs of the load on the hard disk. They correlated very well with throughput failures.
Question:I wanted to ask: did the requests of a parallel record go, how were things with them?
Answer: Here I tried to imitate the real situation. Here are the timelines for the execution of requests. This system was constantly and in the write load. I didn’t set about, however, not hundreds of thousands, I took my indicators, in my opinion, I took 20 thousand per second record. Kept her non-stop. It was at that moment that I made inquiries and measured.
Moreover, there I came across one problem. I now take the opportunity to tell a little more.
At first everything was very fast. I did not understand why. And then I understood - I did the same requests. And as soon as I began to randomly choose a channel through which I request, and randomly choose an interval through which I request - the numbers immediately came to normal. And yes, magic did not happen. It really doesn't always work fast. Especially if we want to upload data for the week.
Question: You said that you are not very interested in how the DBMS works, but, probably, you run them with some parameters, with some settings? I mean, for example, the same OpenTSDB can do a lot of things. And the rest too. Did you take the default, or did OpenTSDB use append mode instead of compaction?
Answer: Good question. Thank you very much.I will answer it like this.
First, of course, part of me is lazy, and does not want to bother with the settings of each of them in detail. I understand that if you take a good DBA, he will come and say: “You do not understand anything. Now I’ll do it all and everything will work. ” But he does not always have.
Therefore, of course, I am interested in systems that by default behave themselves well. But somewhere I used his mailing lists, wrote to people, asked me to explain some facts that I discovered. They advised me. In particular, the PostgreSQL mailing list advised very well that I needed to set it up correctly in order for the data to go better, and the artifacts that I watched were gone. In particular, they advised me how to properly use VACUUM, when, in which areas.
OpenTSDB. No, I did not change append / compaction. In my opinion, I have something in the storage settings, but I now, unfortunately, do not remember exactly what. But, to be honest, a detailed setting, right here, twist all the knobs, I definitely did not produce here. Most of them are systems that are stable and standard from their Docker containers, delivered and put on the system.
I agree with my colleague, yes, the comparison is not very correct, so I say: “I am not comparing a DBMS. I compare how I use them. ” Therefore, maybe this justifies me, and maybe the other way around. Thank.
Question: Pavel, is it possible, in continuation of how you use them, those query (queries) that you gave? What is this query, are indices and aggregates used, are there any database features associated with working with queries? What did you compare?
Answer: There are several carts I used.
First, which OpenTSDB, InfluxDB - they have built-in indexes, so they immediately use them over time.
For the rest, I walked in two ways: first, I just built the index, the queries worked well, but a little worse — the record. And, moreover, it was very inconvenient, for example, to keep data in one collection or in one table. Obviously, it grew instantly. Therefore, colleagues will forgive me, I made a very bad reception, which I love very much, I began to split up by days simply. Every day has its own sign. And the indexes are not used.
After that, of course, I had terribly complicated requests, because now I had to drag this information into the client, but, for example, my rotation became very simple and very convenient: DROP is everything, DROP is everything. And requests began to work well on writing and reading.
Very stupid requests, only for a time interval. The maximum is that with aggregation, say, an average for a certain interval, that is, not every second, but, say, an average per minute.
Question: Pavel, thanks for the interesting report. I wanted to ask such a question: You said at the beginning that you need to know your data, you need to know your load profile, and measure on it, yes, and on the hardware that you have? Why not simplify everything and measure on the necessary bandwidth, immediately on the right amount of batches, immediately compare in such characteristics? Wouldn't it be necessary to derive these tangents, to do all the complicated math?
Answer:I can answer here like this. Yes, thank God, I have, straightforwardly, a document, non-functional requirements are written there. But I know that they can change. And those 20 thousand that I have to keep up today, in a year can turn into 40 thousand. Therefore, despite the fact that each of the contestants fit in them, I, of course, would be interested to choose, which will withstand the change of non-functional requirements. This time.
The second.The size of the batch is a very interesting feature. You have to pay for it. The more batch you have, the more latency you have. You need to create buffers somewhere that will add extra delay to your data. Therefore, to make them very large, if latency is important to you - it is, generally speaking, dangerous. Therefore, it would be interesting to look just from the point of view of the minimum size of the batch, but since I am simultaneously processing the entire stream online and not read from the DBMS, the latency here was basically not important to me, so of course I then twisted the size of the batches almost to the maximum.
Which, by the way, is different for different systems. For example, OpenTSDB already works well at sixty-four, but InfluxDB starts to behave normally from five thousand at the time you write. By the way, I later looked in the standard drivers, it stands as a constant sometimes: write 5 thousand at a time. And the buffer is in the driver itself, which, by the way, I really didn’t like. I want to be able to manage it, generally speaking, that is, how much it is really stored on the client when it goes to the base. Therefore, for example, for InfluxDB I had to write my driver on top of their HTTP protocol.
Question: Tell me, if I understood correctly, you set up the structure, the base scheme for each base separately. And somehow you tried to adjust the application under the structure?
Answer:Of course. Especially when I started to use this not very, maybe a beautiful cutting approach by day for each individual plate, when the drivers received a request for a range for more than one day, they needed to understand that in fact it should be broken or, if the base allows , make a query on several tables at once.
Question: Attempt to use asynchronous access to the database or pools? Something like that?
Answer: There was almost always asynchronous recording. Yes, the pool was used, in particular, if it was an HTTP protocol, it tried to arrange a pool of connections, and everyone was keep alive, that is, not to repeat them. Perhaps this is all that was used.
Thank!
Contacts
→ pavel.filonov@kaspersky.com
→ github
— Highload++ , — « , ».
" highload " Backend Conf .
, , , highload-. Tarantool, ClickHouse CockroachDB, , , , -, MySQL, — MongoDB.
Source: https://habr.com/ru/post/329062/
All Articles