Diagnostic Tools Plugin for Qt Creator
Good day. Recently, I had the idea to write a simple but functional plug-in for the Qt Creator development environment, designed to visualize data on memory usage and CPU utilization of the currently running process. As an inspiration for me, I used the tool "Diagnostic Tools", which is present in Visual Studio. Below I will talk about the main details of the development.
Since the topic of creating plugins for Qt Creator has already been described in detail in Habré, for example, in the Qt Creator Extension System article, so I will not dwell on general information and go straight to the description of the plug-in.
Actually, in order to get information about any process running in the operating system, you first need to know its PID. I started the process of getting the PID started by Qt Creator in the first place. After a futile googling on this topic, I turned to studying the sources of Qt Creator, in the course of which I found that it was easy to know the desired data. To do this, you need to catch the following signals emitted by a static instance of ProjectExplorer :: ProjectExplorerPlugin :: instance ():
Having received the runControlStarted signal (ProjectExplorer :: RunControl * rc), we remember to specify m_runControlPtr on the ProjectExplorer :: RunControl * rc object and then, after the applicationProcessHandleChanged signal, we launch the data request.
')
The following tasks were trivial. In the Windows operating system, information about the memory used by the process and CPU utilization was obtained through WinApi, in Linux, by analyzing the contents of the / proc / pid / stat and / proc / stat files.
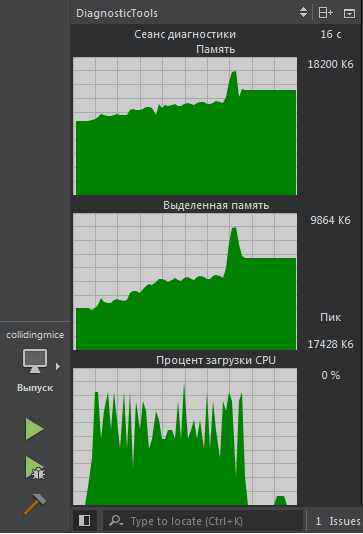
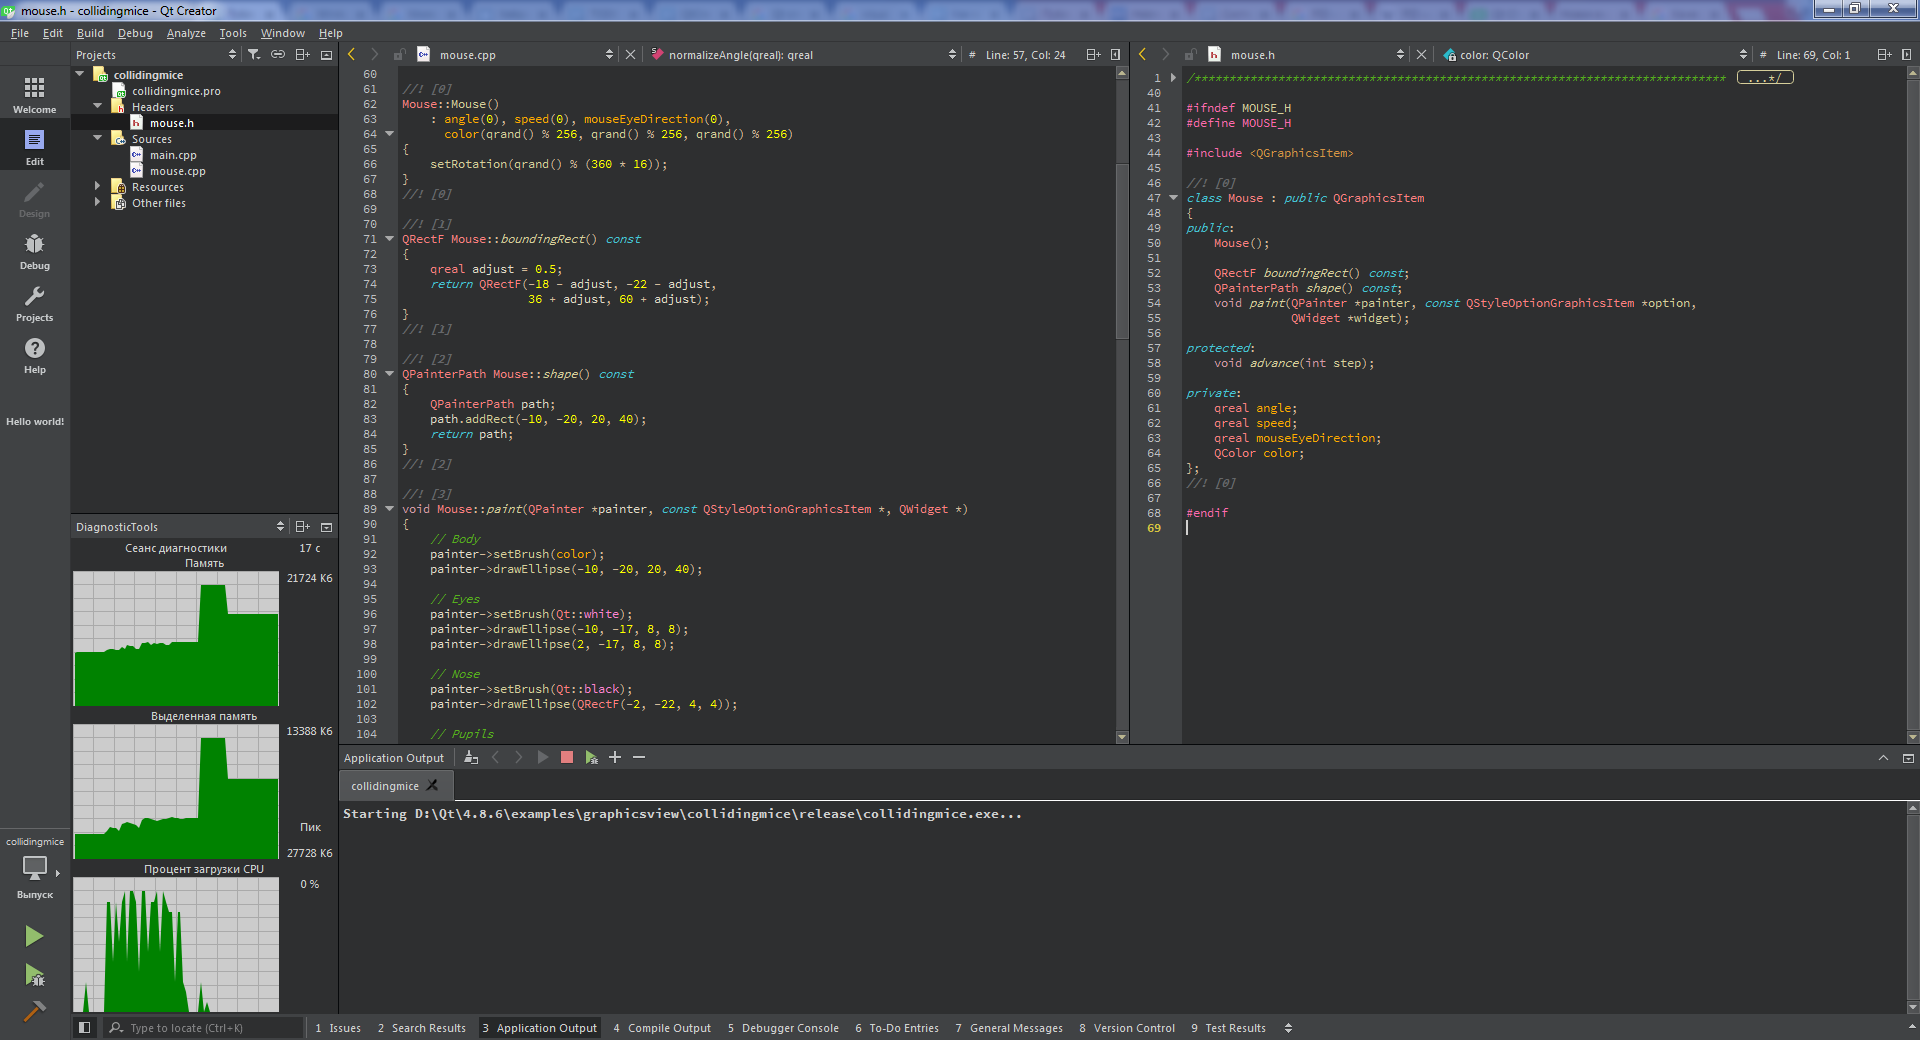
The final touch is the visualization of the collected information. The first thought was to use the Qt module for plotting Qt Charts, but since this component is not part of Qt Creator out of the box and because of the simplicity of the task I am solving, it was finally decided to implement my own class for drawing graphs. Having finished work with GUI, I began to think where to place the created graphic form. On the one hand, it would be logical to place it on the bottom along with the rest of the output panels, on the other - I would like to see the output of the application and information about the computer resources it uses at the same time. Therefore, a strong-willed (perhaps unsuccessful) decision was made to place the graphic form on the left side panel. And that's what happened in the end:
Conclusion
The article described what has been done so far. Next, we plan to create a version for Mac OS and add a settings window, in which there will be an opportunity to set a polling interval, a step on a chart, a color, etc. Maybe someone will give other ideas for improvement. View the source code and download the plugin here .
Thank you all for your attention.
UPD
The article was edited taking into account the comments of habropkop user Krepver
Since the topic of creating plugins for Qt Creator has already been described in detail in Habré, for example, in the Qt Creator Extension System article, so I will not dwell on general information and go straight to the description of the plug-in.
Actually, in order to get information about any process running in the operating system, you first need to know its PID. I started the process of getting the PID started by Qt Creator in the first place. After a futile googling on this topic, I turned to studying the sources of Qt Creator, in the course of which I found that it was easy to know the desired data. To do this, you need to catch the following signals emitted by a static instance of ProjectExplorer :: ProjectExplorerPlugin :: instance ():
void runControlStarted (ProjectExplorer :: RunControl * rc);
void runControlFinished (ProjectExplorer :: RunControl * rc);
// connects connect(ProjectExplorer::ProjectExplorerPlugin::instance(), &ProjectExplorer::ProjectExplorerPlugin::runControlStarted, this, &DiagnosticToolsPlugin::onRunControlStarted); connect(ProjectExplorer::ProjectExplorerPlugin::instance(), &ProjectExplorer::ProjectExplorerPlugin::runControlFinished, this, &DiagnosticToolsPlugin::onRunControlFinished); // slots void DiagnosticToolsPlugin::onRunControlStarted(ProjectExplorer::RunControl *rc){ m_runControlPtr = rc; connect(m_runControlPtr, &ProjectExplorer::RunControl::applicationProcessHandleChanged, this, &DiagnosticToolsPlugin::onApplicationHandleChanged); } void DiagnosticToolsPlugin::onRunControlFinished(ProjectExplorer::RunControl *rc){ Q_UNUSED(rc) m_runControlPtr = NULL; m_dataQueryEngine->stopDataQuery(); } void DiagnosticToolsPlugin::onApplicationHandleChanged(){ if (m_runControlPtr->applicationProcessHandle().isValid()){ m_dataQueryEngine->setPid(m_runControlPtr->applicationProcessHandle().pid()); m_dataQueryEngine->startDataQuery(); } else { qDebug() << "Process handle is invalid"; } } Having received the runControlStarted signal (ProjectExplorer :: RunControl * rc), we remember to specify m_runControlPtr on the ProjectExplorer :: RunControl * rc object and then, after the applicationProcessHandleChanged signal, we launch the data request.
')
The following tasks were trivial. In the Windows operating system, information about the memory used by the process and CPU utilization was obtained through WinApi, in Linux, by analyzing the contents of the / proc / pid / stat and / proc / stat files.
The final touch is the visualization of the collected information. The first thought was to use the Qt module for plotting Qt Charts, but since this component is not part of Qt Creator out of the box and because of the simplicity of the task I am solving, it was finally decided to implement my own class for drawing graphs. Having finished work with GUI, I began to think where to place the created graphic form. On the one hand, it would be logical to place it on the bottom along with the rest of the output panels, on the other - I would like to see the output of the application and information about the computer resources it uses at the same time. Therefore, a strong-willed (perhaps unsuccessful) decision was made to place the graphic form on the left side panel. And that's what happened in the end:
Conclusion
The article described what has been done so far. Next, we plan to create a version for Mac OS and add a settings window, in which there will be an opportunity to set a polling interval, a step on a chart, a color, etc. Maybe someone will give other ideas for improvement. View the source code and download the plugin here .
Thank you all for your attention.
UPD
The article was edited taking into account the comments of habropkop user Krepver
Source: https://habr.com/ru/post/329024/
All Articles