Automation of load testing of banking software for terminals
In this post we will talk about testing server software, which serves a huge network of bank terminals in Russia and abroad. We cannot disclose the name of the bank, some lines of configs are hidden.
So, we are developing this software using a modern CI / CD approach, which ensures a high speed of delivery of features, hotfixes and releases in production. At the beginning of the year, we were offered the task of providing load testing of the developed solution and demonstrating to the customer the ability to embed any subtasks and steps into CI / CD.
In addition to common words, Wishlist boiled down to the following: it is necessary to provide automatic deployment of software to the load stand, think up an easy way to generate data, implement an automatic and semi-automatic way to start tests, provide tests with an automatic start and stop trigger on an event, connect the mechanics of NT to the task tracker for a short reporting, connect the testing system to the available NT analytics system, create the possibility of “painting” bad and good releases for further actions in the workflow (roll out or send Avit report). The requirements, it must be admitted, are absolutely adequate and understandable.
Let's start from afar. We constantly hear the same thing: “It is impossible to automate load testing of banking and financial software! We have too many relationships! We are very complicated! ”. This challenge only increased the excitement of solving the problem. We always wanted to check the complexity of a specific example.
')
Remember the wonderful picture about testing in the form of a pyramid and a cone with ice cream ? Pyramid is when you have a lot of cheap automatic Unit-tests and few expensive UIs. Horn with ice cream - on the contrary. The horn is expensive, unwieldy and does not scale, the pyramid is cheap and flexible.

Instead of doing load testing of software at the level of system interactions, in the banking software sector, traditionally everyone tests through UI, as has been the case since all-in-one systems and applications. It takes a lot of time and effort, which makes the development of banking software slow, poor quality and low-tech. At Jet Infosystems, we were spared these stereotypes - the developers themselves wrote unit tests on their code, functional testers perfectly programmed UI tests through Selenium + Cucumber . It remains only to build in the process an additional stage of load testing.
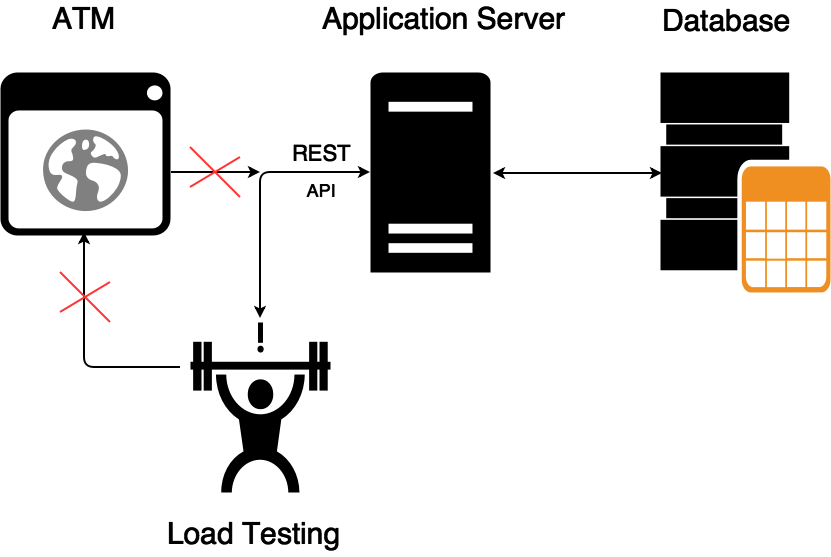
At the very beginning we decided to abandon interconnections that complicate and dilute the answer to the question of how productive and reliable code we are developing. For example, authorization and issuance of tokens for operations is the functionality of a third-party system, the performance of which within the framework of the task would be redundant. In addition, we immediately refused to integrate with several back-office systems, making a stub that responds to our system with a certain delay (we all know how dangerous it is to test the system on ultra-fast mocks).
But the most significant change in the testing paradigm is the rejection of the load testing of the UI terminal. Until now, this seems strange, but before us this server software was load-tested through the UI ATM. This happened as follows: some average user was emulated, which passed through some kind of scenario pool with a set of middle pauses (picing, think time), and the load tool was forced to create a load that consists of long and “cold” scenarios from several load generators HP Loadrunner, while the resulting load on one node of the API server was only about a hundred (!) Transactions per second. (Let's leave out the insane picture when thousands of citizens are trying to click on the controls of a single bank terminal). As a result, practically everything that was not related to the performance of the ATM backend was thrown out of the stand.
After designing and inspecting the remaining infrastructure, it became approximately clear how the process would be built, what benefits would be received, and it was necessary to start creating the NT process itself.
The software code is laid out in the internal git-repository (GitLab). After committing on a special trigger, Jenkins pulls out the code on the assembly machine and tries to compile a release with a run of all the Unit tests. After a successful build using scripts, the assembled build is installed in two test environments - NT and FT - and makes a restart of testing. After lifting the backend, Jenkins runs one after another FT, UI and TFT tests. Load testing is launched as a separate task, but it’s worth mentioning separately.
As everyone knows, the classic load testing tool consists of three “pillars”: a test data generator, a load generator and an analyzer of the results obtained. Therefore, we solved the problem in three directions.
In order to compile a relevant request to the API and not to rewrite XML each time for a changing specification, we went the other way - we “rob” the TOP-10 of the main payment scenarios at the time of the UI test run. To do this, we deployed tshark on a test bench, from which dump we collect XML (we will later send it to the API). This allows you to save a lot of time and effort on the preparation of test data.
We used the most popular tool in the Open Source market, JMeter, as a load generator, but Yandex.Tank was used as a binding tool for it. JMeter's capacity to send 100 transactions per second to one node is more than enough, and Tank gives us convenience in automation and several useful features - auto-stop, interactive graphics, the ability to use other load generators without reshaping the NT process, etc.
The most difficult part in the design phase of NT is the analytical part. Since there are no separate solutions on the market to create our analytics for performance testing, we decided to use Overload from Yandex . Overload is a service for storing and analyzing load test results. You create the load from your load generators, and upload the results to the service and watch them there in the form of graphs. Now the service is in a public beta, and for Jet Infosystems, Yandex has created a pilot private instance.
All data from our JMeter comes to Overload in an aggregated form and does not contain any personal information about payments and customers - the user sees only a graphical representation of performance tests.
After the build gets to the load stand, a special task for load testing is started via scripts in Jenkins. The task is configured in the classical way, through shell scripting and parameterization.
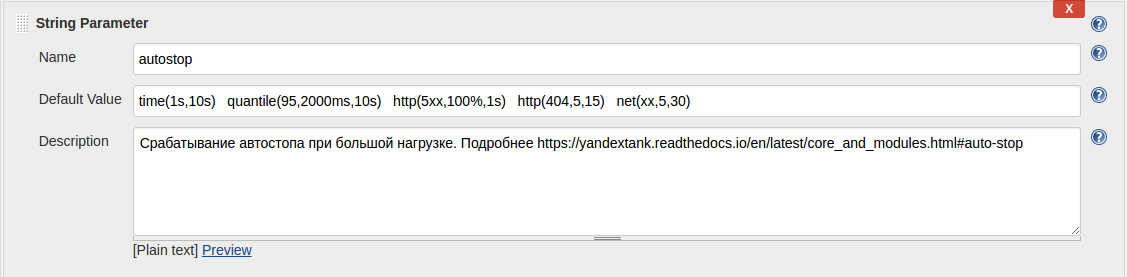
For example, so you can configure auto stop:
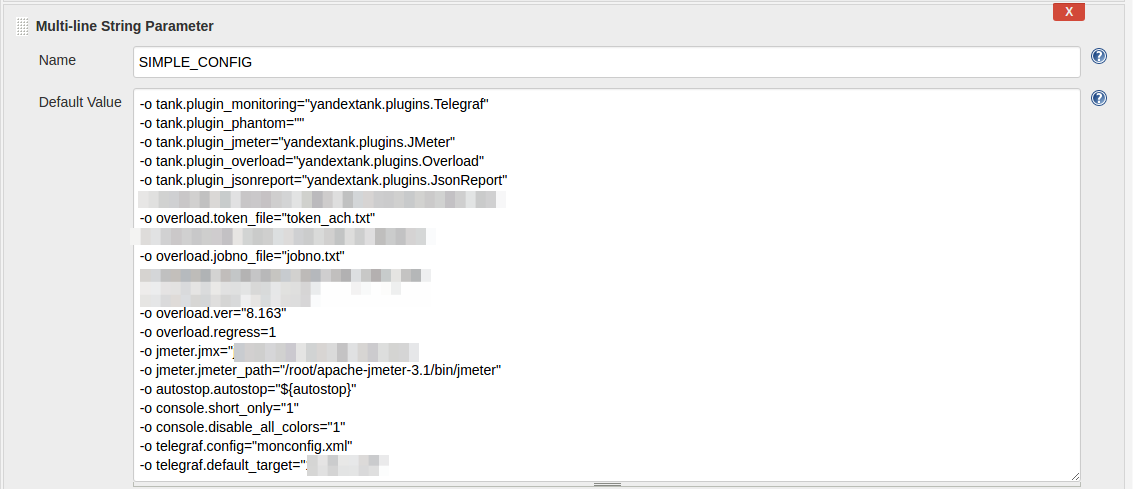
This is the Yandex.Tank config:
And this is what the shell script example of starting the whole NT process looks like:
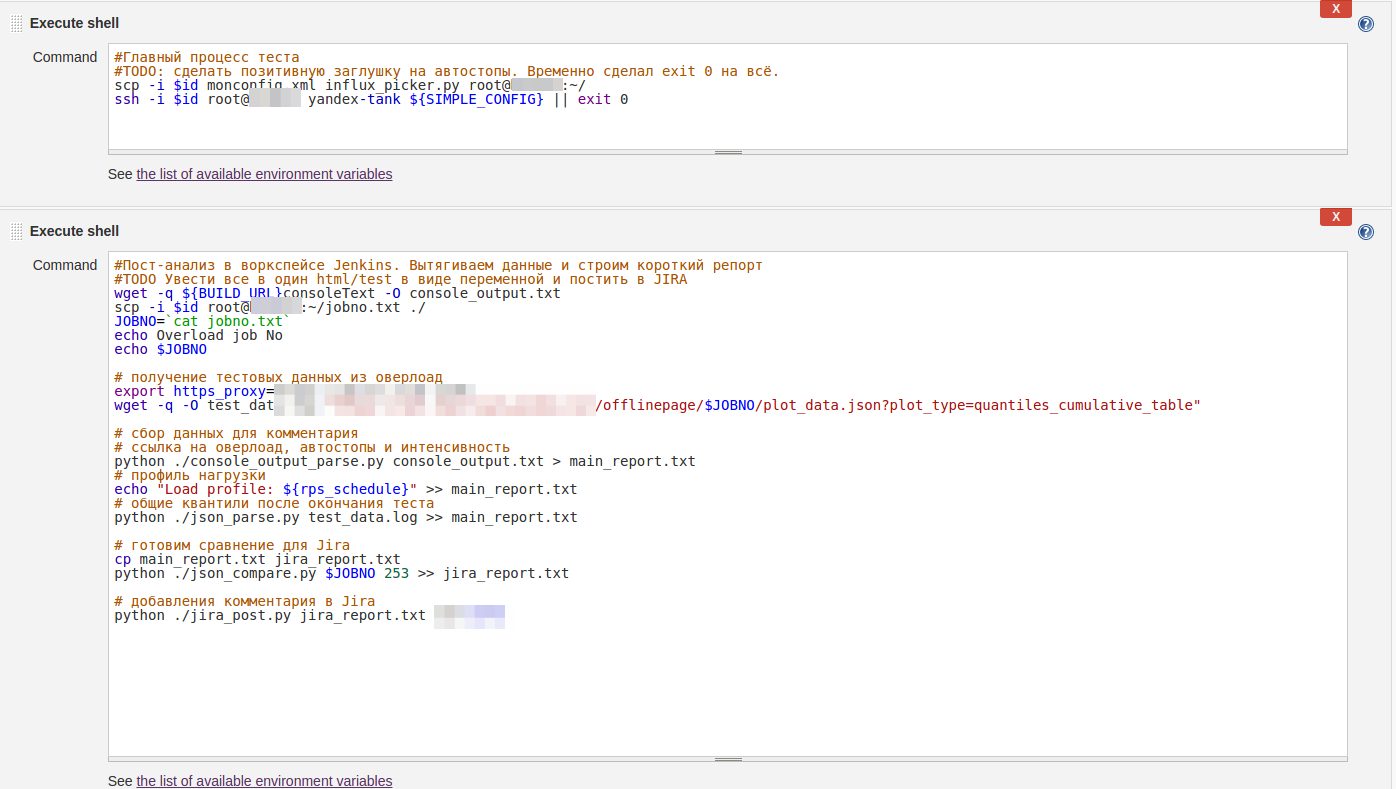
As you can see, all the settings are quite primitive. With the automatic launch of the job, the default settings are applied automatically, while manually starting the job, you can configure the shooter with the Jenkins parameters without understanding the documentation and not digging into the Linux machine and sorting out the necessary configs.
The “Start by button” mode for the developer looks like this:
After running the test, you get a link to the Console View Jenkins and Telegram, by clicking on which you can watch the load test in real time:

If the test results are beyond the SLA, the test automatically stops and you receive a report in Telegram, mail and JIRA about problems with the release. If the result is good, then after the report, the release receives the status of SUCCESS and is ready for deployment to the loaded environment, in production.
Screen from Telegram screen:

And so the bot reports the results to JIRA:
As a corporate “bun” from Yandex, we have access to a comparison of tests:

and access to the construction of regression reports on KPI-metrics:
This story would be incomplete if we did not describe a few rakes, which came across in the course of their work.
Monitoring Obviously, during load testing, you are obliged to use not only business monitoring tools (transaction validation, queue size, transmission speed), but also system monitoring (processor consumption, memory size, number of disk operations, metrics that you invented yourself, etc.) d.). Well, when you have all the infrastructure built on Linux - using the integrated telegraf solution over ssh solves this problem - all data is automatically uploaded to the statistics backend and built synchronously with the business metrics aggregates. But what to do if you have a part of the test environment built on a Windows platform?
We discussed various options and came up with this:
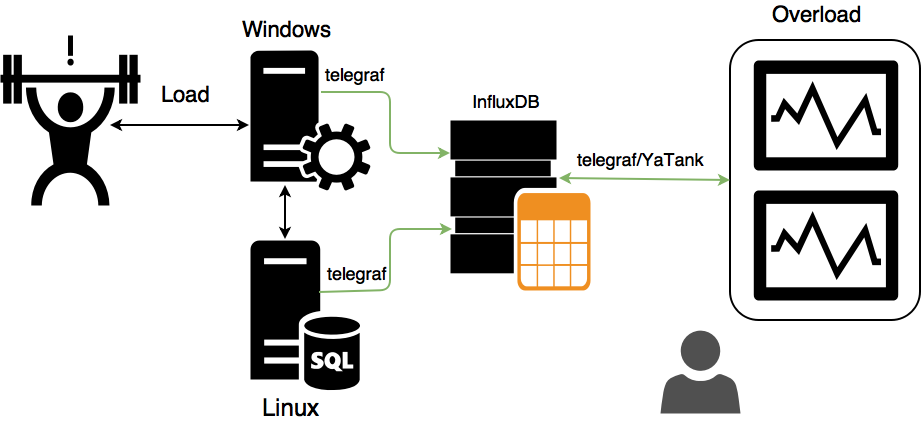
In this case, all metrics from servers and load generators are written to InfluxDB by local telegraf agents, and Yandex.Tank monitoring already extracts data from InfluxDB with a simple script and pulls data into Overload. This approach eliminates the support of the entire zoo of operating systems from Yandex.Tank and avoids the need for a “one-to-all” connection.
Having written the simplest script, like:
We can make Yandex.Tank collect Custom-metrics from InfluxDB with this monitoring config:
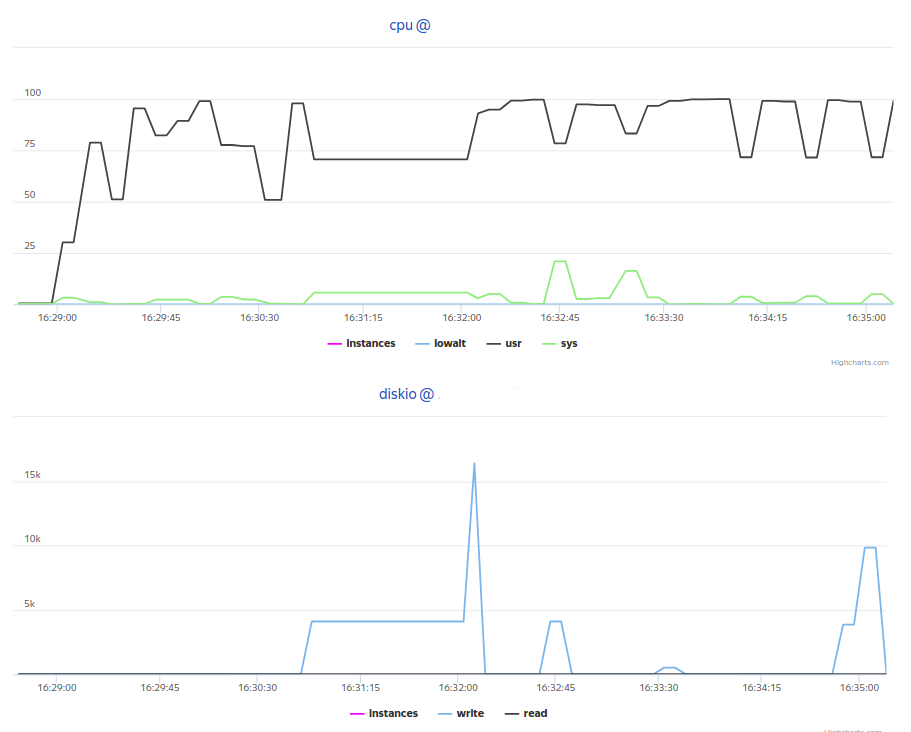
As a result, we get the following charts in Overload:
Reporting We used two types of reporting results.
A brief report - a small amount of metainformation with the distribution of times and a message from the autostop plug-in - was sent as a message to the Telegram-chat, to which the developers, the architect, the manager and the testers were signed.
The regression report — an advanced report, where a comparison with the reference results was added to the brief information — was sent as a comment to JIRA.
To do this, we used the Groovy script for Telegram and a simple lib (more on https://pypi.python.org/pypi/jira/ ) for connecting with the JIRA API.
As you can see, this task is not from the category of Rocket Science, and you could read similar articles here , here, and even watch the video here . Under the hood are the usual scripts and services - we just wanted to demonstrate that in fact, by the era of “Devops” and general automation, the financial sector has been ready for a long time, just need to have the courage and political will to introduce modern and fast processes.
What are the benefits we can get from automation?
In the following articles we will tell about our experiments with InfluxDB in terms of performance and engine optimization. Follow the news!
Team load testing company "Jet Infosystems".
So, we are developing this software using a modern CI / CD approach, which ensures a high speed of delivery of features, hotfixes and releases in production. At the beginning of the year, we were offered the task of providing load testing of the developed solution and demonstrating to the customer the ability to embed any subtasks and steps into CI / CD.
In addition to common words, Wishlist boiled down to the following: it is necessary to provide automatic deployment of software to the load stand, think up an easy way to generate data, implement an automatic and semi-automatic way to start tests, provide tests with an automatic start and stop trigger on an event, connect the mechanics of NT to the task tracker for a short reporting, connect the testing system to the available NT analytics system, create the possibility of “painting” bad and good releases for further actions in the workflow (roll out or send Avit report). The requirements, it must be admitted, are absolutely adequate and understandable.
Automation
Let's start from afar. We constantly hear the same thing: “It is impossible to automate load testing of banking and financial software! We have too many relationships! We are very complicated! ”. This challenge only increased the excitement of solving the problem. We always wanted to check the complexity of a specific example.
')
Remember the wonderful picture about testing in the form of a pyramid and a cone with ice cream ? Pyramid is when you have a lot of cheap automatic Unit-tests and few expensive UIs. Horn with ice cream - on the contrary. The horn is expensive, unwieldy and does not scale, the pyramid is cheap and flexible.
Instead of doing load testing of software at the level of system interactions, in the banking software sector, traditionally everyone tests through UI, as has been the case since all-in-one systems and applications. It takes a lot of time and effort, which makes the development of banking software slow, poor quality and low-tech. At Jet Infosystems, we were spared these stereotypes - the developers themselves wrote unit tests on their code, functional testers perfectly programmed UI tests through Selenium + Cucumber . It remains only to build in the process an additional stage of load testing.
Infrastructure design
At the very beginning we decided to abandon interconnections that complicate and dilute the answer to the question of how productive and reliable code we are developing. For example, authorization and issuance of tokens for operations is the functionality of a third-party system, the performance of which within the framework of the task would be redundant. In addition, we immediately refused to integrate with several back-office systems, making a stub that responds to our system with a certain delay (we all know how dangerous it is to test the system on ultra-fast mocks).
But the most significant change in the testing paradigm is the rejection of the load testing of the UI terminal. Until now, this seems strange, but before us this server software was load-tested through the UI ATM. This happened as follows: some average user was emulated, which passed through some kind of scenario pool with a set of middle pauses (picing, think time), and the load tool was forced to create a load that consists of long and “cold” scenarios from several load generators HP Loadrunner, while the resulting load on one node of the API server was only about a hundred (!) Transactions per second. (Let's leave out the insane picture when thousands of citizens are trying to click on the controls of a single bank terminal). As a result, practically everything that was not related to the performance of the ATM backend was thrown out of the stand.
After designing and inspecting the remaining infrastructure, it became approximately clear how the process would be built, what benefits would be received, and it was necessary to start creating the NT process itself.
CI / CD process and software
The software code is laid out in the internal git-repository (GitLab). After committing on a special trigger, Jenkins pulls out the code on the assembly machine and tries to compile a release with a run of all the Unit tests. After a successful build using scripts, the assembled build is installed in two test environments - NT and FT - and makes a restart of testing. After lifting the backend, Jenkins runs one after another FT, UI and TFT tests. Load testing is launched as a separate task, but it’s worth mentioning separately.
As everyone knows, the classic load testing tool consists of three “pillars”: a test data generator, a load generator and an analyzer of the results obtained. Therefore, we solved the problem in three directions.
In order to compile a relevant request to the API and not to rewrite XML each time for a changing specification, we went the other way - we “rob” the TOP-10 of the main payment scenarios at the time of the UI test run. To do this, we deployed tshark on a test bench, from which dump we collect XML (we will later send it to the API). This allows you to save a lot of time and effort on the preparation of test data.
We used the most popular tool in the Open Source market, JMeter, as a load generator, but Yandex.Tank was used as a binding tool for it. JMeter's capacity to send 100 transactions per second to one node is more than enough, and Tank gives us convenience in automation and several useful features - auto-stop, interactive graphics, the ability to use other load generators without reshaping the NT process, etc.
The most difficult part in the design phase of NT is the analytical part. Since there are no separate solutions on the market to create our analytics for performance testing, we decided to use Overload from Yandex . Overload is a service for storing and analyzing load test results. You create the load from your load generators, and upload the results to the service and watch them there in the form of graphs. Now the service is in a public beta, and for Jet Infosystems, Yandex has created a pilot private instance.
All data from our JMeter comes to Overload in an aggregated form and does not contain any personal information about payments and customers - the user sees only a graphical representation of performance tests.
The most interesting
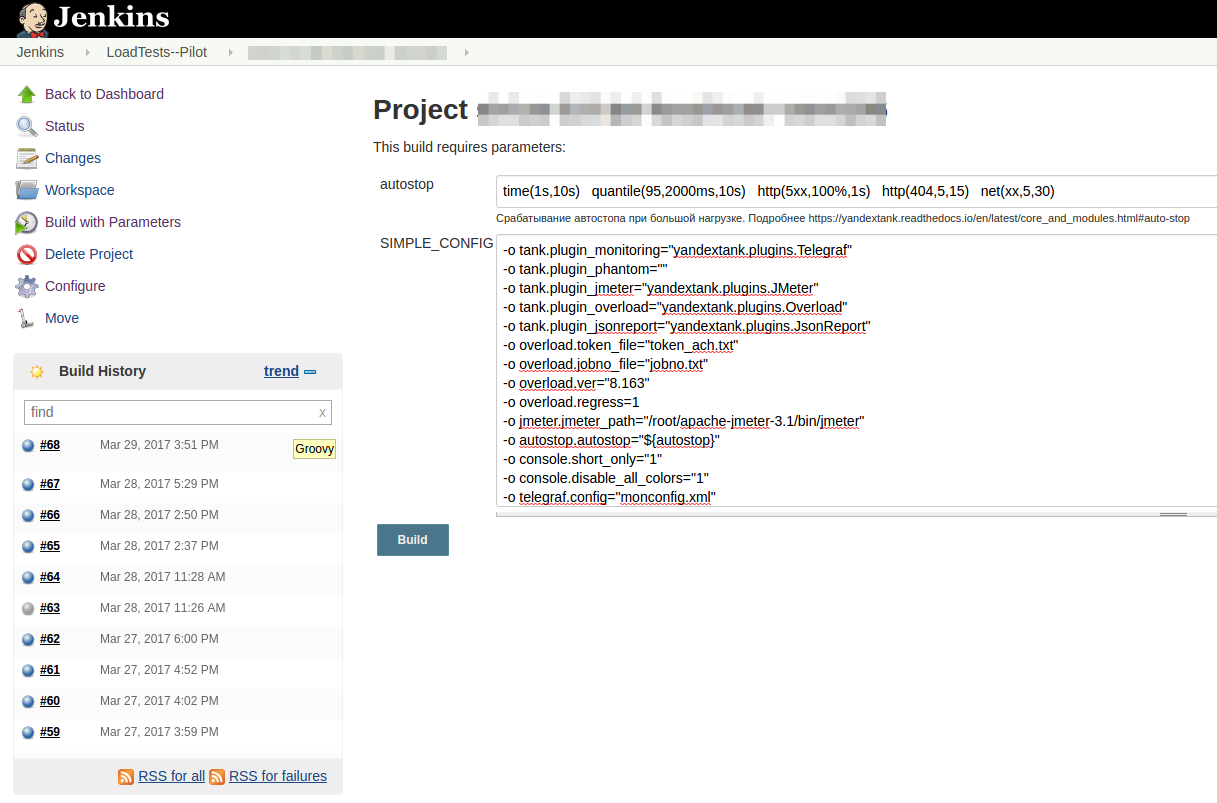
After the build gets to the load stand, a special task for load testing is started via scripts in Jenkins. The task is configured in the classical way, through shell scripting and parameterization.
For example, so you can configure auto stop:
This is the Yandex.Tank config:
And this is what the shell script example of starting the whole NT process looks like:
As you can see, all the settings are quite primitive. With the automatic launch of the job, the default settings are applied automatically, while manually starting the job, you can configure the shooter with the Jenkins parameters without understanding the documentation and not digging into the Linux machine and sorting out the necessary configs.
The “Start by button” mode for the developer looks like this:
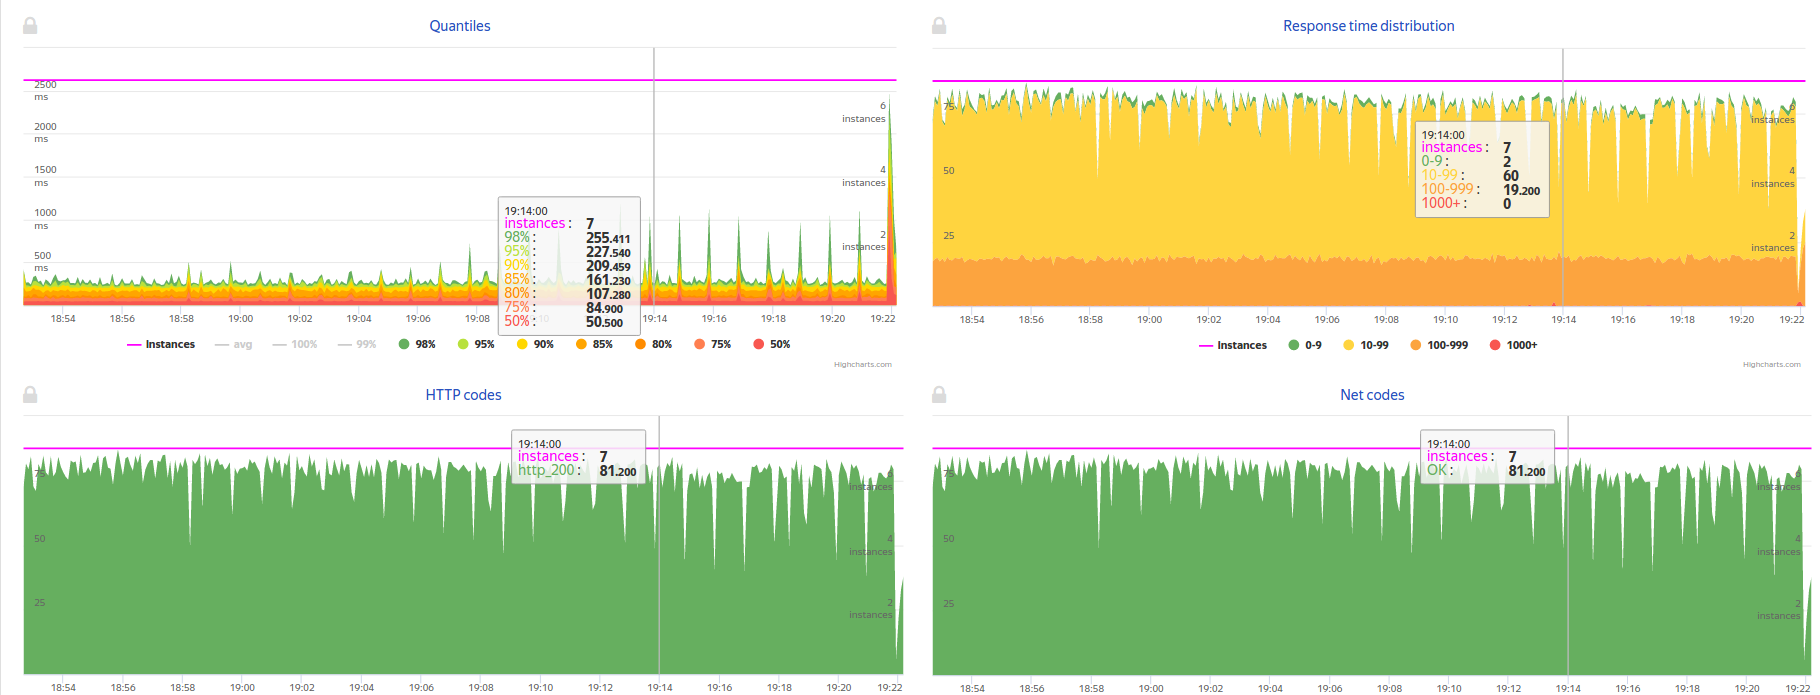
After running the test, you get a link to the Console View Jenkins and Telegram, by clicking on which you can watch the load test in real time:
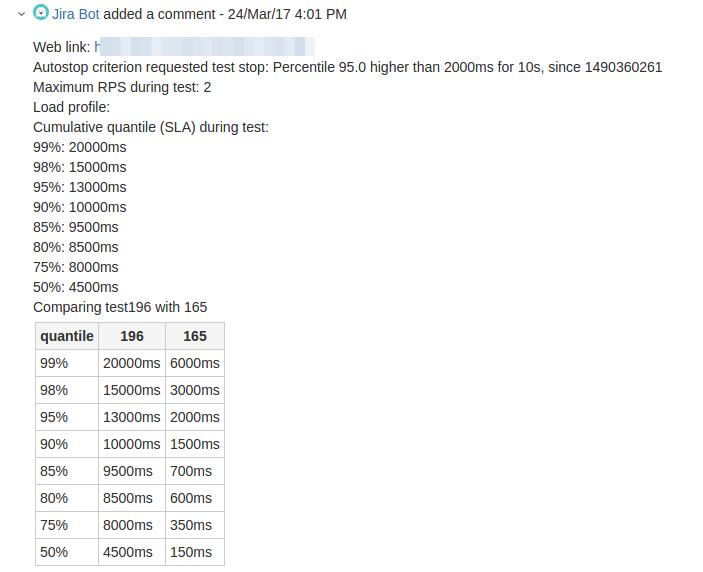
If the test results are beyond the SLA, the test automatically stops and you receive a report in Telegram, mail and JIRA about problems with the release. If the result is good, then after the report, the release receives the status of SUCCESS and is ready for deployment to the loaded environment, in production.
Screen from Telegram screen:
And so the bot reports the results to JIRA:
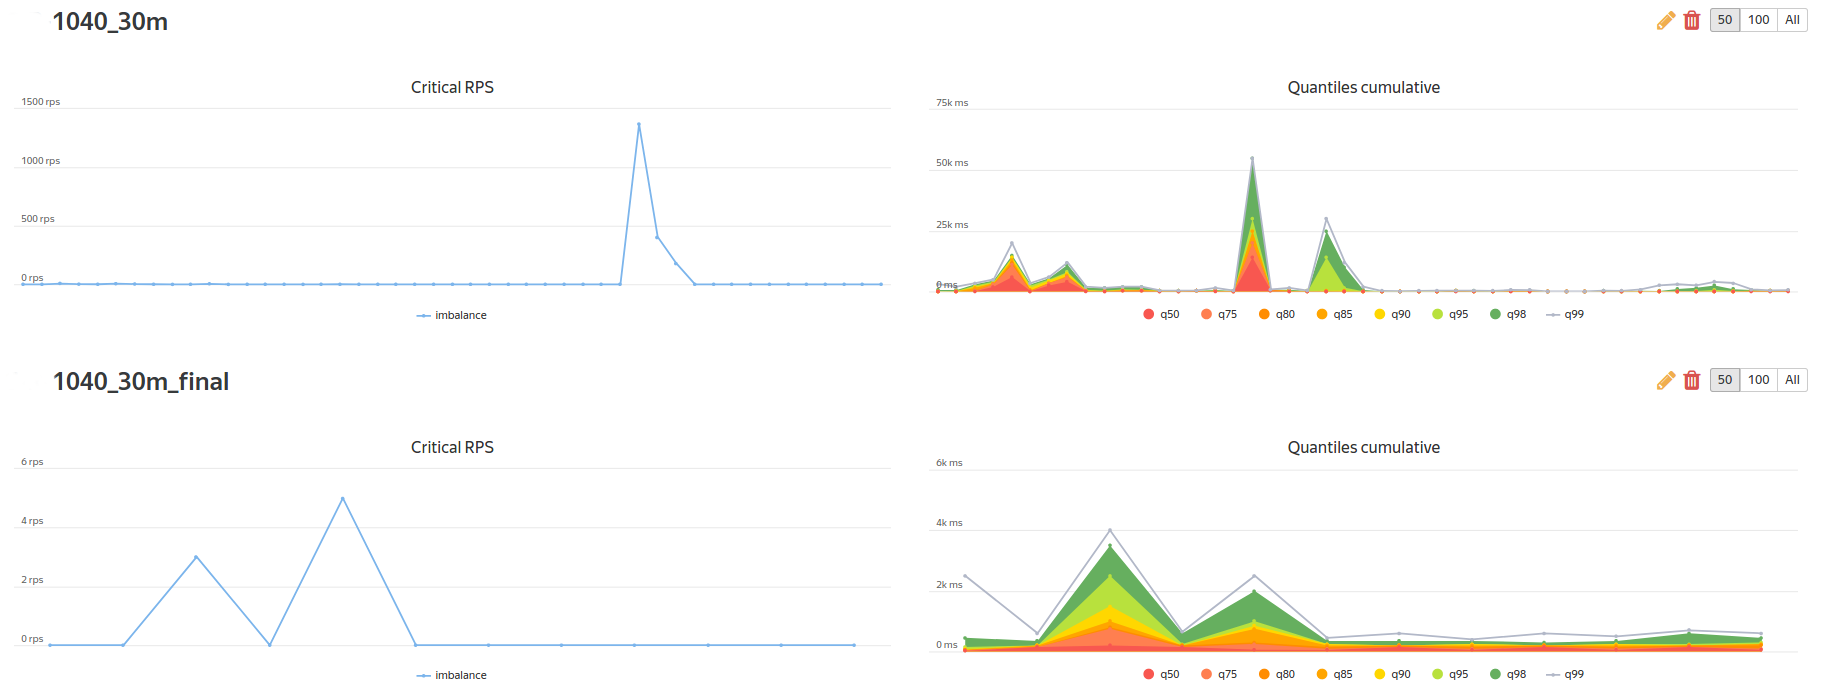
As a corporate “bun” from Yandex, we have access to a comparison of tests:
and access to the construction of regression reports on KPI-metrics:
Problems and Solutions
This story would be incomplete if we did not describe a few rakes, which came across in the course of their work.
Monitoring Obviously, during load testing, you are obliged to use not only business monitoring tools (transaction validation, queue size, transmission speed), but also system monitoring (processor consumption, memory size, number of disk operations, metrics that you invented yourself, etc.) d.). Well, when you have all the infrastructure built on Linux - using the integrated telegraf solution over ssh solves this problem - all data is automatically uploaded to the statistics backend and built synchronously with the business metrics aggregates. But what to do if you have a part of the test environment built on a Windows platform?
We discussed various options and came up with this:
In this case, all metrics from servers and load generators are written to InfluxDB by local telegraf agents, and Yandex.Tank monitoring already extracts data from InfluxDB with a simple script and pulls data into Overload. This approach eliminates the support of the entire zoo of operating systems from Yandex.Tank and avoids the need for a “one-to-all” connection.
Having written the simplest script, like:
from inflow import Client import sys try: connect = Client(sys.argv[1]) try: query_string = "SELECT LAST(" + sys.argv[4] + ") FROM " + sys.argv[3] + " WHERE host='" + sys.argv[2] + "';" result = connect.query(query_string) print (result[0]["values"][0]["last"]) except: print ("Bad request or something wrong with DB. See logs on " + sys.argv[1] + " for details.") except ValueError: print("Something wrong with parameters. " "Usage: python ./influx_picker <http://db_host:port/dbname> <target_host> <group> <metric>") except IndexError: print("Usage: python ./influx_picker <http://db_host:port/dbname> <target_host> <group> <metric>") We can make Yandex.Tank collect Custom-metrics from InfluxDB with this monitoring config:
<Monitoring> <Host address="localhost" interval="5"> <Custom diff="0" measure="call" label="cpu_sys">python influx_picker.py http://<INFLUXDB_IP>:8086/target_host target_host cpu usage_system</Custom> <Custom diff="0" measure="call" label="cpu_usr">python influx_picker.py http://<INFLUXDB_IP>:8086/target_host target_host cpu usage_user</Custom> <Custom diff="0" measure="call" label="cpu_iowait">python influx_picker.py http://<INFLUXDB_IP>:8086/target_host target_host cpu usage_iowait</Custom> <Custom diff="0" measure="call" label="mem_free_perc">python influx_picker.py http://<INFLUXDB_IP>:8086/target_host target_host mem available_percent</Custom> <Custom diff="0" measure="call" label="mem_used_perc">python influx_picker.py http://<INFLUXDB_IP>:8086/target_host target_host mem used_percent</Custom> <Custom diff="0" measure="call" label="diskio_read">python influx_picker.py http://<INFLUXDB_IP>:8086/target_host target_host diskio read_bytes</Custom> <Custom diff="0" measure="call" label="diskio_write">python influx_picker.py http://<INFLUXDB_IP>:8086/target_host target_host diskio write_bytes</Custom> </Host> </Monitoring> As a result, we get the following charts in Overload:
Reporting We used two types of reporting results.
A brief report - a small amount of metainformation with the distribution of times and a message from the autostop plug-in - was sent as a message to the Telegram-chat, to which the developers, the architect, the manager and the testers were signed.
The regression report — an advanced report, where a comparison with the reference results was added to the brief information — was sent as a comment to JIRA.
To do this, we used the Groovy script for Telegram and a simple lib (more on https://pypi.python.org/pypi/jira/ ) for connecting with the JIRA API.
Conclusion
As you can see, this task is not from the category of Rocket Science, and you could read similar articles here , here, and even watch the video here . Under the hood are the usual scripts and services - we just wanted to demonstrate that in fact, by the era of “Devops” and general automation, the financial sector has been ready for a long time, just need to have the courage and political will to introduce modern and fast processes.
What are the benefits we can get from automation?
- The gain in speed of testing: we get the results a maximum of 2 hours after the commit, while with manual testing it takes about a week or two.
- Power advantage: 3 virtual servers versus about ten physical servers (!).
- License win: Jmeter vs Loadrunner, Telegraf vs Sitescope / Tivoli and high vendor independence.
In the following articles we will tell about our experiments with InfluxDB in terms of performance and engine optimization. Follow the news!
Team load testing company "Jet Infosystems".
Source: https://habr.com/ru/post/329014/
All Articles