Meine Überwachung, or a tale of beautiful monitoring - the beginning
Now only the dead one who does not have it does not write about monitoring. We have monitoring in Tenzor - this is our own metrics collection system (although this is not its only purpose), which is closely integrated with Zabbix.
If you are wondering how the monitoring of 5K servers in our company works, what problems did we encounter on the way to 1.5M metrics , 65K values per second and the current solution, and how we even came to such a life, welcome to cat.

Long time ago, back in the 90s, Tenzor was developing not the current web services with millions of users, but the usual desktop application — a system for keeping stock and accounting records. It was the usual, maximum with a network database, an application that worked on the client’s hardware. Accountants prepared statements in it, printed and wore "legs" in tax.
')
Of all the “server” capacities, then we ourselves had nothing at all - a couple of servers for programmers to assemble a release and a server for the corporate database of the accounting system. For them, "half-eyed" looked at a couple of "admins", whose main occupation was helpdesk users.
Then we were able to save our accountant clients from going to government agencies - our desktop application still helped them prepare reports, but sent them to the tax office itself — via our server via the mail protocol.
If someone thinks that “exchanging mail with tax” is just a couple of mail servers, then this is not so much. Here is added the “hill” of proprietary software and hardware solutions for providing secure channels, its own for each state body - the Federal Tax Service, the Pension Fund, the Rosstat, ... there are a lot of them. And each such solution has its own “troubles”: requirements for the OS, hardware, service regulations ...
It is clear that such a principle of work required the growth of server capacity on our side, and the “pair of admins” has ceased to be enough for all tasks. At this moment, we have a specialization of “admins”, which has been preserved to this day, even though there are already more than 70 people:
At that moment, we realized that without some reasonable automation of monitoring all this “zoo”, we would quickly get bogged down under a heap of problems.

Actually, all monitoring is needed only for one task - the detection of anomalies / problems in the observed system. And the sooner - the better, ideally - even before the problem happens. And if it happened, we should be able to analyze all the information taken and understand what led to it.
In fact, the whole monitoring development cycle is as follows:
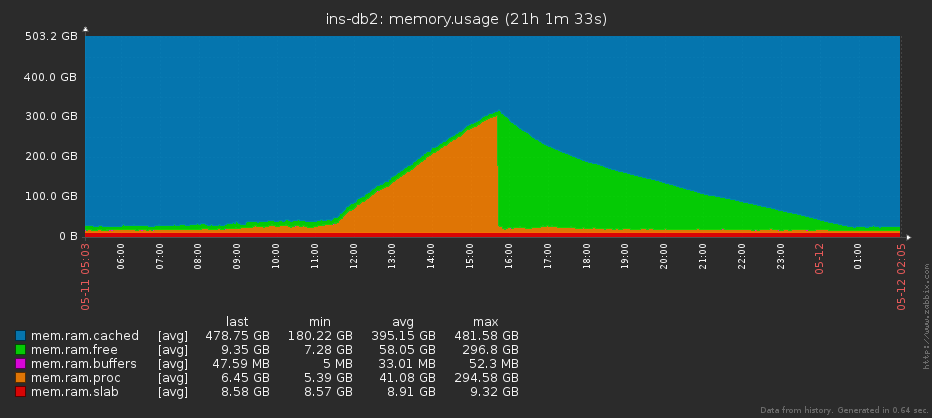
Well, for example, it happens that the server runs out of memory. Technically, the reasons may be different (“did not release on time”, “application flows”, “GC did not work”, ...), but the symptoms are almost always the same - gradually the amount of occupied memory becomes more and more.
Many people like to monitor the “free memory”, but this is not entirely correct, because with the pagecache being actively used, it may be almost impossible even in normal conditions.
The image is clickable and opens in the current tab of the web browser.
Accordingly, if we analyze the growth dynamics and the current state, then we will understand in time, at which point it is time to stop hoping for “resolve itself”, and it is time to raise the alarm.
At various stages, we managed to try Nagios, Graphite as the core of the monitoring system and stopped at Zabbix, which we still use quite successfully to monitor several thousand servers. For several years we have accumulated considerable experience in its operation, administration and tuning. And all this time he was doing quite well with his tasks.
Nevertheless, we probably attacked all possible and impossible rakes. And this is the most rewarding experience.
So, the main problems we encountered (attention! Hereafter, there is a lot of pain and suffering):
The operation service later learned about infrastructure problems, and the developers did not have a tool to analyze the effectiveness of their solutions. Ultimately, all this, one way or another, affected the effectiveness of our decisions.
 After realizing the fact that our monitoring is a collection of wrong architectural solutions (I don’t know if the lack of architecture can be considered an architectural solution), we decided that it was impossible to live this way anymore. And they began to think about how to correct all the shortcomings described, but without radical solutions, such as replacing Zabbix with something else. Still, to abandon the accumulated experience and try to eradicate the perennial habits - probably not the best idea. Zabbix is a great tool if used correctly.
To begin with, we determined for ourselves the following criteria that I want to receive:
Since Zabbix operates as a “host” as an object of monitoring, and we needed a “service” (for example, a specific one from several instances of DBMS deployed on one machine), we fixed certain rules for naming hosts, services, metrics and complex screens so that they would not "Broke" neither the logic of Zabbix, nor "human comprehension":
For example: some-db.pgsql.5433: db.postgres . If the port is default, then it is not indicated to facilitate perception.

The image is clickable and opens in the current tab of the web browser.
We did not give this system a name, but the working title “sbis3mon” was fixed inside the company, and some people called it “beautiful monitoring” with a light hand. Why beautiful? We have tried to make it not just functional, but also visual.

The image is clickable and opens in the current tab of the web browser.
At the moment, we have already developed dozens of modules for monitoring various equipment and services used in Tensor:
In the near future it is also worth monitoring MySQL, network equipment and telephony services (Asterisk).
We chose Node.js as a platform - because of a developed ecosystem, asynchrony, simplicity of work with the network, ease of scaling (cluster module), and development speed.
We also adopted the Continuous Delivery approach and began attaching wings to the aircraft on the fly. Thanks to frequent releases, we quickly received feedback and could adjust the direction of development. The system was built in front of our main users - employees of the operation service, while they continued to use the usual monitoring shell. Gradually, we replaced the old monitoring methods with new ones until we completely eliminated them.
The system is based on microservice architecture and consists of 5 main parts:
We use PostgreSQL as a DBMS. But the base here is secondary and not very interesting - there are stored settings of hosts and services, detected entities, links to Zabbix resources and audit log entries, and no highload.
The image is clickable and opens in the current tab of the web browser.
The most interesting is services. They can work both on one server and on different ones.
Master and collectors have a common code base - the core. Depending on the launch parameters, the process becomes either a master or a collector.
Master Process Functions:
Functions of collectors :
Now our several thousand hosts and tens of thousands of services on them are served by collectors living on only two servers , 40 and 64 cores, with an average load of about 20-25% - that is, we can easily withstand the further growth of our server park in 3 4 times.
In the next part, we will tell in more detail about the solutions that allowed our monitoring to withstand the growth of load and user requirements, while the Tensor was transformed from a reporting operator into a real multi-service service provider with millions of online users.
Authors: vadim_ipatov (Vadim Ipatov) and kilor (Kirill Borovikov)
If you are wondering how the monitoring of 5K servers in our company works, what problems did we encounter on the way to 1.5M metrics , 65K values per second and the current solution, and how we even came to such a life, welcome to cat.
When the trees were big
Long time ago, back in the 90s, Tenzor was developing not the current web services with millions of users, but the usual desktop application — a system for keeping stock and accounting records. It was the usual, maximum with a network database, an application that worked on the client’s hardware. Accountants prepared statements in it, printed and wore "legs" in tax.
')
Of all the “server” capacities, then we ourselves had nothing at all - a couple of servers for programmers to assemble a release and a server for the corporate database of the accounting system. For them, "half-eyed" looked at a couple of "admins", whose main occupation was helpdesk users.
Then we were able to save our accountant clients from going to government agencies - our desktop application still helped them prepare reports, but sent them to the tax office itself — via our server via the mail protocol.
If someone thinks that “exchanging mail with tax” is just a couple of mail servers, then this is not so much. Here is added the “hill” of proprietary software and hardware solutions for providing secure channels, its own for each state body - the Federal Tax Service, the Pension Fund, the Rosstat, ... there are a lot of them. And each such solution has its own “troubles”: requirements for the OS, hardware, service regulations ...
It is clear that such a principle of work required the growth of server capacity on our side, and the “pair of admins” has ceased to be enough for all tasks. At this moment, we have a specialization of “admins”, which has been preserved to this day, even though there are already more than 70 people:
- helpdesk - serve the work of local users in our offices;
- sysop - responsible for hardware, networking and system software;
- devop - do all the work of application software (both ours and third-party) on this very hardware.
At that moment, we realized that without some reasonable automation of monitoring all this “zoo”, we would quickly get bogged down under a heap of problems.
Back to the Future
Actually, all monitoring is needed only for one task - the detection of anomalies / problems in the observed system. And the sooner - the better, ideally - even before the problem happens. And if it happened, we should be able to analyze all the information taken and understand what led to it.
In fact, the whole monitoring development cycle is as follows:
- looking for the causes of the problem;
- we understand which metrics can be used to predict the situation;
- learn how to shoot, store and show them clearly;
- We implement "predictive" triggers that notify the attendant.
Well, for example, it happens that the server runs out of memory. Technically, the reasons may be different (“did not release on time”, “application flows”, “GC did not work”, ...), but the symptoms are almost always the same - gradually the amount of occupied memory becomes more and more.
Many people like to monitor the “free memory”, but this is not entirely correct, because with the pagecache being actively used, it may be almost impossible even in normal conditions.
The image is clickable and opens in the current tab of the web browser.
Accordingly, if we analyze the growth dynamics and the current state, then we will understand in time, at which point it is time to stop hoping for “resolve itself”, and it is time to raise the alarm.
Monitoring problems and monitoring problems
At various stages, we managed to try Nagios, Graphite as the core of the monitoring system and stopped at Zabbix, which we still use quite successfully to monitor several thousand servers. For several years we have accumulated considerable experience in its operation, administration and tuning. And all this time he was doing quite well with his tasks.
Nevertheless, we probably attacked all possible and impossible rakes. And this is the most rewarding experience.
So, the main problems we encountered (attention! Hereafter, there is a lot of pain and suffering):
- "Seven nannies ..." - the lack of uniform monitoring rules
Remember, I told about the specialization of "admins" above? Gradually, they were divided into different departments, and each developed its own rules for monitoring and reacting to the same factors.
Well, for example, the database runs on a host and "eats" 100% of the CPU. Joy for ironworkers is well done for iron, it doesn’t fail even under such a load! And panic workers for ironies. - Not a single template ...
Most people using Zabbix know about its powerful template system, but sometimes it stumbles upon a harsh reality.
Problems began to be added to different rules (and templates) of monitoring the same entities in different departments because of the insufficient possibility of parameterizing Zabbix itself.
For example, we have a great template with beautiful graphics for monitoring an 8 core server: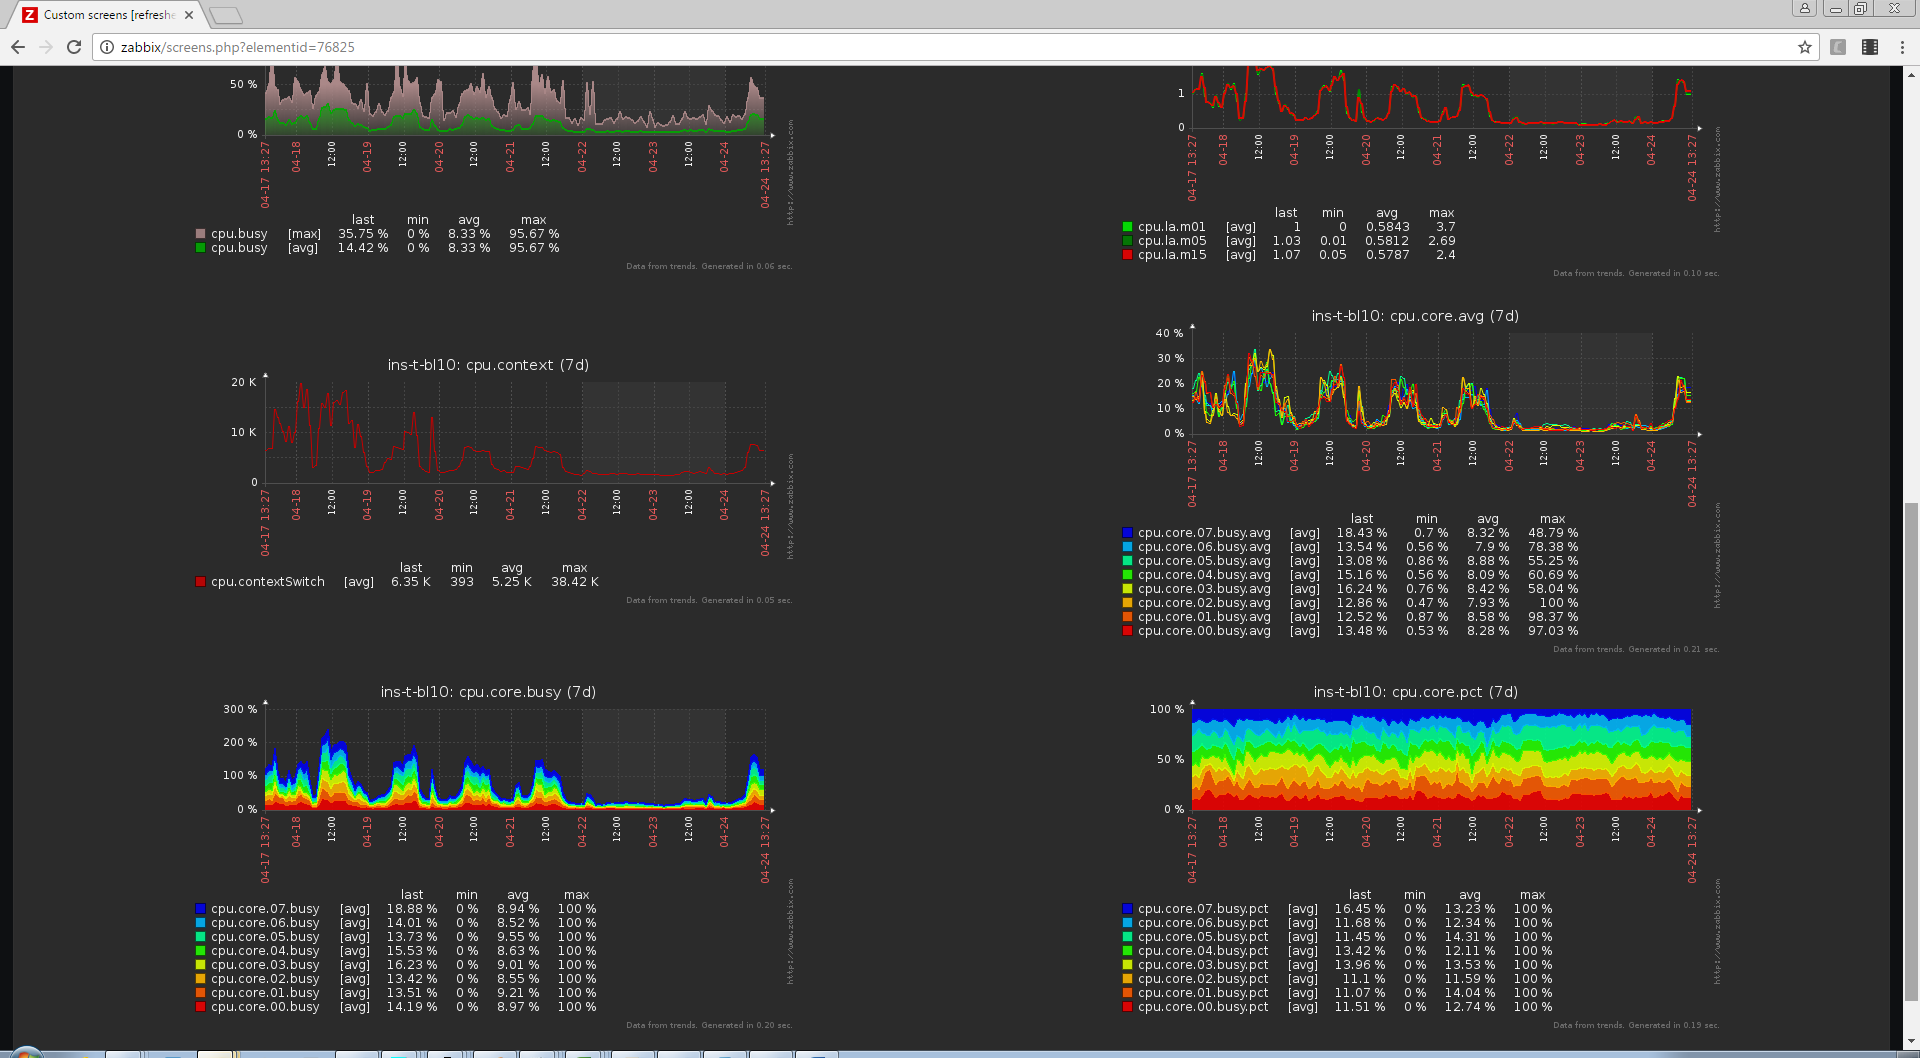 The image is clickable and opens in the current tab of the web browser.
And ... for the 16-nuclear, it no longer fits, we need a new one, with new graphs, because the number of metrics is another. But we also have 64-core hosts ...
As a result, we had a whole bunch of templates for all occasions. Only for monitoring drives there were more than a dozen. There were no strict rules on which of them should connect to the host and in what cases.
Templates had no versioning, except for marks like “old” and “very_old”. They were tied and untied as the admin ordered his heart. In some cases, the metrics were started up simply by hand, without templates. The result is a situation where different hosts are monitored differently. - Developers! Developers!
Hosts were added to monitoring manually. Despite the fact that Zabbix agent settings were poured onto servers using spacewalk, in some cases, to remove metrics it was required to log in to the server via SSH and make some changes (install scripts, install utilities, set permissions, etc.).
If the server configuration has changed, then it was necessary not to forget to pick up the right patterns. But it was still necessary to drive macros with different settings into the host config, and then check that all this works. - Uncontrollable sclerosis
This problem, in part, follows from the two previous ones: many hosts were simply not added to the monitoring. And those that were, could not have the necessary settings in the config, metrics, triggers, charts ... And even if everything was set up correctly, it still did not guarantee - the data could not be collected, for example, due to the mismatch between the version of the script and the OS .
And even if everyone was going to, the control triggers could just be accidentally disabled - after all, more than a dozen people had access to editing in Zabbix! - Overmonitoring
Zabbix perfectly knows how to collect specific values of certain metrics, but if you need to remove them from several objects at once , problems arise.
For each count, for each of the set of metrics, a request was generated, on which the target server worked on a footcloth from various kinds of atop, iostat, grep, cut, awk, etc., and a single value was returned, then the connection was closed, and the next request was initiated.
It is clear that this is bad for performance and for the observed server, and for Zabbix. But even worse - the lack of synchronicity in the received data.
For example, if we measure in turn the load of each of the CPU cores, we get zeros and ... And we don’t understand anything about the load on the CPU as a whole, since it could be on other cores at the time of each individual measurement. - Zabbix performance issues
At that stage, we still didn’t have many metrics, and Zabbix nevertheless regularly tried to “lie down” - despite all the tuning and good “hardware”.
We used passive zabbix agents and external scripts to collect the metrics. To request data from agents by Zabbix, a specified fixed number of workers is forked. While the worker is waiting for a response from the agent, he does not service other requests. Thus, often there were situations when zabbix did not have time to maintain the queue and “holes” appeared on the charts - intervals with missing data.
Monitoring with the help of external scripts also did not lead to anything good. A large number of simultaneously running different interpreters quickly led to space loading of the server. Monitoring at that time did not work, we remained “without eyes”. - The limitations of Zabbix in terms of the formation of calculated indicators
It is difficult to create even the simplest calculated metrics, such as ratio = rx / tx - elementary, you can not check the division by 0. If this happens, then for some time the metric will be disabled.
The operation service later learned about infrastructure problems, and the developers did not have a tool to analyze the effectiveness of their solutions. Ultimately, all this, one way or another, affected the effectiveness of our decisions.
After realizing the fact that our monitoring is a collection of wrong architectural solutions (I don’t know if the lack of architecture can be considered an architectural solution), we decided that it was impossible to live this way anymore. And they began to think about how to correct all the shortcomings described, but without radical solutions, such as replacing Zabbix with something else. Still, to abandon the accumulated experience and try to eradicate the perennial habits - probably not the best idea. Zabbix is a great tool if used correctly.Evolution
To begin with, we determined for ourselves the following criteria that I want to receive:
- Uniformity . Monitoring should be carried out according to the same principles for all major systems and services used in the company. That is, if we remove some metrics for a 4-core server with 2 HDDs, then for a 16-core server with 8 HDDs they should be removed as well without additional modifications.
- Modularity A common core with a minimum of service functions, which is expanded by connecting “application plug-ins” that implement monitoring of one or another type of objects.
The plugin includes:- implementation of the detection of observed objects (for example, databases on the database server);
- implementation of collecting targeted metrics;
- templates for generated triggers;
- templates of the generated graphs and integrated screens.
- Automation . Minimum manual settings, if something can be done automatically - it is better to do so.
- Efficiency . Minimum load on the target server. If a set of metrics can be obtained as the result of just one reference, it should be so. If you need to regularly receive some “internal” metrics from the database, then you should not be torturing it with reinstalling the connection, but you should just keep it.
zabbix-1: cat /proc/meminfo | grep 'MemFree' | awk '{print $2}' zabbix-2: cat /proc/meminfo | grep 'Shmem' | awk '{print $2}' sbis-mon: cat /proc/meminfo # , - Independence Whenever possible agent-less monitoring. On the server, it is desirable not to install anything in addition or to configure it, to manage with regular means. That is, yes, 'cat / proc / meminfo' is the right way.
- Monitoring as code . One of the main concepts that allows you to describe the desired final state of monitoring with code, which provides the following benefits:
- Monitoring uses the capabilities of the version control system: all changes are transparent, it is known who changed what and when, you can easily roll back to an arbitrary version at any time. The repository becomes a common tool for developers and maintenance services.
- Monitoring is fully tested in several stages: dev, QA, prod.
- Continuous integration.
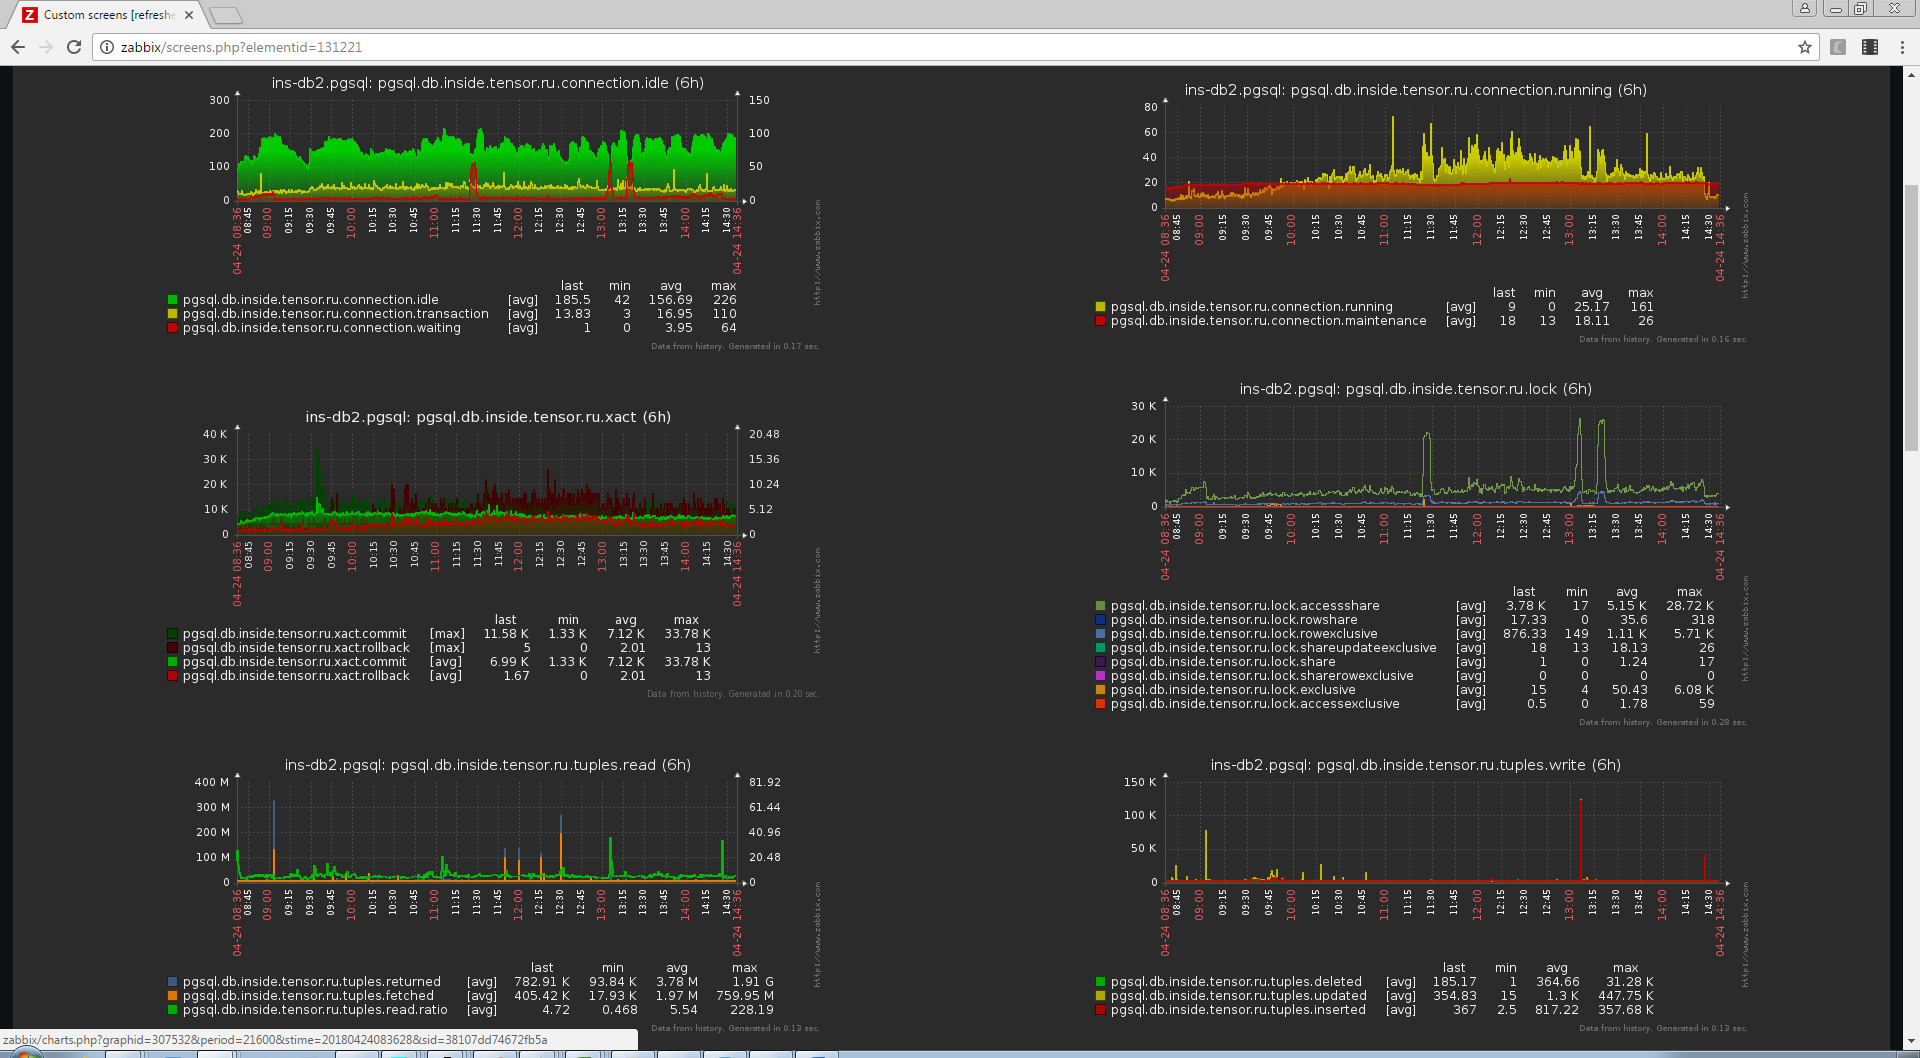
Since Zabbix operates as a “host” as an object of monitoring, and we needed a “service” (for example, a specific one from several instances of DBMS deployed on one machine), we fixed certain rules for naming hosts, services, metrics and complex screens so that they would not "Broke" neither the logic of Zabbix, nor "human comprehension":
hostname[.service[.port]][:screen] For example: some-db.pgsql.5433: db.postgres . If the port is default, then it is not indicated to facilitate perception.
The image is clickable and opens in the current tab of the web browser.
We did not give this system a name, but the working title “sbis3mon” was fixed inside the company, and some people called it “beautiful monitoring” with a light hand. Why beautiful? We have tried to make it not just functional, but also visual.
The image is clickable and opens in the current tab of the web browser.
At the moment, we have already developed dozens of modules for monitoring various equipment and services used in Tensor:
- OS: Linux and Windows;
- ESXI hypervisor and its virtual machines;
- Storage: IBM DS, Storwize, Xiv, XtremIO, Openstack Swift;
- DBMS: PostgreSQL (and pgBouncer to it), MongoDB, Redis;
- Search Engine: ElasticSearch, Sphinx;
- Messaging: RabbitMQ;
- Web: Nginx and IIS, PHP-FPM, HAProxy;
- DNS: Named (BIND);
- as well as monitoring modules of our own services.
In the near future it is also worth monitoring MySQL, network equipment and telephony services (Asterisk).
Metrics collection architecture
We chose Node.js as a platform - because of a developed ecosystem, asynchrony, simplicity of work with the network, ease of scaling (cluster module), and development speed.
We also adopted the Continuous Delivery approach and began attaching wings to the aircraft on the fly. Thanks to frequent releases, we quickly received feedback and could adjust the direction of development. The system was built in front of our main users - employees of the operation service, while they continued to use the usual monitoring shell. Gradually, we replaced the old monitoring methods with new ones until we completely eliminated them.
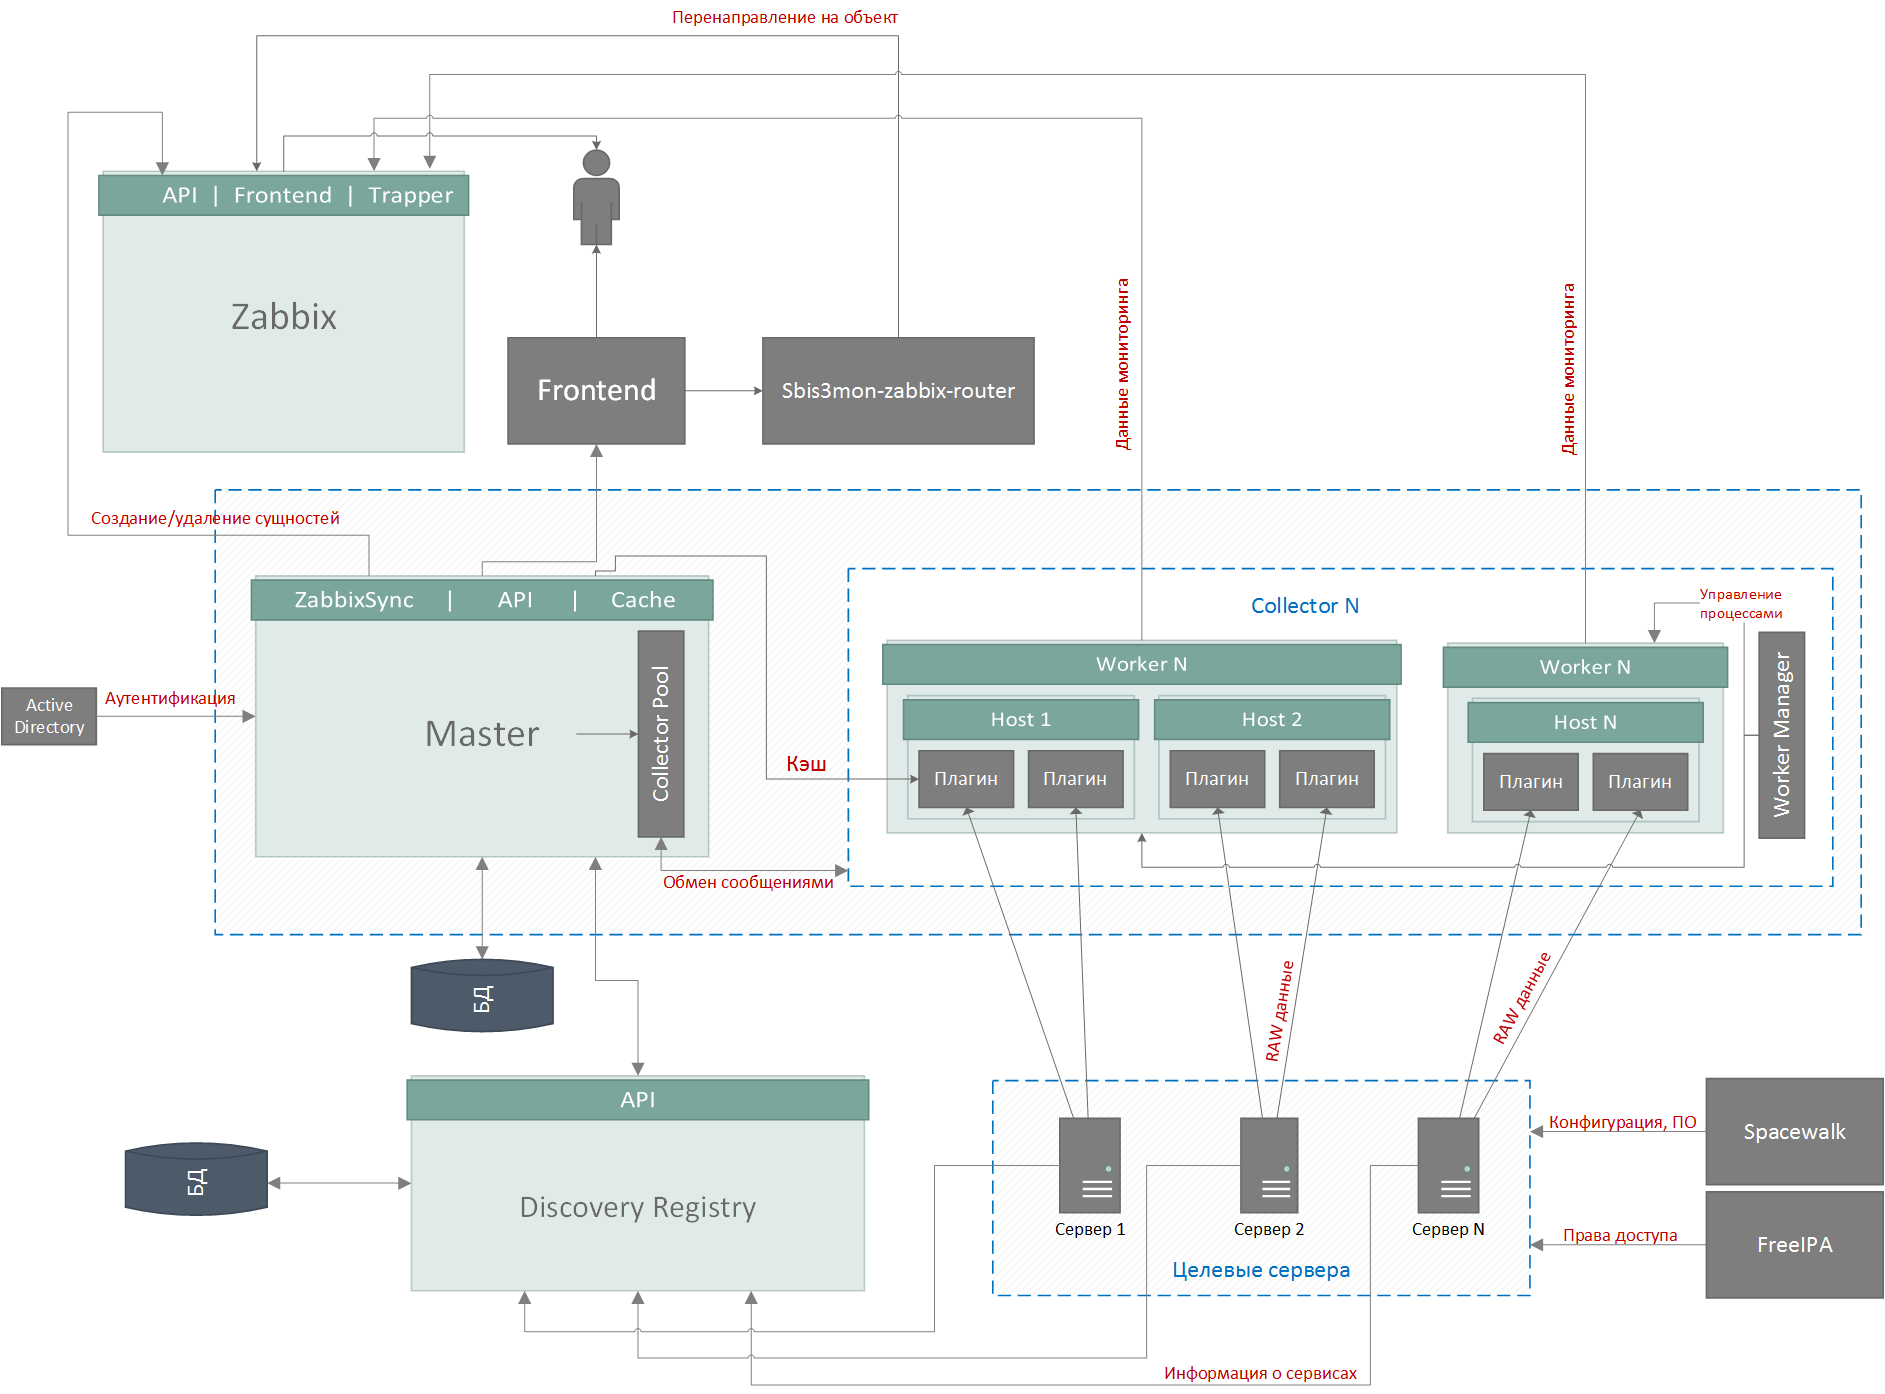
The system is based on microservice architecture and consists of 5 main parts:
- managing master process
- DB
- collectors - data collectors
- registry autodiscover
- frontend
We use PostgreSQL as a DBMS. But the base here is secondary and not very interesting - there are stored settings of hosts and services, detected entities, links to Zabbix resources and audit log entries, and no highload.
The image is clickable and opens in the current tab of the web browser.
The most interesting is services. They can work both on one server and on different ones.
Master and collectors have a common code base - the core. Depending on the launch parameters, the process becomes either a master or a collector.
Master Process Functions:
- Managing a pool of collectors, distributing tasks between them, automatic load balancing; now both collector servers are equally loaded by 25% CPU and LA = 15.
- Synchronization of entities with Zabbix and Discovery Registry, removal of "losses"
for example, instead of a “dead” HDD, a new one was mounted on a different path. - public API for frontend work and integration with external services.
Functions of collectors :
- Workflow Management (WorkerManager).
“Something in our tasks has grown, it's time to raise another child process ...” - Task management (plugins).
“Process PID 12345, you need to collect metrics of a linux plugin from a host with some host; Process PID 54321, you need to collect metrics of a postgresql plugin from a host with some-db! ” - Collecting and aggregating data with plugins.
“So, they are waiting for us for 1 count for every 5 seconds ... During the last interval, we removed the following load indicators from the CPU: [60,50,40,30,20]. So, to save the correct values of min / max / avg, we will send [min = 20, avg = 40, max = 60]. " - Grouping packages from child processes and sending data to Zabbix at the cluster.master level.
Now our several thousand hosts and tens of thousands of services on them are served by collectors living on only two servers , 40 and 64 cores, with an average load of about 20-25% - that is, we can easily withstand the further growth of our server park in 3 4 times.
In the next part, we will tell in more detail about the solutions that allowed our monitoring to withstand the growth of load and user requirements, while the Tensor was transformed from a reporting operator into a real multi-service service provider with millions of online users.
Authors: vadim_ipatov (Vadim Ipatov) and kilor (Kirill Borovikov)
Source: https://habr.com/ru/post/328920/
All Articles